


Using Ruby for almost a decade, I have a lot of experience with effectively finding my way around Ruby code. Still, Ruby programs can be very dynamic and thus tools are always welcome.
As I’ve begun to use Neo4j, I’ve been inspired by code analysis tools such as joern and jQAssistant as well as Aaron Patterson’s heap-analyzer. In that spirit, I’d like to announce a new project called Neolytics.
Neolytics is a Ruby gem which records the execution of a block of Ruby code in a Neo4j database. There are three major things which it records:
1. Each step of the execution
This is thanks to Ruby’s excellent TracePoint class. TracePoint gives a hook into each execution step of Ruby code so that we can record line executions, method calls/returns and raising of executions.

2. Objects which are found along the way
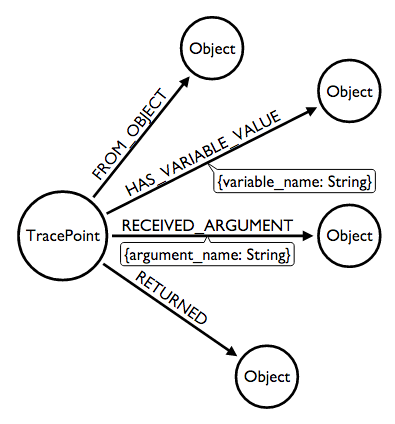
For each trace point, Neolytics finds:
- The object which is the context of the TracePoint
- Objects which are passed as arguments (if a call)
- Objects which are returned (if a return)
- Objects which are referenced via variables

3. Abstract syntax trees of all Ruby code files involved in the execution
With thanks to the parser gem! Additionally, method definitions in the AST are linked to their corresponding TracePoint.


To record the data, I used my neo4apis gem to send data to Neo4j efficiently without a lot of round trips to the database.
Lastly, I’ve built a ruby_code_analytics Rails application to give a UI to examine the results of the dump. You can see an example running on Heroku which is a record of the following simple Ruby code:
neo4j_session = Neo4j::Session.open(:server_db, neo4j_url)
Neolytics.record_execution(neo4j_session) do
  doc = Nokogiri::HTML(open('https://www.google.com').read)
  doc.xpath('//form/input').map(&:name)
end
Querying the Data
Let’s look at some examples of things that you can do with the data from neolytics!Examining the Execution
Let’s say that we want to know what goes on during the execution of a method. With the following query, we grab the first TracePoint which was a
call event and find the entire series of TracePoints until the method is returned from:
MATCH (call_tp:TracePoint {event: 'call'})
WITH call_tp LIMIT 1
MATCH path=shortestPath((call_tp)-[:NEXT*]->(return_tp:TracePoint {event: 'return'}))
RETURN path
Visually we can see the query like this:

In this case, the method is the
#plural method from the active_support gem which lets you pluralize strings. You can compare the graph database model with the actual source code here on GitHub.In the screenshot above, each node is displaying a TracePoint event (i.e.
call, line, etc…), the class and method in question and the line number. Starting from the node on the left, you can follow the NEXT relationships to see each point in the execution.Note that every node has a
HAS_PARENT relationship back to the call TracePoint, so we can see that this method didn’t make any further method calls (at least no Ruby calls; we see some c_call events which TracePoint doesn’t expose).Lastly, note the
STARTED_AT relationship from the return event to the call event which is there as a convenience for any query that needs to get both nodes at once (e.g., if you need to get both the arguments and the return value of a method).For more details, you can see this example tabular output of the TracePoints.
Running Code Metrics
Let’s run a query to evaluate the cyclomatic complexity of our methods:
MATCH (def:ASTNode {type: 'def'})
OPTIONAL MATCH (def)<-[:HAS_PARENT*]-(condition:ASTNode)
WHERE condition.type IN ['begin', 'if', 'while', 'until', 'for', 'rescue', 'when', 'and', 'or']
RETURN def.name, def.file_path, def.first_line, count(condition)
ORDER BY count(condition) DESC
LIMIT 10
This gives us a straightforward listing of methods, where to find them, and their complexity score, all ordered with the most complex methods at the top:
| method | Path and line | complexity |
|---|---|---|
| initialize_pattern | …/rubies/ruby-2.2.3/lib/ruby/2.2.0/uri/rfc2396_parser.rb:342 | 85 |
| validate | …/rubies/ruby-2.2.3/lib/ruby/2.2.0/rubygems/specification.rb:2453 | 65 |
| perform_arguments | …/gems/ruby-2.2.3/gems/sass-3.4.20/lib/sass/tree/visitors/perform.rb:14 | 57 |
| _next_token | …/gems/ruby-2.2.3/gems/nokogiri-1.6.7/lib/nokogiri/css/tokenizer.rb:55 | 56 |
| parse | …/gems/ruby-2.2.3/gems/tzinfo-1.2.2/lib/tzinfo/zoneinfo_timezone_info.rb:95 | 55 |
| pretty_print | …/rubies/ruby-2.2.3/lib/ruby/2.2.0/pp.rb:421 | 53 |
| merge_final_ops | …/gems/ruby-2.2.3/gems/sass-3.4.20/lib/sass/selector/sequence.rb:342 | 52 |
| call | …/gems/ruby-2.2.3/gems/sprockets-3.5.2/lib/sprockets/server.rb:22 | 48 |
| convert_input | …/gems/ruby-2.2.3/gems/erubis-2.7.0/lib/erubis/converter.rb:127 | 43 |
| visit_rule | …/gems/ruby-2.2.3/gems/sass-3.4.20/lib/sass/tree/visitors/to_css.rb:280 | 43 |
MATCH (tp:TracePoint)
WITH sum(tp.execution_time) AS total_execution_time

MATCH (node:ASTNode {type: 'def'})
OPTIONAL MATCH (node)<-[:HAS_PARENT*]-(condition:ASTNode)
WHERE condition.type IN ['begin', 'if', 'while', 'until', 'for', 'rescue', 'when', 'and', 'or']
WITH node, count(condition) AS complexity, total_execution_time

MATCH (node)<-[:HAS_AST_NODE]-(tp:TracePoint)<-[:STARTED_AT]-(return_tp:TracePoint)

WITH
  complexity,
  total_execution_time,
  tp.path + ':' + tp.lineno + ' (' + return_tp.defined_class + '#' + return_tp.method_id + ')' AS method,
  count(tp) AS executions,
  sum(return_tp.execution_time) AS total_method_execution_time

RETURN
  method,
  complexity AS cc,
  executions AS execs,
  total_method_execution_time AS total_time,
  100.0 * (total_method_execution_time / total_execution_time) AS percentage_of_total_time,
  total_method_execution_time / executions AS avg_exec

ORDER BY total_method_execution_time DESC
LIMIT 10
With this, we get a nice table of methods which take the most time, along with their cyclomatic complexity. We can sort by either metric or create a combined metric of our own in order to determine which methods might be ripe for refactoring.
| method | cc | execs | total_time | % total time | avg_exec |
|---|---|---|---|---|---|
| …/rubies/ruby-2.2.3/lib/ruby/2.2.0/set.rb:289 Set#add |
1 | 2343 | 11457 | 2.31 | 4.89 |
| …/gems/ruby-2.2.3/gems/activesupport-4.2.5/lib/active_support/inflector/methods.rb:91 ActiveSupport::Inflector#underscore |
6 | 237 | 5057 | 1.02 | 21.34 |
| …/gems/ruby-2.2.3/gems/pry-0.10.3/lib/pry/command.rb:27 #<Class:Pry::Command>#match |
4 | 810 | 4917 | 0.99 | 6.07 |
| …/gems/ruby-2.2.3/gems/pry-0.10.3/lib/pry/command.rb:43 #<Class:Pry::Command>#command_options |
2 | 641 | 3790 | 0.76 | 5.91 |
| …/gems/ruby-2.2.3/gems/pry-0.10.3/lib/pry/command.rb:177 #<Class:Pry::Command>#command_regex |
6 | 510 | 3722 | 0.75 | 7.30 |
| …/gems/ruby-2.2.3/gems/pry-0.10.3/lib/pry/command.rb:185 #<Class:Pry::Command>#convert_to_regex |
1 | 1020 | 3537 | 0.71 | 3.47 |
| …/gems/ruby-2.2.3/gems/activesupport-4.2.5/lib/active_support/dependencies/autoload.rb:35 ActiveSupport::Autoload#autoload |
4 | 233 | 3186 | 0.64 | 13.67 |
| …/gems/ruby-2.2.3/gems/sprockets-3.5.2/lib/sprockets/utils.rb:33 Sprockets::Utils#hash_reassoc1 |
4 | 115 | 2366 | 0.48 | 20.57 |
| …/gems/ruby-2.2.3/gems/activesupport-4.2.5/lib/active_support/core_ext/module/delegation.rb:151 Module#delegate |
36 | 43 | 1164 | 0.23 | 27.07 |
| …/gems/ruby-2.2.3/gems/pry-0.10.3/lib/pry/command.rb:37 #<Class:Pry::Command>#description |
2 | 152 | 1158 | 0.23 | 7.62 |
More Options
There are many ways to use this data model to debug and otherwise analyze our code. I’ve provided some more sample queries in the README for the neolytics gem. I’ve also started a list of ideas for new queries which could be made.
These could be used directly or perhaps built into a reporting feature of the
ruby_code_analytics Rails application. I’m excited to see where things could go!Analysis app running on Heroku: https://ruby-neo4j-code-analysis.herokuapp.com
Want to learn more about graph databases? Click below to get your free copy of O’Reilly’s Graph Databases ebook and start using graph technology in your next app or project.


