


The conversation went something like this:
“You see, Armstrong, graph theory started in 1736. There was this chap named Leonhard Euler, and he was trying to solve the Seven Bridges of Königsberg problem. Königsberg had seven bridges and Euler wanted to compute a path through the city that would cross each bridge once and only once.”
“Where was he going?” asked Armstrong.
“I have no idea… it’s not really the point of the problem,” I replied.
“Why was he not allowed to cross a bridge twice?”
“Never mind. There’s another famous graphy mathematical problem called the Travelling Salesman Problem. Imagine there’s a travelling salesman who needs to visit a number of cities. He wants to optimise the route he takes to visit these cities, to minimize travel cost and the total distance travelled, while still returning to where he started.”
“Does he sell treats? Is he coming here?” Armstrong was getting excited.
“He might sell treats, I don’t know, but he’s definitely not coming here.”
At this point, it would probably help if I introduce Armstrong. He’s very cute, and a better conversationalist than you might imagine, but he was still no closer to understanding graph databases.
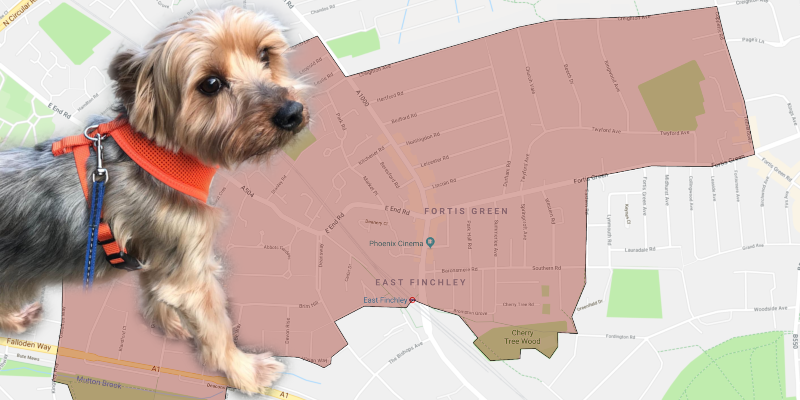
Armstrong’s territory, courtesy of Google Maps.
So, I decided to come up with an example that would explain graph databases in terms that Armstrong could understand. I now present to you The Seven Bridges of Königsberg: A Dog’s Eye View.Armstrong’s primary job is to protect
It’s tireless, relentless work – the evil Kitty Army has scouts everywhere, and they’re always looking to gain a foothold inside our territory, so Armstrong has to be out on patrol several times a day.
The thing is, that’s a lot of territory to cover every day. At best we can only patrol a fraction of it each time we go out for a walk. It’s hard to keep track of all the streets we’ve walked on recently, so that we can make sure to regularly patrol all the obscure bits of our territory before it’s overrun by a Kitty invasion.
Like Euler, Armstrong prefers to avoid retracing his steps – there’s no point in patrolling the same street more than once during a walk, and anyhow retracing your steps is so boring! Like our Travelling Salesman, we want to craft an optimal route that covers the most territory possible – especially territory we haven’t covered recently – while returning back home at the end. This is definitely a job for the graph!
I started by creating a graph representing our territory. I modeled intersections as nodes, and the streets and paths in our neighbourhood as relationships – this created a very natural and easy to visualise a map of our neighbourhood:
MATCH path = (:Intersection)-[:STREET|PATH]->(:Intersection)
RETURN path
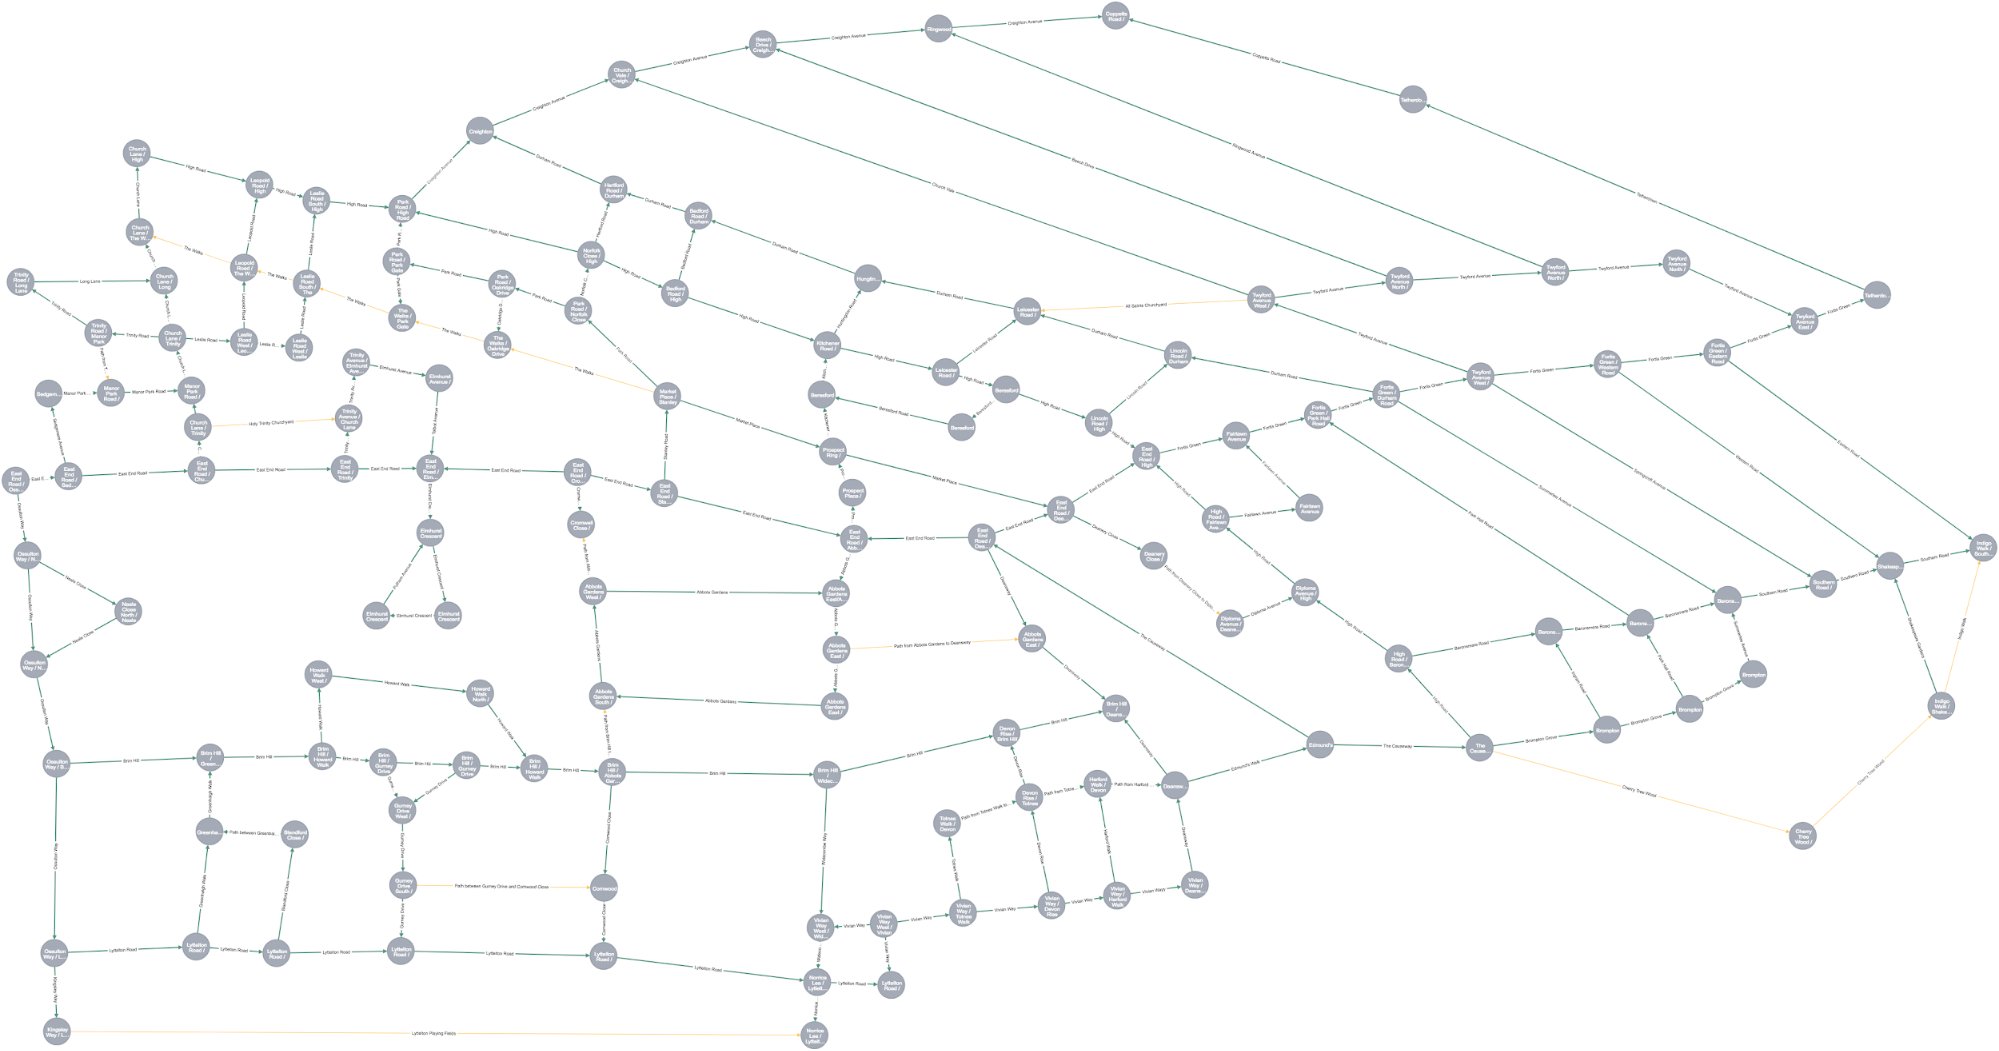
I did cut a few corners when creating the graph. I left out dead-end roads (since we don’t walk on them, retracing your steps is boring after all), and I simplified a few intersections where the roads involved are close on the map but not exactly aligned. Ease of use is more important here than absolute accuracy!
It’s also important to note that when relationships are created in Neo4j they always have a direction – but in this case the direction isn’t really important, since we can travel down each street or path in either direction.
With the map of our territory converted to a graph, I then kept track of all of Armstrong’s walks for 10 days, so we could figure out which parts of our territory we’ve covered recently and which parts we haven’t.
It wasn’t really important to record a snapshot of each walk (in fancy data architecture speak, a “temporal view”) – all we want to know is when was the last time a street or path was patrolled. I stored the dates and times of our walks in a
"last_walked" property on our STREET and PATH relationships. There were some streets and paths in our territory that we hadn’t walked on at all during the time I kept records, so for these I recorded a baseline date of January 1, 2019. I then created a
"newness" property on each relationship by calculating the time duration between the "last_walked" property and the baseline date I used. This gives our relationships a sort of weight we can use for our pathfinding, where the most recently traveled streets, or paths, have a higher "newness" value (or a higher “weight”) and the ones we set to the default date have a "newness" value of zero (the minimum “weight”). I also created a corresponding “oldness” value, by subtracting each relationship’s
"last_walked" value from the maximum "last_walked" value in the data, to make it easier to find the streets and paths which were most recently walked.As an example graph view of a walk, here’s our last recorded walk:
MATCH p = (:Intersection)-[:PATH|STREET {oldness: 0}]->(:Intersection)
RETURN p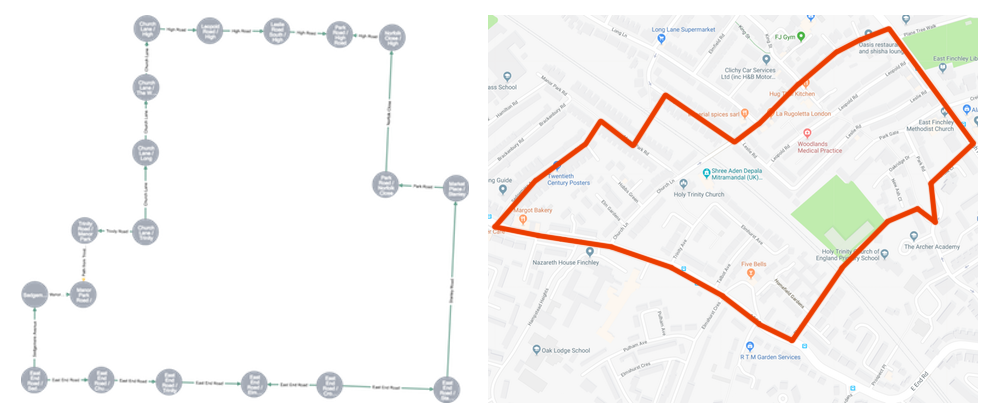
We can also see all of the streets and paths which we didn’t walk on at all during the recorded period:
MATCH path = (:Intersection)-[r:PATH|STREET {newness: 0}]->(:Intersection)
RETURN path
As you can see our walk coverage is pretty good to the North and West, but to the South and in particular the East we left a lot of our territory unpatrolled! Armstrong decided he wanted to head deep into the unpatrolled territory to the East, so we chose an intersection to aim for – the intersection of Tetherdown and Fortis Green (in our graph this node has an
"xid" property value of 124).We want to try to find a route to that intersection that will use the street and path relationships with the lowest
"newness". For this, we decided to use one of the Neo4j Graph Algorithms: shortest path, which will find a route to Tetherdown that has the lowest weight (or the minimum total "newness"). We started at an intersection near our home, which has an "xid" property value of 75. Here is what the algorithm output gave us:
MATCH (start:Intersection {xid: 75}), (end:Intersection {xid: 124})
CALL algo.shortestPath.stream(start, end, 'newness')
YIELD nodeId
RETURN algo.getNodeById(nodeId)
Not a bad path! It does take in lots of street and path sections we haven’t patrolled in some time. Plus it’s a bit of a circuitous route, rather than a straight line, which Armstrong appreciates in a walk.
Using this recommended route I added a new label –
"Planned" – to the Intersection nodes between the start and end points, which will help us plan our route back from Tetherdown. We’re going to avoid the intersections from the output of our last algorithm query, so that we can take a completely different route back. I also added a new
"Unplanned" label to all the other nodes, which weren’t in the algorithm query output. I then needed to add this label to the start and end nodes from our route out (the Intersections with xid 75 and xid 124), so we can include them when we generate our return route. Now all that’s required is to call the algorithm again, reversing the start and end nodes and using only
"Unplanned" Intersection nodes:
MATCH (start:Intersection {xid: 124}), (end:Intersection {xid: 75})
CALL algo.shortestPath.stream(start, end, 'newness', {nodeQuery: 'Unplanned'})
YIELD nodeId
RETURN algo.getNodeById(nodeId)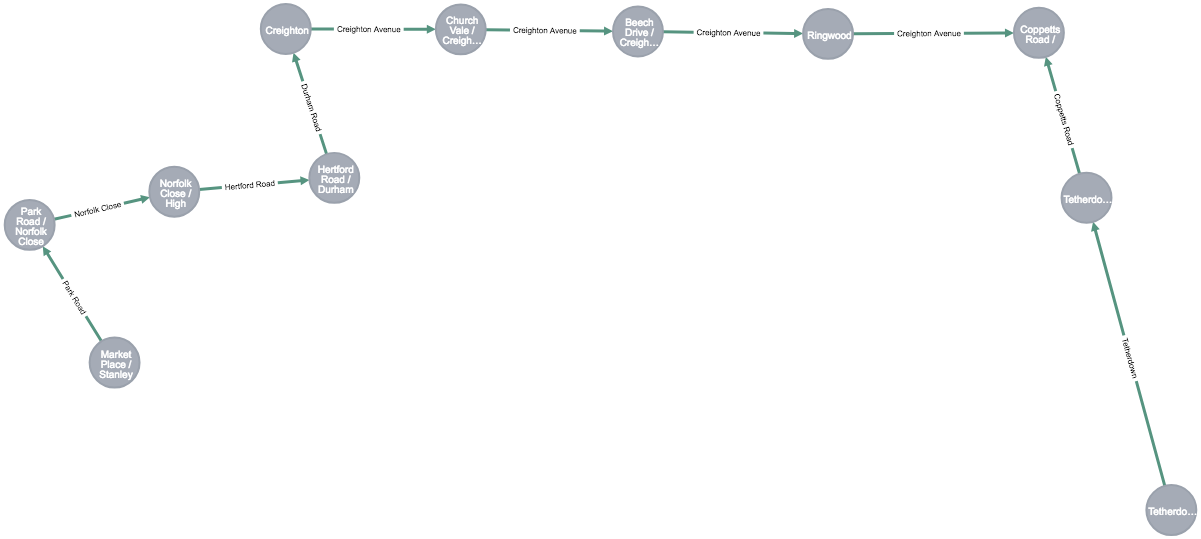
Armstrong approves! Our combined route covers a lot of ground – plenty of streets and paths we haven’t patrolled in quite some time, stretching from pretty far south all the way up to the northeastern tip of our territory. As an added bonus, it follows the border of our territory for a while as well. An excellent walking route indeed!
Of course, we could do this twice every day for all of our walks – always recording our walking routes, updating the dates and newness values for each route segment, and planning an optimal route each time using the graph and the shortest path algorithm. Armstrong is going to need to brush up on his Cypher, though!

Sometimes you want to know the shortest path between two points, and you want to measure the length of that path as the number of hops (or relationships). Other times, some other measurement is required – that could be cost, distance or (as in this example) some form of time.
Armstrong and I hope this has given you some more insight into how graphs can be used for pathfinding in the real world. If you have any other ideas or examples for how this kind of pathfinding can be applied, let me know. In the meantime, happy walking!
Ready to take your graph pathfinding to the next level? Click below to get your free copy of the O’Reilly Graph Algorithms book and discover how to develop more intelligent solutions.
Download My Free Copy
Download My Free Copy


