


Shortly after I got introduced to Neo4j, I found that when looking at existing dataset examples I often felt the need to look at and better understand the underlying schema of the data. Although a Neo4j database does not need a schema, most of the time data will adhere to a schema and without one, creating elegant and efficient queries to gain insight into your database becomes rather difficult.
I spoke with other Neo4j users, and they told me that they had come across the same problem. In larger projects, there should be a separate documentation about the database schema, but as it is the case very often with documentation, either it doesn’t exist or it is out of sync with reality.
Getting the Schema
You don’t need an up-to-date documentation to take a look at the schema. There are existing solutions that can help you here:
The built-in Neo4j Browser will show you a list of all node labels, all relationship types and property keys currently in use in the sidebar. Clicking on each of them, the Neo4j Browser will sample a few random nodes and relationships and render them to the screen. You can then interactively explore the actual graph data and build the schema in your head or using pen and paper.
If you have installed the APOC tools at your server, you can make use of the awesome meta graph APOC procedure to automate this sampling: The procedure will create results that the Neo4j Browser can actually display as a graph.
Some people may not have the APOC tools installed or cannot install them at their server. Luckily, starting with Neo4j 3.1, there is similar functionality built right into the database. Sending a
call db.schema() query to the database, you will get a response that looks like an ordinary query result with nodes and relationships; however, the entities are purely virtual and do not exist in the database.For very small instances with a simple schema, this may already be enough for you to get a good understanding of the structure of your database. However, while the current implementation of the graph viewer in the Neo4j Browser is fine for displaying smaller result sets, it does not work very well for non-trivial schemata.
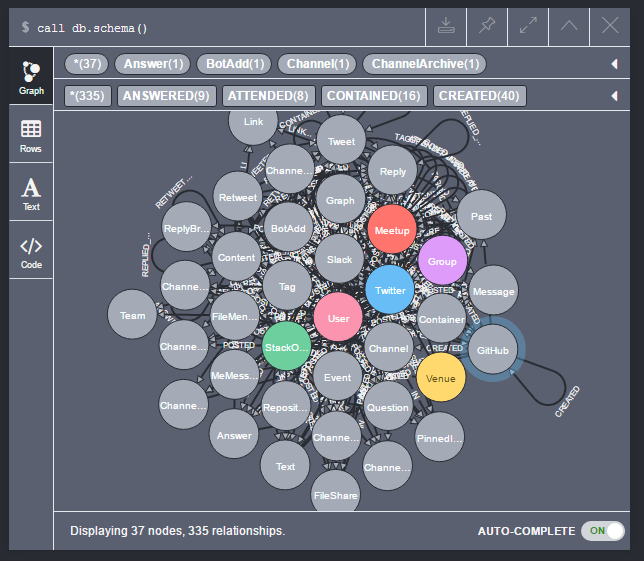
In the above screenshot, you can see the results of calling
db.schema() on a Neo4j instance that contains data about social activities of the Neo4j community. Relationships between Twitter, Stack Overflow, Meetup, and Slack users – along with their public activity – and interactions has been collected in this database.However, in the screenshot you can’t actually see a lot more than what you can see from the list of existing node labels, except for maybe the confusing fact that a
GitHub labeled node created a GitHub labeled node. Also, many of the node labels have been cropped, and almost all of the relationship labels cannot be seen in the diagram.Digging Deeper
If you start looking more closely at the output of the
db.schema() call, you will see that there are some node labels that seem to be connected to a large number of other labels. In the example above there are labels like StackOverflow, GitHub, Twitter, Meetup, and User which have a very high connectivity.It is their adjacent relationships that make the diagram almost unusable. Now if you look at the database contents you will quickly see that in reality there is not a single node in the database that is labeled with just one of these labels:
MATCH (n:StackOverflow) WITH labels(n) as labels WHERE length(labels) = 1
RETURN collect(distinct(labels))
This will give you an empty list, since there is no combination of labels in the whole database that only consists of the “StackOverflow” label! Instead, the label is used as a “tag” in combination with other labels only.
This Cypher query can be used to find the combinations in use for a certain label in the database:
MATCH (n:StackOverflow) WITH labels(n) as labels RETURN
collect(distinct(labels))
With this knowledge, in order to better understand the schema, we can actually manually remove those “tagging” nodes from the graph display. We won’t lose any relevant schema information since the relationships are still there for the other labels that the tagging label was used in combination with.
Be careful though, because there can be labels that cannot be removed without destroying information. In this case the
User tag appeared in these combinations:[User, Twitter], [User, StackOverflow], [User, Meetup], [User, GitHub], [User, Slack]
And if we remove the
User label too, we will remove all Users and their interactions and relationships from the schema.Actually, the schema should better show a different structure: It now shows a type of “User” who posts questions on Stack Overflow, tweets about his or her work on Twitter, and meets his or her fellow developers at Meetups. We see a single
User that participates in all of these relationships. However, if we look at the actual data, we will see that only Twitter Users tweet, and only Stack Overflow Users post questions and answers on Stack Overflow.Thus, in reality, in the database the schema should be drawn with separate types of
Users. One for each “tagging” label combination that they appear in.At this point, it becomes clear that the current implementation of the graph visualization in the Neo4j Browser does not suffice for rendering more complex database schemata.
Graph Visualization to the Rescue!
As a programmer, I quickly became annoyed by manually entering the above Cypher queries into the Neo4j Browser. Immediately after I found out about the great JavaScript Bolt driver for Neo4j, I decided to use yFiles for HTML to build my own schema viewer that will perform all of the above manual tasks automatically.
“yFiles” is a generic graph visualization, drawing and editing library for programmers that comes with the most complete suite of automatic layout algorithms. It also features extensive customization options, and as such, can be used to create completely new applications that exactly suit one’s requirements. Therefore, I was positive that I could easily build an application that allows users to quickly and efficiently browse and understand the schemata of even the most complex Neo4j graph databases.
I started with the same simple approach that is used in the Neo4j Browser. The Bolt driver returns easily consumable JavaScript objects that can quickly be turned into a graph that can be visualized with the yFiles library:
session
    .run("call db.schema()", {})
    .then(function(result){
      const records = result.records;

      const graphBuilder = new yfiles.binding.GraphBuilder(graphComponent.graph);
      graphBuilder.nodesSource = records[0];
      graphBuilder.edgesSource = records[1];

      // helper method to convert the neo4j "long" ids, to a simple JavaScript object (string)
      function getId(identity) {
        return identity.low.toString() + ":" + identity.high.toString();
      }

      graphBuilder.nodeIdBinding = node => getId(node.identity);
      graphBuilder.sourceNodeBinding = edge => getId(edge.start);
      graphBuilder.targetNodeBinding = edge => getId(edge.end);
      graphBuilder.nodeLabelBinding = node => node.labels && node.labels.length > 0 ? node.labels[0] : null;

      graphBuilder.buildGraph();

      session.close();
    })
    .catch(function(error) {
      console.log(error);
    });
That was all I had to do to get the basic schema to display in my own application! I just plugged the above code into one of the samples in the getting started tutorials for yFiles for HTML and was immediately able to interactively explore and finally understand my database schema!
Creating a Schema Explorer
Of course, I didn’t stop at this point. I was excited to see what one can create when the power of Neo4j and the yFiles libraries is used together in the same application. So I added an option in the context menu for the user to automatically split node labels into all of their label combinations and update the relationships accordingly.
A Cypher query like the following quickly reveals that for certain label combinations there are a lot fewer relationships, and they suddenly begin to make sense:
MATCH (n:User:StackOverflow)-[r]->(n2) RETURN collect(distinct(type(r))),
labels(n2)

collect(distinct(type(r)))    labels(n2)
[POSTED]                      [Content, Question, StackOverflow]
[POSTED]                      [Content, Answer, StackOverflow]
So Stack Overflow users in the database do not participate in a meetup and do not create GitHub repositories; they will post answers and questions and the schema should reflect that!
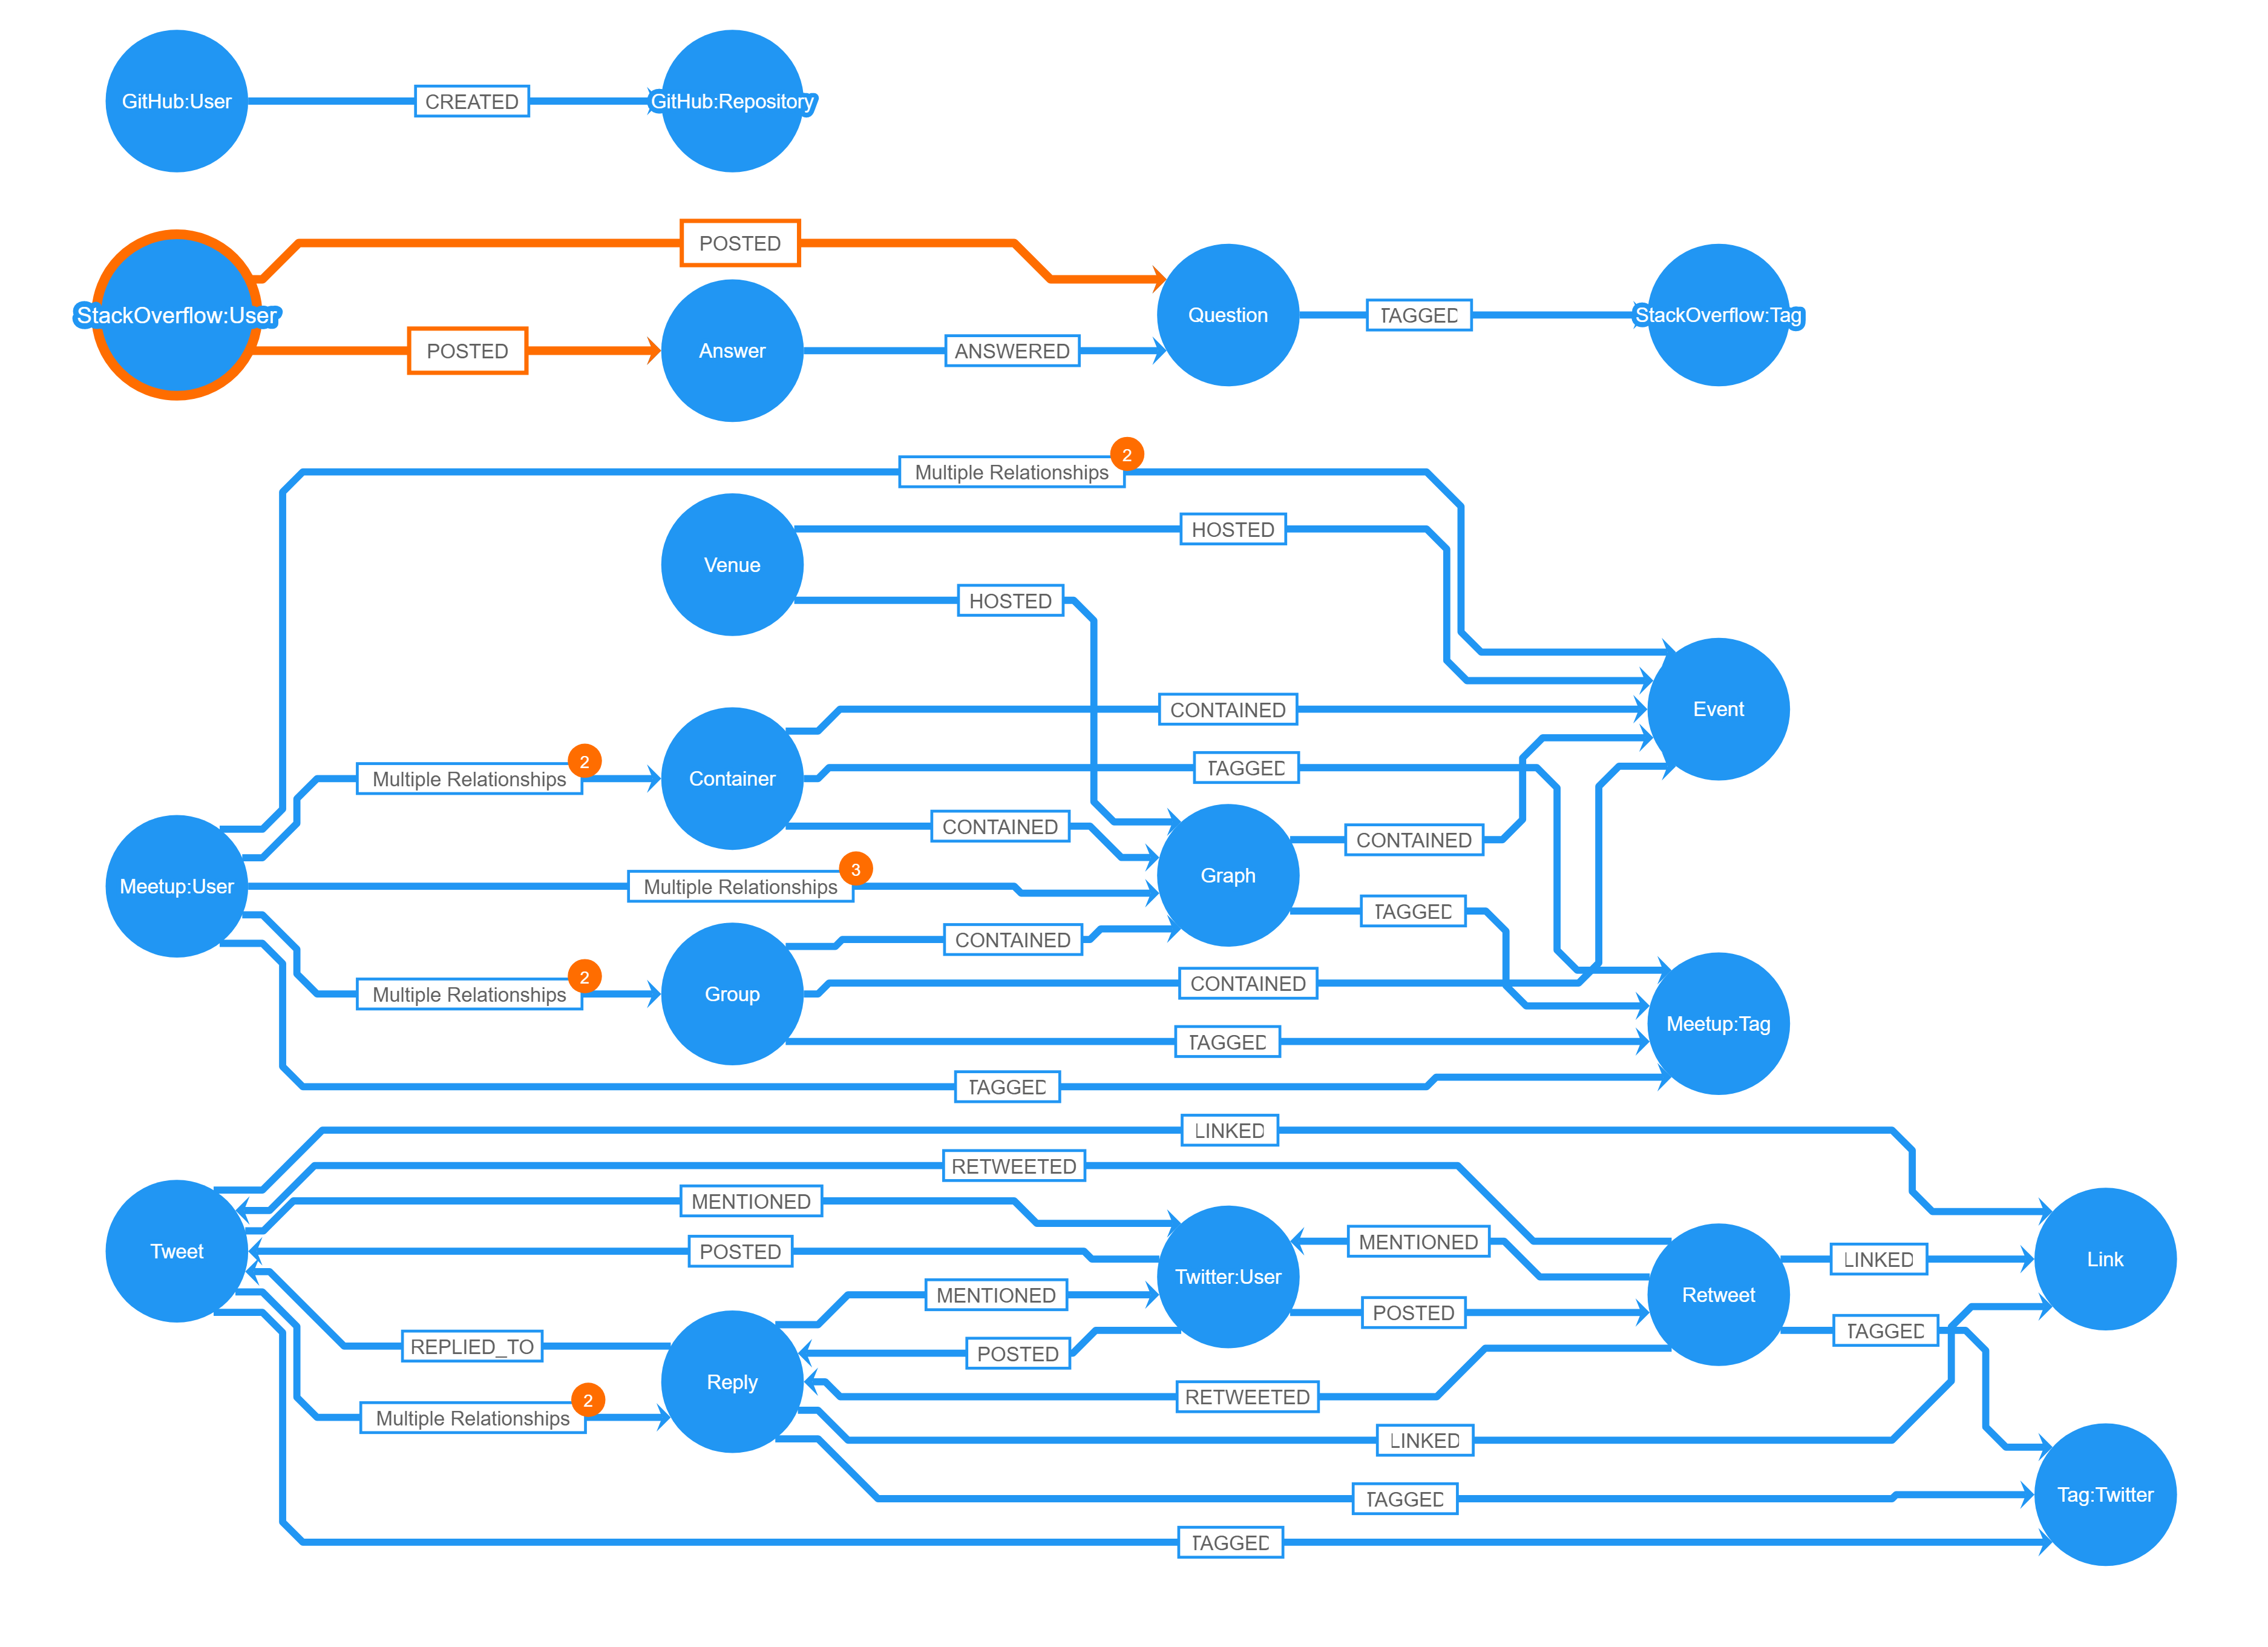
So after reading in the schema, splitting the node labels, reinserting the right relationships, and removing the tagging labels from the schema view, I finally applied some custom styling and one of the automatic layout algorithms and got this much-improved schema:
More Features!
Now that I finally understood the structure of the database, I was eager to dig into the actual data. I already had the code that enabled me to run a Cypher query and import data for the purpose of graph visualization into yFiles, and with the help of my cleaned up schema, I wanted to interactively explore the data that I was interested in.
To cut a slightly longer story short, I asked our development team to help me build an improved version of the Neo4j visual graph explorer based on yFiles, and three weeks later they came up with this:
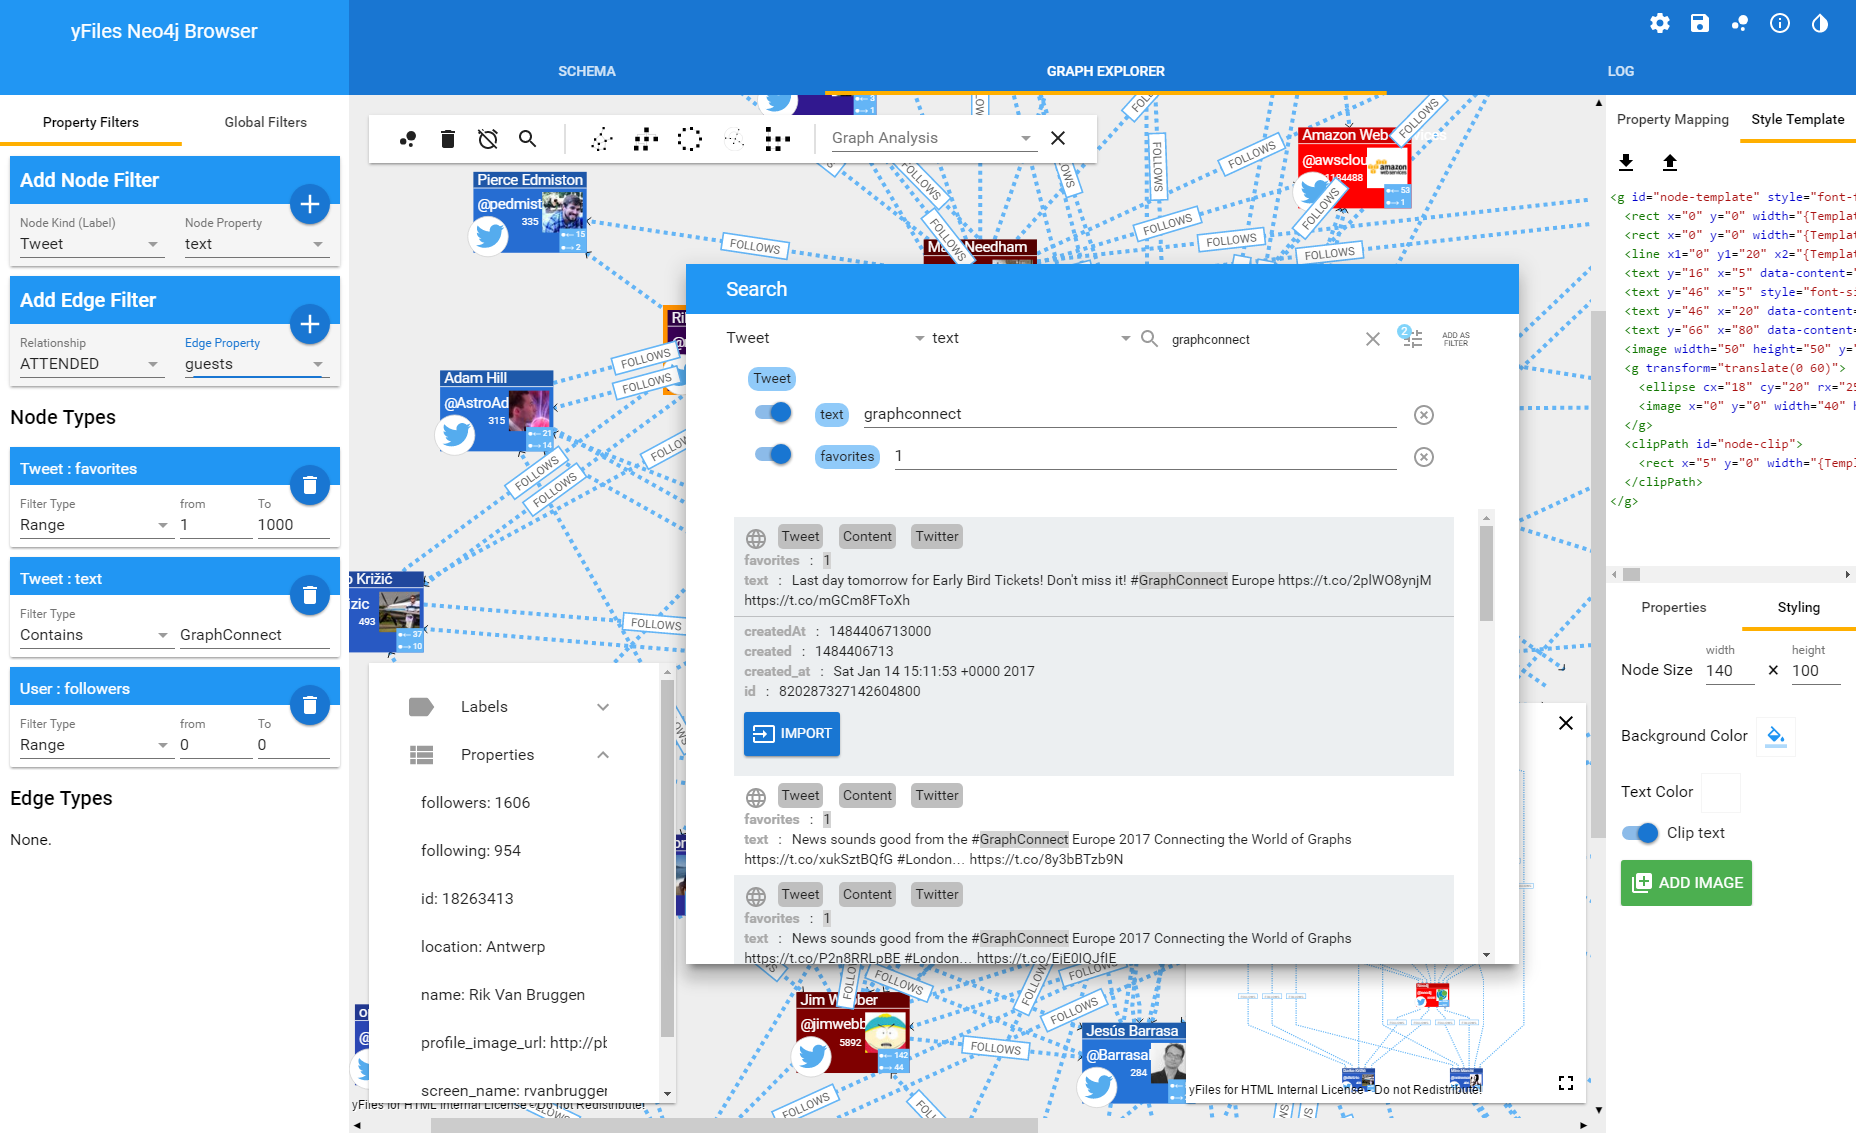
The small demo application had turned into an awesome web application that may be used to connect to any accessible Neo4j database using the Bolt protocol. In order to better explore the dataset we included the following features:
- We added the ability to quickly specify filters for nodes and relationships, so that during the exploration, only those nodes were considered that you are interested in. This can be done via property filters or directly in the schema view where relationship types and node labels can be “disabled”.
- To actually see something, we added a master detail view so that all of the properties of the currently selected item can be seen and we added the ability for the user to interactively create and modify SVG templates for different node labels that use data binding and property mapping to dynamically create pleasant visualizations for the nodes in the graph.
- A set of preconfigured different automatic layouts and graph analysis algorithms was just as easy to add as a dynamic neighborhood view, as well as PDF creation and image export and the option to export to GraphML for loading the graph into our free diagram editor yEd.
- To start exploring the database, we added a convenient search dialog with preview functionality from which the user can import one or more nodes into the visualization.
- My favorite feature is the ability to use the schema to interactively specify transitive relationships over multiple relationship hops: The explorer will then enable the exploration of “virtual” relationships that don’t explicitly exist in the database.
- And for the pro-users we also added the option to directly specify Cypher queries. With the right query you can even visualize virtual nodes and relationships!

If you want to see this tool in action, come visit the yWorks booth at GraphConnect Europe happening in London. I will also present the tool in my lightning talk, “Understanding and Visualizing Complex Neo4j Instances.”
And if you want to develop a similar application, you can evaluate yFiles for HTML today and use Cypher, the JavaScript Bolt driver, your Neo4j database, and the code samples from this post to get started!
Happy diagramming!
yWorks is a Silver sponsor of GraphConnect Europe. Use discount code YWORKS30 to get 30% off your tickets and trainings.
Register for Europe’s premier graph technology event: Get your ticket to GraphConnect Europe and we’ll see you on 11th May 2017 at the QEII Centre in downtown London!
Get My Ticket
Get My Ticket


