


Presentation Summary
In an everlasting race to achieve technological advancement, many companies are looking at artificial intelligence (AI) and machine learning (ML) as the next big step toward a more autonomous future.
In this post, Neo4j’s analytics and program manager Amy Hodler discusses how current research indicates that graph technology is more impactful in the ML and AI fields than other individuals approaches. She walks through steps on getting started with a graph ML model and moving forward in graph data science to enhance your artificial intelligence and machine learning tools.
Such steps include:
- Query-based knowledge graphs
- Query-based feature engineering
- Graph algorithm feature engineering
- Graph embeddings
- Graph neural networks and native learning
Hodler also offers some background information on graph data science applications, graph feature categories and algorithms, and resources for users and potential customers.
Full Presentation: How Graphs Enhance Artificial Intelligence
My name is Amy Holder, and I’m going to discuss how graphs enhance artificial intelligence. Currently, many popular trends revolve around AI, machine learning and graphs, all of which work together naturally.
Background Story
I’ll start off with a fun story of how graph databases and AI interested me in the first place. I was actually first interested in network science, and as we know, networks – or mathematical representations – use graphs.
This was around the time of the 2008 Financial Crisis, which involved financial contagion and how things spread through a network. The cartoon below shows an (albeit dramaticized) example of this.

At this point in time, our views of how news spread in financial situations were very global. A lot of network science research examined the density of the banking system as well as various trading systems. As shown in the cartoon, news spread but also amplified. This phenomenon really interested me, so I started looking at it a little closer.
Predicting Financial Contagion: From Global to Local
You’ve probably noticed we’re a little more local than what we used to be. Events happen faster and connections are both small and complicated. In 2008, we performed network science over big markets and events to analyze how they spread. Now, we’re witnessing how a single Tweet has the potential to impact global markets.
Our customers at Neo4j are also thinking more locally. They want to understand contagion within potential investments in order to predict if something’s worth investing in.
The truck manufacturing industry represents an example of this mindset, where manufacturers often find themselves predicting financial contagion. What happens if a truck manufacturer can’t pay component suppliers for a couple of months? What’s the potential spread for a shipping company that relies on the truck manufacturing corporation for specialized equipment?

Here, there’s much potential for rippling, so it’s not surprising that we work with institutions who look at contagion in a graph, specifically at how it’s connected in ways you wouldn’t think of by just looking at regular supply chain logistics.
The next step customers want to take is learning about their paths. They want to use machine learning to comprehend how things travel. They’re looking to develop meta-paths, learn on those paths and make more stable investments.
Although this is a specific investment scenario, we’re ultimately aiming to strengthen our financial systems and make them more robust.
Graph Data Science Applications
As discussed above, financial systems are very connected. But on a broader scale, we also see graph analytics and graph data science applying to many fields in which there’s an abundance of data and intricate connections.
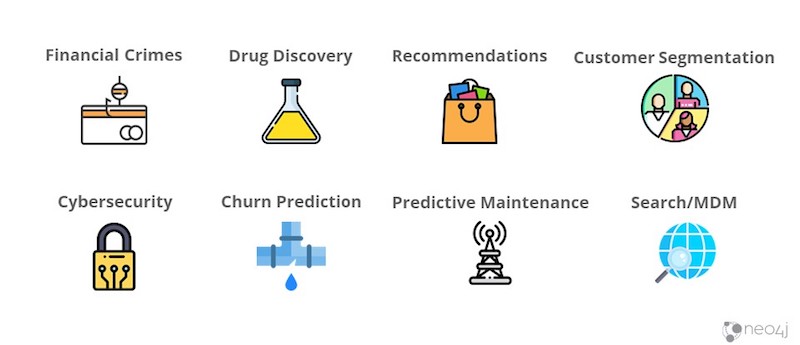
Some of the more prominent fields with graph data science applications are pictured in the image above. I’ll also briefly go over them here:
- Financial crimes, which include areas from fraud to money laundering, is generally detected by looking at group behavior. Anomalous behavior might indicate something nefarious.
- Drug discovery is very graphy, since drugs target patients’ profiles, have symptoms and produce various outcomes. Helping medical professionals further comprehend the linkages in drugs allows them to repurpose them and create more personalized medicine.
- Recommendations with graph databases deviate from the standard procedure of looking at similarities between customers and recommending products based on that. Instead, we look at paths customers take when buying a product, develop a pattern based on it and learn from it. Then, when another customer is halfway through that path, we recommend where they may want to go.
- Customer segmentation involves marketing to groups of individuals and understanding the communities our customers belong to as well as the interactions they have.
- Cybersecurity also looks at anomalies. For example, an irregular intrusion alert pattern might indicate a problem.
- Churn prediction looks at whether a customer’s about to churn, as well as their influence in a network after they churn.
- Predictive maintenance runs along the same vein. For example, scheduling maintenance for your truck depends on various factors, like the weight and age of the vehicle. These contextual items contribute to understanding the item and predicting possible maintenance requirements.
- Search and master management data (MDM) are popular graphs that first started with Google and PageRank, which provides a credible page to users.
Current Research on Graphs in AI
We’re not the only ones thinking about the potential of graphs in artificial intelligence – ZDNet recently published an article on machine learning that rocked the AI world.

Basically, ZDNet’s coverage revealed that people from Google DeepMind, the Massachusetts Institute of Technology (MIT) and other organizations are looking at where we are with machine learning today and potential next steps in the field.
A big statement in the article (that I obviously love) is the realization that graph networks are bigger than any other individual ML approach, specifically due to graphs’ ability to abstract and generalize structure. Anybody who’s gone to a whiteboard and graphed something out understands how this is something other neural nets just can’t accomplish.
Another point of uncertainty detailed in the article was concerned with where these network graphs themselves would come. However, for us at Neo4j – a company that’s been in this space for a long time – this is an exciting marriage between innovative ideas and the gaps we might be able to fill with our technology.
Getting Started with a Graph Machine Learning Model
We have a lot of customers who are really excited about this but aren’t sure how to start building their graph ML and data science model.
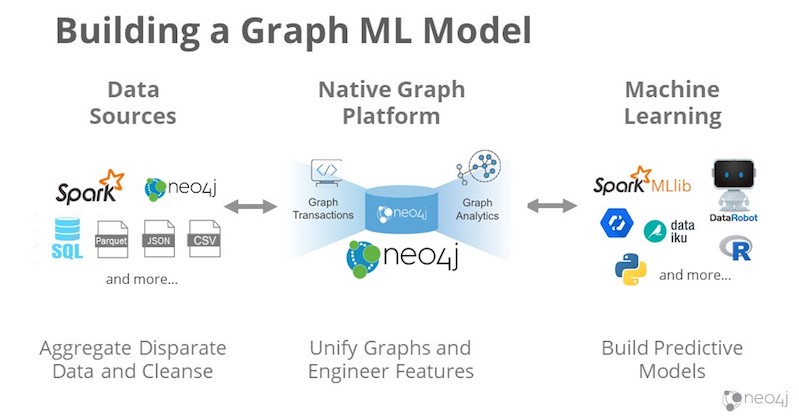
Before taking your first steps, you’ll need your data sources, your native graph platform if you’re building a graph ML model and some kind of machine learning. These elements combine to create the workflow that’s shown in the image above.
I’ll first show you an example of what this might look like with Apache Spark, especially since so many of you already have quite a bit of data flowing through Spark.

You might have heard of Spark Graph, a new project that’s coming out this fall that’s been in the works with Databricks for a while now. What it’ll do is bring Cypher to Spark so you can create your labeled property graphs – including types and queries – and explore your data.
A graph in Spark is not persistent, which means that if you want to persist it, you’ll need to transfer it to a native graph platform, where you’re able to explore and perform transformations. You can also utilize Morpheus, an open-source project that’s available today. We’re also upgrading Morpheus to allow users to execute more transformations and then integrate it with Neo4j.
With these tools, you’re able to take massively-scaled data sources, explore them and determine if you have graphs to build an application on. Then you’re able to bring it over to Neo4j, perform your native graph processing and algorithms, persist it and implement ML aspects as well.
The general idea here is that if you have Spark – which many of you do – use it; it’s great and very scalable for lots of data. It also has many pipelines and an extremely powerful machine learning library.

But, because Spark’s not native and doesn’t persist, bring it over to Neo4j for more serious graph analytics that can support potential applications. We’ll help you build your graph solution, persist your graph and make changes in your graphs with dynamic graphs.
As I mentioned above, Neo4j also has native query and graph algorithms, which allows you to operate the algorithms, perform analytics and improve performance. Moreover, everything’s in a single-memory space that lets you to work with your entire graph.
This is particularly important from a graph algorithm standpoint, since many aren’t amenable to paralyzation. These algorithms are also unable to chop up the graph and analyze the graph’s different areas. Instead, they want to consider the whole graph – it’s all very global.
Steps Forward in Graph Data Science
Where do we go from here? Though graph data science is a broad realm, so I’ve indicated three major milestones within it:

These three steps actually fold out into more steps, which are shown in a graph in the image below. I’ll be walking you through examples in each of these steps and how they might help you get started.

The x-axis on the bottom represents enterprise delivery, or how long it takes a technology to be ready for an enterprise to adopt. The y-axis is data science complexity, or how difficult a problem is.
We’ll delve into the details of these steps further down in the post, but here’s a quick overview:
- Knowledge graphs are very mature and common. They’re a great starting point if you’re not there yet.
- Query-based feature engineering begins to incorporate some ML into your applications. At this point, you likely want to add some graph features to your ML, but still need a subject matter expert.
- Graph algorithm feature engineering is unsupervised, so we can throw graph algorithms at our data, perform analyses, grab more graphy features and put it into our ML models.
- Graph embeddings are really interesting, especially if we’re talking about learned representations of our graph. It’s a required step that inches us closer to deep learning.
- Graph neural networks and native learning involve keeping both the output and input in a graph and performing native learning.
Query-Based Knowledge Graphs: Connecting the Dots
As stated above, query-based knowledge graphs are already very mature and solid, but people are still using it in cool, inventive ways.
I’ll be discussing a really interesting example, which is actually a project our solutions team is working on. The graphic below is a screenshot of a dashboard from our team.

This is a dashboard based on multiple knowledge graphs from financial solutions company Refinitiv (previously of Thomson Reuters). These knowledge graphs contain multiple layers of financial information. They include regular corporate data that’s accessible to everyone and also stream in external news.
For example, let’s say a news story published yesterday led to a financial market change or an uptick in stock prices. Such dashboards help people correlate these events by allowing them to interact with the data. Users can also customize weighting, thereby making it possible to prioritize relationships that might be more important for their portfolio.
Moreover, different dashboards come with different tools, such as credit risk, investment risk and news recommendations.
Ultimately, though knowledge graphs are well-known, people are constantly adding to their list of applications, which is very fun to see happen.
Query-Based Feature Engineering: Mining Data for Drug Discovery
The next step toward enhancing AI is using query-based feature engineering. Here, you’ll still need a subject matter expert, who knows what’s predictive in their network but just can’t get to it, especially since pulling information out of a large data set is very troublesome.
The following image is an example is from het.io, a network of biomedical knowledge that utilizes Neo4j as a backend.

Het.io contains 40 years of biomedical information, including genes, diseases, compounds and side effects. It also looks at outcomes and pathways that patients have taken. Naturally, it’s a very graphy problem.
Side note: het.io exposes their data and their Neo4j browser, so those already familiar with Cypher can go to their website and play around. It’s fun to perform queries, look at the data and potentially discover something new.
One of the goals het.io is pushing toward is determine the predictability of the links between genes and diseases. They’re looking at the topology of networks to understand where there might be relationships that we haven’t seen yet.
The image below looks at the correlation between the IRF1 gene and multiple sclerosis (MS), an autoimmune disease. Although there isn’t a direct link, the graph helps us comprehend the secondary and tertiary paths between the two.

After playing with this graph, we developed some features to do some machine learning on and ultimately produced probabilities. In this case, the probability revealed that IRF1 does actually link to multiple sclerosis. It’s a really interesting way to infer relationships we haven’t even seen yet.
Through these predictions, we then know that any drug targeted towards IRF1 is potentially also a good target for MS. What that means is if the drug is already out on the market, it’s gone through many trials. Therefore, professionals can easily repurpose it for another use and deliver a new treatment to patients faster.
If you’re interested in getting started with knowledge graphs and ML, you can use Spark Graph to merge your distributed data, reshape it, transform it into a graph, explore it with Cypher and run graph algorithms.

Then, once you’ve decided that you want to use it, you can bring that part of your knowledge graph over to Neo4j to persist it. From there, your experts can build additional features for your machine learning pipeline.
Graph Algorithm Feature Engineering
Feature engineering using graph algorithms is probably where we spend most of our time right now, because a lot of customers have already taken those two initial steps.
Think about feature engineering – or developing those graph-connected features – as a means for you to put forth new, meaningful and predictive information with data you already have.
Examples of what you might want to look at include relationships, communities and how things are clustered. From there, you can extract this information to a form that a machine learning model is able to handle, which would look similar to the table listed below and contain identifiers and scores. You’re then able take your scores, performing machine learning and perform predictions accordingly.

This example is actually from
Graph Feature Categories & Algorithms
In addition to extracting and engineering features, we also have a lot of graph algorithms.
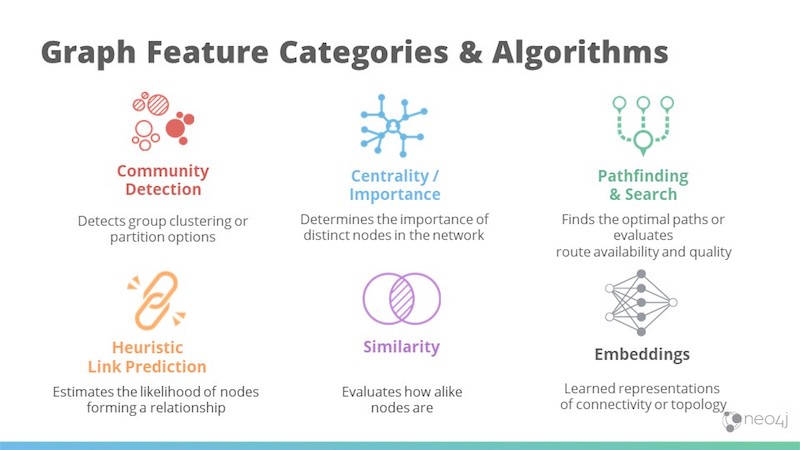
The image above includes those we most often see commercially, but many more exist in the academic world as well.
- Community detection finds communities, looks at how tightly things are clustered and determines optimal areas to partition.
- Centrality is all about influence, with PageRank being the most famous centrality graph algorithm. It also looks at other types of influence as well, like how fast a node reaches other nodes.
- Pathfinding, which is all about optimal routes, is the foundation of all graph algorithm categories.
- Link prediction is a heuristic that estimates how likely things will connect in the future by looking at the topology and dictating how close two items are.
- Similarity, or how similar two items are, is a simple measure that’s very predictive.
- Graph embeddings refer to learning representations of our graph, including connectivity and overall topology.
Graph-Connected Feature Engineering: Detecting Fraud
An example of connected feature engineering in financial crimes is detecting fraud. Most large companies already have some sort of model, heuristic or pipeline that detects fraud.
But this problem very complicated. The economic model I talked about earlier involves a lot of private information, all of which is stored in financial institutions. Such information includes location, demographics, frequency of ATM usage and much more.

Graphs detect fraud with accuracy and precision by adding in features like connected components, which simply look at the connectivity between people in a specified area. A disjointed area in your graph that contains a lot of activity might indicate potential first-party fraud.
Moreover, PageRank – though generally about influence – also looks at transaction volume, since it determines the direction of relationships. Thus, we can utilize it to see what seems anomalous and what also seems highly impactful.
Another graph community detection algorithm is Louvain modularity, which allows you to dial how tightly you want to look at a community. For example, if you don’t want too many false positives, you can dial it down a little, thereby letting some minor issues go through and focusing on bigger ones. It also lets you find subcommunities, which are particularly useful when looking at hierarchy in your data and in potential fraud ranks.
Something you can run very quickly is Jaccard similarity, which is a simple measure of the similarity of two items based on common attributes. For example, if you already have the profile of a fraudster, it allows you to quickly run through your network and determine how many nodes match this profile with an 80 percent overlap.
Graph solutions in fraud are already widespread. Over the last 10 years, there has been almost 50,000 U.S. patents around graph fraud and anomaly detection. It’s a very active space for good reason, since it’s an extremely difficult problem.
Getting Started with Graph Feature Engineering
If you’re interested in getting started with feature engineering, you’ll need to start with your data source, move it to Neo4j to persist your graph and run algorithms, and then write back to the graph.
There are a lot of graph algorithms in Neo4j; we currently have over 35 in an ongoing list. The bolded algorithms in the image below are also in Spark GraphFrames.

You can see that there’s a difference in how many graph algorithms we have in each category. A part of that reflects our passion for the space and making tools as accessible as possible. Certain algorithms are also naturally easier for us to optimize and perform.
Graph Embeddings
Let’s step forward to the next level: graph embeddings, the toe in the water of deep learning. Graph embeddings transform a graph into a feature vector, or a collection of features, that describes the topology, connectivity and attributes of nodes and edges in a graph. Usually, vectors include some form of dimensionality and contain x-, y- and z-coordinates as well.
There are three main types of graph embeddings:
- Vertex/node embeddings describe the connectivity of each node.
- Path embeddings describe the traversals, or paths, across the graph.
- Graph embeddings encode the entire graph into a single vector.

First, they look at the graph and sample random walks. Then, they train that model using gradient descent. Last, they compute the embeddings.
This is just one approach, but it shows there’s a nice process from graph to embedding.
Graph Embeddings: Recommendations with eBay
Graph embeddings are really important for recommendations. I’ll present a cool example from eBay, who published a clever paper about reasoning over knowledge graphs for recommendations.
In this example, a user named Alice likes the song “Shape of You” by Ed Sheeran, and we’d like to recommend another song to her.

A lot of recommendations done today use collaborative filtering. They say, “well, Alice is somewhat like Mary, who likes ‘Shape of You’ as well. Mary also liked something else, so we’re going to recommend that to Alice.” It’s all based on the Alice node.
But what eBay’s doing here is looking at the song itself, which contains a whole knowledge graph of its own. Its graph contains the people who wrote, sang and produced it, as well as the song’s genre and language. We’d like to estimate what path someone might go through to get to another song.
Across from Alice in the image, we have songs that she may be interested in. We want to understand what those paths are and which one she’d likely be more interested in.
So, what eBay did was look at an embedding layer, which is shown below. The blue items are the nodes and the pink items are relationships.
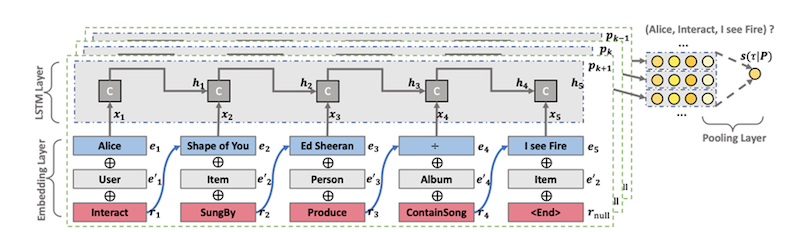
First, they walk through six hops out, going through each of the potential paths. Then, they utilize an LSTM layer to embed, learn and come up with probabilities for the paths for each song.
Graph Neural Networks: Native Learning
In the foreseeable future, we see graph data analytics and data science going in the direction of graph neural networks.
In summarization, graph neural networks refer to deep learning, which involves training multi-layer neural networks using gradient descent with the goal of optimizing your function. Here, your input and output aren’t the same, though they sort of look that way in the visual below. You also have these hidden middle layers:

Graph native learning alludes to deep learning models that input a graph, perform computations and return a graph. It allows us to do various things in new ways. First, identical graph inputs and outputs give us visibility of how things change in intermediate steps, which are also graphs, as shown in the visual below.

If I’m making a change in my predictions, I can now do some validation and have visibility into how that happens at each step. This connects to AI explainability – that we don’t want AI and deep learning to be hidden in a black blox. If there’s a decision made, we want to be able to know how and why it was made, and this is the first step in getting us there.
Native learning is also easier for data scientists to work with. Going to a white board, drawing a graph and then computing it with your output as a number isn’t quite the same as outputting a graph and comparing your input and your output to understand how that flows.
It’s really exciting to think about what we’re trying to predict with native learning. We’re talking about predicting single items and paths. For example, let’s look at the path from this song to another. It might seem simple, but in the real world, things are all interrelated, and there’s a lot going on at the same time.
For instance, while I’m looking at this music, I might also have recently happened to get married and my flower shop also went out of business. With all these events occurring at the same time, native learning potentially has the ability to look at multidimensional learning together by updating the graphs and predicting multiple things.
Though this is just research right now, it’s somewhere we think the machine learning and AI market is headed toward. An example of such research lies in the chemistry field.
In the example below, chemists are trying to predict potential new molecules formed by combining different components and analyzing what comes out of it.

Basically, these chemists take a molecule and remap it to a graph. This is especially fitting because molecules – which contain nodes and relationships – are very graphic. Then, they use these graphs to perform machine learning.
Though they’re most essential task involves adding reactants and reagents to each other and predicting new compounds, chemists are also analyzing electron paths with graph native learning.
Resources
With these steps, I hope you now further understand that graph data analytics and graph data science are progressing forward. I’m very excited about this time frame in our history – the time has come to actually bring graph and ML together and watch it flower into new potential.
There’s a lot of steps you can take now, and we want to help you build your foundation and move forward. For readers on the business side, we have a web page with use cases and solutions, as well as a white paper on graph technology and AI.
For our data scientists, we have our Sandbox, which provides an interactive experience for trying out Neo4j. Our sandboxes already contain data, so you don’t have to load any yourself. We also have developer guides within the sandbox as well as our Neo4j community, a global forum for online discussion on how graphs are everywhere.
Lastly, we recently partnered with O’Reilly Media to publish a book called Graph Algorithms: Practical Examples in Apache Spark and Neo4j. The ebook is free and available for download.
Ready to learn more about graph-enhanced AI and analytics? Click below to get your free copy of the O’Reilly Graph Algorithms book and discover how to develop more intelligent solutions.
Download My Free Copy
Download My Free Copy


