I work for the International Consortium of Investigative Journalists (ICIJ) and even though I’m a journalist I work with developers, and we use tech like Neo4j to tell great stories.
About the ICIJ
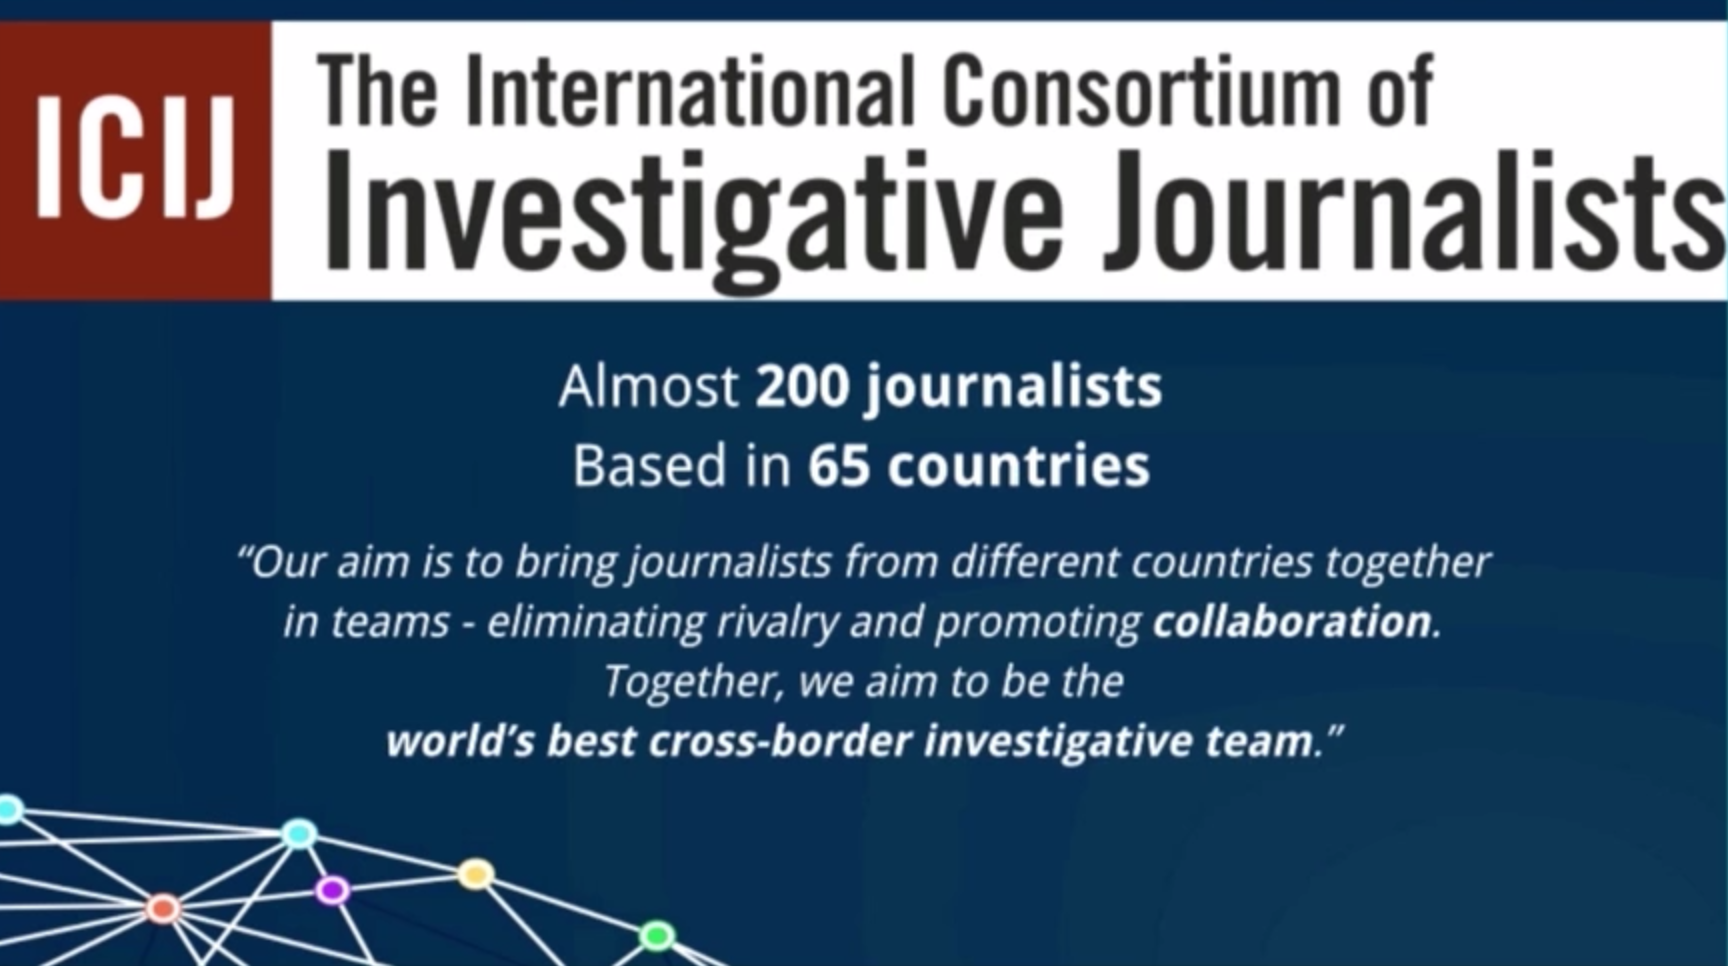
In case you don’t know about the ICIJ, we are a network of around 200 journalists in more than 65 countries that work together to do cross-border investigations and issues of global concern that speak about systemic problems that are happening in society.
You might remember us from our 2013 investigation, Offshore Leaks, an investigation into data from tax havens based on only 260 GB. Later, in January 2014, the spinoff of that investigation, China Leaks, looking at more than 37,000 names connected to China, Taiwan and Hong Kong.
Afterwards that same year, in November 2014 we received a different leak on secret tax agreements between big corporations and the government of Luxembourg to cut on taxes. Finally, around a year ago we worked on this investigation called Swiss Leaks which is based on a leak of stolen data from HSBC in Switzerland and the information of more than 100,000 clients and around $100 billion of Swiss bank accounts.
All those were leak-based investigations. We’ve also done investigations based on public data, but I’m going to cover how we work with leaks and graph databases. You’ve most likely heard about the Panama Papers:
https://www.youtube.com/watch?v=o57kGRH29GE
My colleagues at Sueddeutsche Zeitung, a newspaper in Germany, received these messages a while ago from John Doe, an anonymous source that told them that he had access to the Mossack Fonseca data.
Of course, as data journalists we are always looking for data. The next step was to keep the sources anonymous, and after that we had to figure out how to process 2.6 terabytes of information.
The Importance of Sharing Leaked Data
These two colleagues Frederik Obermaier and Bastian Obermayer to me are heroes:

Normally, this is how journalists deal with data:

We get a data leak, and we hold onto it like the One Ring. We don’t share it with anybody because it’s our treasure, our precious. I’m sure that many of you will relate to this because it probably happens in your company too. There’s a certain department that has access to particularly precious data. It’s their treasure, and they don’t want to share it with anybody else.
That’s why these two journalists in Germany are heroes to me because instead of holding onto the Ring, to that 2.6 TB of information, they decided to share it with the ICIJ.
The ICIJ brings reporters to work together, as I said before, from our network of journalists from media organizations, and for the Panama Papers investigation we built the biggest team that has ever worked on an investigation ever in journalism. We built a team of more than 370 journalists in more than 100 media organizations and 76 countries to work together for one year in secret and start looking into those files in secret.
Beyond our team of reporters, I have three developers on my team who built and implemented all of the tools that ICIJ used to mine these 11.5 million files that we got in the Panama Papers leak.
Why Trust Was Essential to the Panama Papers Investigation
This is a photo of me doing trapeze:

One thing I learned doing trapeze is that it’s a leap of faith. There’s a moment where you just have to jump, and of course you have these guides and you know you’re not going to die, but you just have to jump and wait until somebody catches you.
To me, that moment where that person catches you is one of the most amazing moments in life because all of a sudden you feel you have a backup. You feel that somebody else is with you and that you’re working in a team.
Even though I’m going to talk about tech today, the key to everything we did in the Panama Papers investigation was dependent on that leap of faith, that trust that was built among all the reporters in the investigation.
Within journalism circles, I get asked this question a lot: “How did you manage to keep this a secret with journalists for over a year? Journalists are so nosy.”
The answer is that we trusted each other, and we felt we were part of a team. You didn’t want to be the weakest link or the person that made a leak within the leak.
When you’re working in a team and sharing data with so many people for so long, it’s important to leave your ego at the door. On April 3rd of this year, we published the Panama Papers investigation. Nobody knew what this was before we ran the story.
What We Uncovered in the Panama Papers Investigation
We basically exposed how offshore tax havens are used at scale by elites from anywhere in the world. We exposed how billionaires, sports stars (like Lionel Messi) and politicians all use tax havens to hide their money. One of the most surprising things about the investigation was the 140 names of politicians in more than 50 countries that we found in the data and we found them through a collaborative effort.
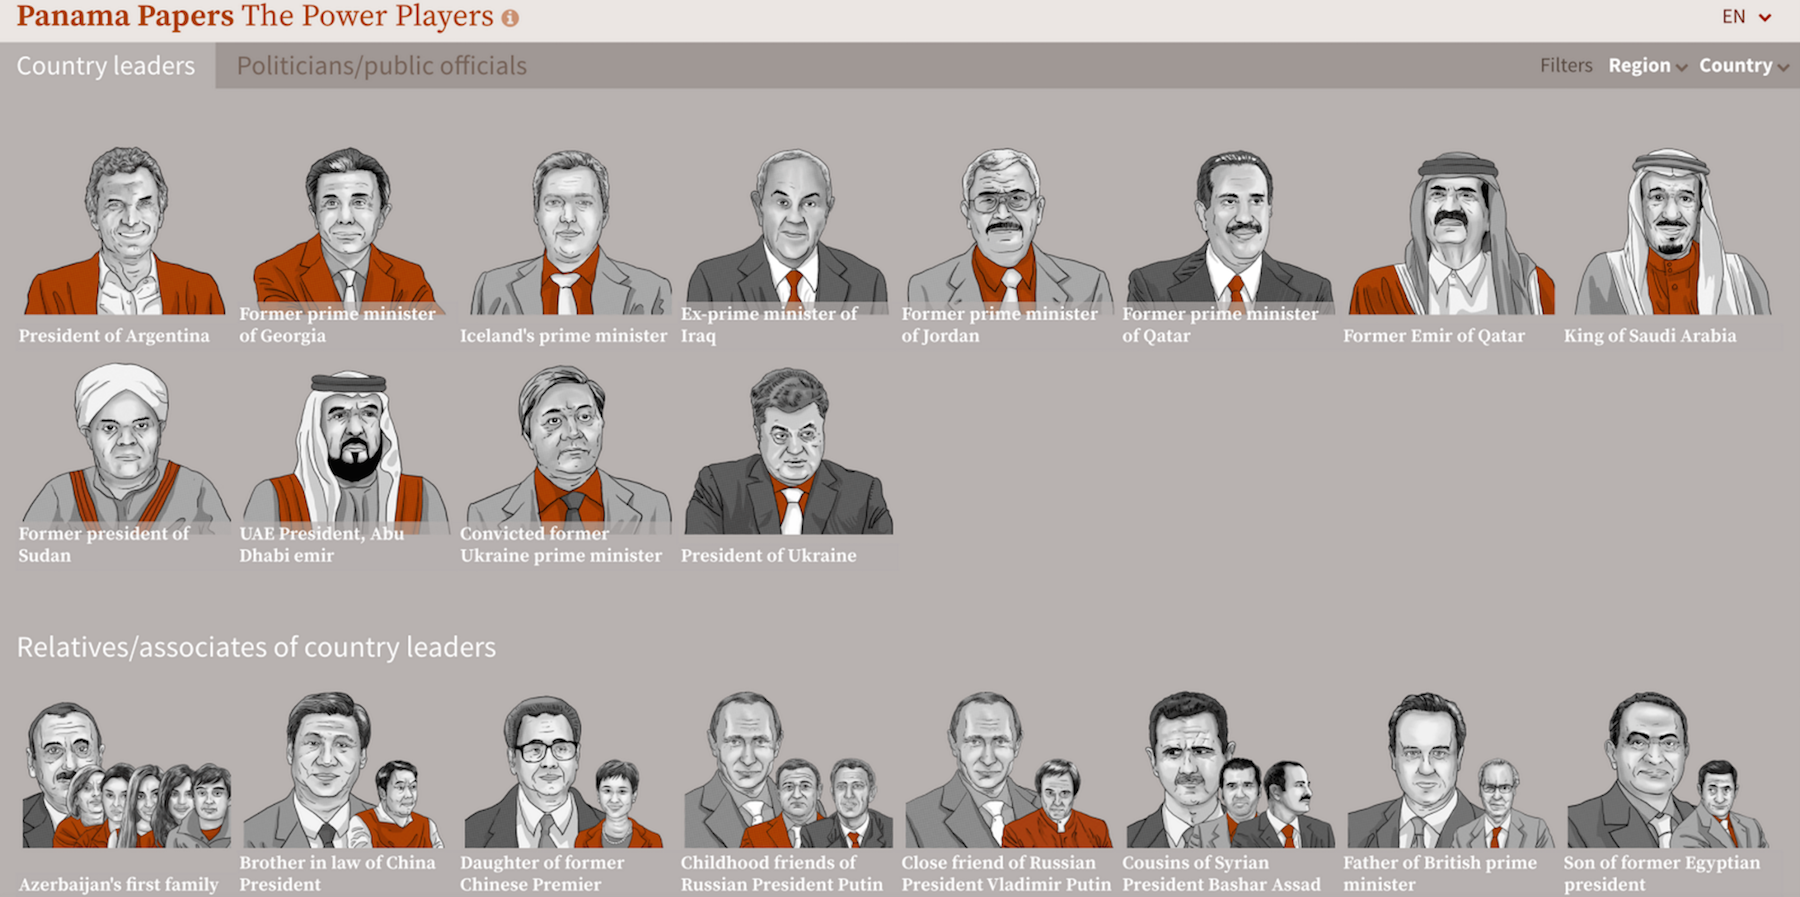
Among those 140 politicians there were 12 current or former heads of state. Some of them may be familiar to you because they’ve been in the spotlight, like Iceland’s prime minister – or I should say Iceland’s former prime minister – because after our revelations he actually had to resign because he had not declared an offshore company he had with his wife.
But that wasn’t even the most interesting thing we found. Inside those 11.5 million files that belonged to the Panamanian law firm Mossack Fonseca we found a number of criminal and corruption connections. We discovered that there were 33 blacklisted companies by the U.S. government that were in the data and that Mossack Fonseca was doing business with them.
We also found interesting enablers of the system such as the banks that were involved. We found that there were around more than 500 banks that served as intermediaries asking Mossack Fonseca to create around 16,000 companies in tax havens.
Here in the U.K. we worked with The Guardian that put resources to work in this investigation and their amazing data team did this investigation that looked into how properties in London are being bought through offshore companies. Nearly one in ten of these tax haven companies that are connected to properties in London were linked to Mossack Fonseca.
There were hundreds of stories published by our partnering media organizations. In my native Spain, journalists are still publishing stories today even weeks after publication. You can imagine how many stories there are in 11.5 million files.
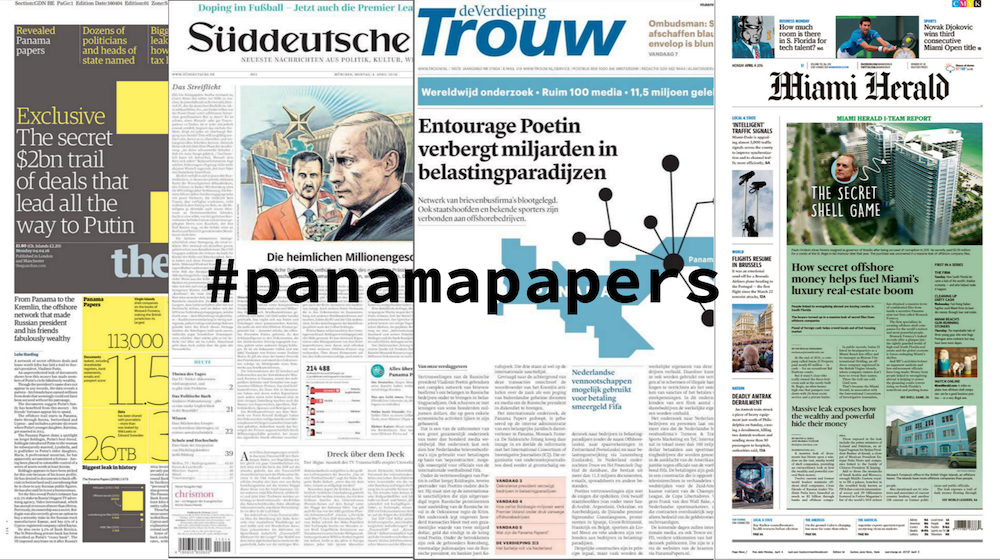
Because the way we worked together for a year during the investigation, we shared everything and then published it all at the same time. That’s why #PanamaPapers became a trending topic on Twitter for days and still is.
The Challenge of Journalist Collaboration
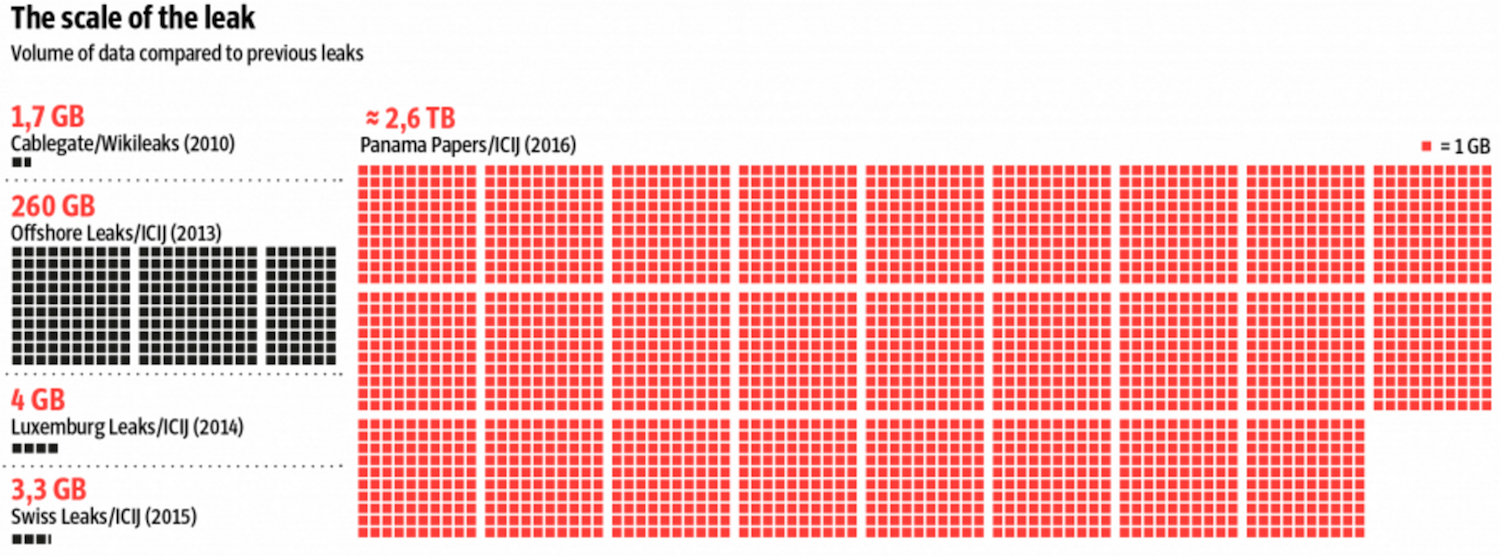
The Panama Papers is bigger than what we have ever worked with. I know for some of you 2.6 TB of data is nothing but in the journalism world, you get gigabytes. You get things passed to you on a flash drive.
So the first question for us was how do we deal with so much information? How do we deal with so much data? And the second question was how to share it with so many reporters in a secure way and that’s accessible from anywhere in the world at any given time?
That’s where technology became crucial and where our previous experience with leaks, databases and collaborative teams became handy. The first thing we did was to look for open source tools that allowed us to solve our problems.
The first challenge we faced: we needed our journalists to communicate amongst themselves around this data. These journalists did not belong to the same newsroom or know each other at all. They all came from different media cultures, different company cultures, different national cultures and different languages.
How would we get all these people to talk and share? We found an open source social network tool called Oxwall that we tweaked to our advantage. We basically created a private social network for our reporters.
It has a news feed much like Facebook where you see the latest things happening in the network, and you can add have forum posts much like any other forum. You can share links, you can share files, and you also have a private messaging feature where reporters can speak to each other individually.
For us, it was very important to have some security measures in place as well. In this investigation, we determined that governments were not a threat. That actually allowed us to be less paranoid about security.
But it was important to enable things like two-step authentication, for example, so that our reporters had to authenticate through two devices every time they logged in. Of course, everything is served over HTTPS as well.
It was essential to have reporters communicating with each other because if they hadn’t, The Guardian reports would have found one aspect of the story, Le Monde would have found a different one, a Spanish paper would find something else entirely and nobody would understand the bigger picture or know what the others had found.
Dissecting the Panama Papers Data
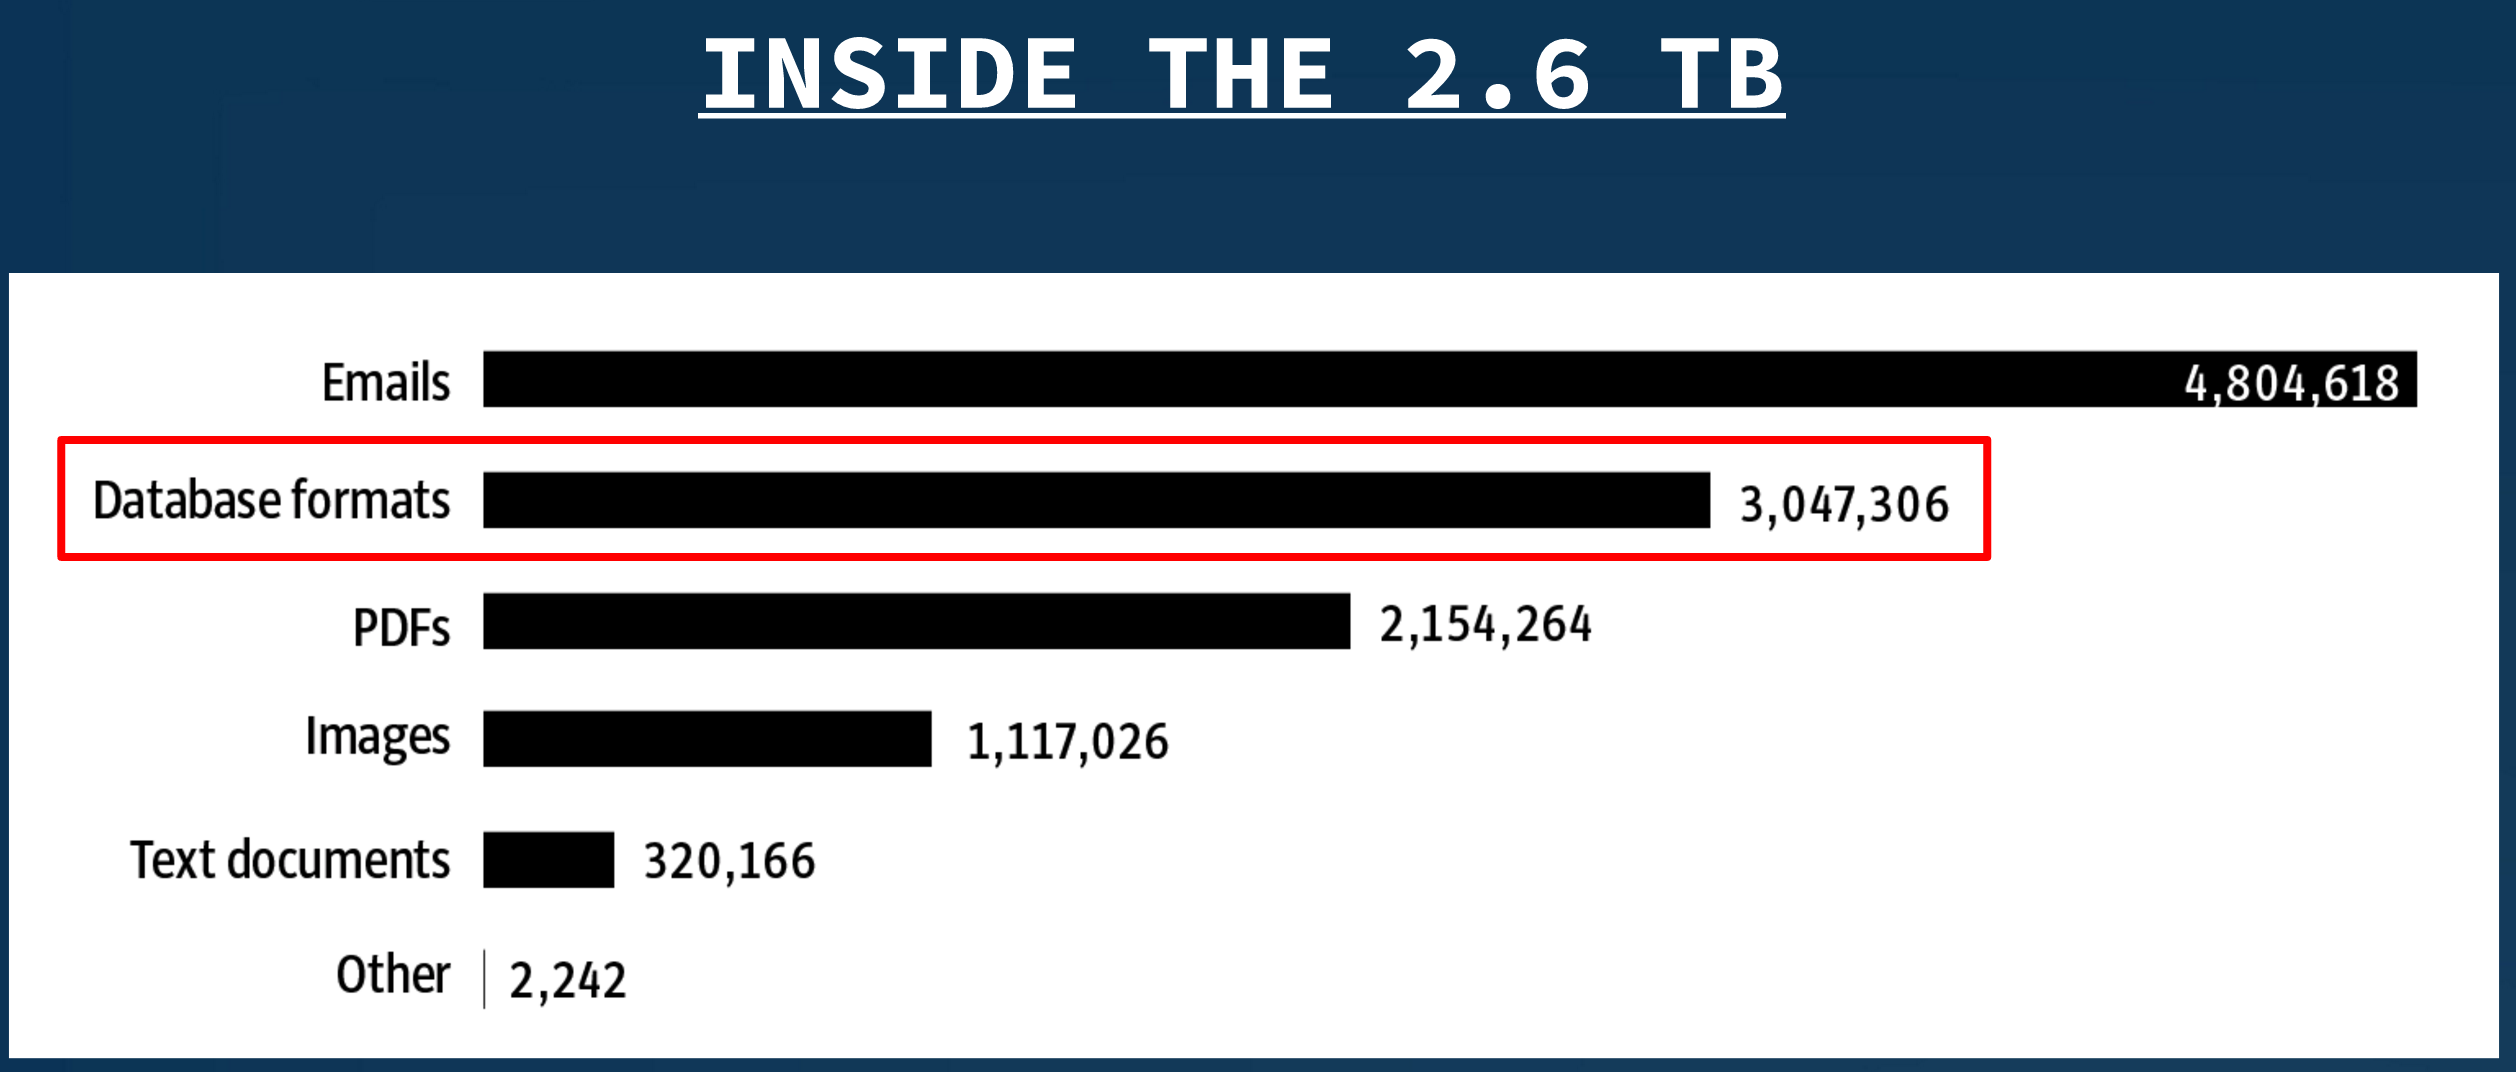
So, what was inside the 2.6 terabytes of data?
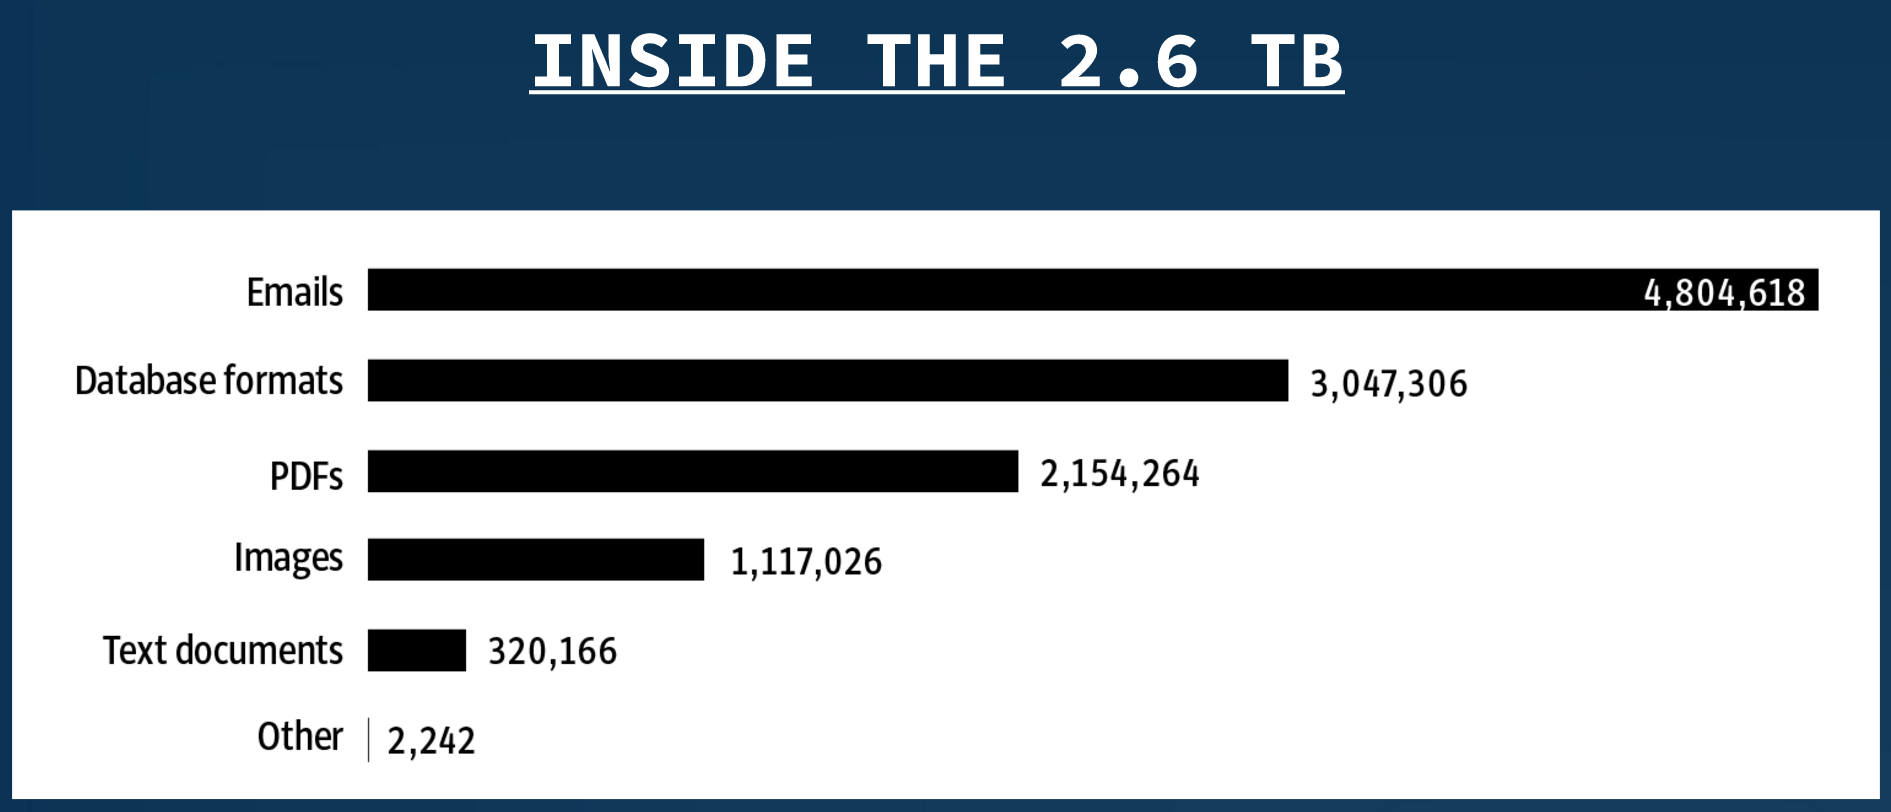
As you can see, the majority of the data was emails. We also had PDFs and images that we had to process, and it all took a long time. Imagine images of scans, records of incorporation, records in the British Virgin Islands, in Samoa and in Panama, and all of that passed through a scanner and put in PDF files. We had to spend a quite a bit of time at the beginning just processing the documents.
How did we process all that? We harnessed as much cloud power as possible, building an army of 30-40 servers at a time to do parallel processing of all those documents that had not been converted into optical character recognition (OCR).
Again, we turned to open source technology. We used Apache Tikaand Tesseract to do the OCR.
We created a small program ourselves which we called Extract which is actually in our GitHub account that allowed us to do this parallel processing. Extract would get a file and try to see if it could recognize the content. If it couldn’t recognize the content, then we would do OCR and then send it to our document searching platform, which was Apache Solr.
Based on Apache Solr, we created an index, and then we used Project Blacklight, another open source tool that was originally used for libraries, as our front-end tool. For example, Columbia University Library, where I studied, used this tool.
We tweaked it and made it available to reporters who mostly just wanted to use it for searching. They just wanted a private mini-Google where they could do searches, look at a document, download it if they wanted and do some faceting based on year, path, file type, etc.
Helping Reporters Search the Panama Papers Data
What I liked about these tools especially – and the tools I’m going to talk about next connected to graphs – is that they allowed me to cater to my two different types of users. On one side of the spectrum, I have very good investigative journalists that have been in the business forever. Everyone tells them secrets, even stones would tell them secrets if they could. But these journalist users are not very tech savvy. For some of them, email is a big achievement.
On the other side of the spectrum, I have developers and very tech-savvy journalists. These people worked with the Snowden files, and they know how to query data in very sophisticated ways. What I like about Blacklight and Solr is that they not only allowed journalists to search any word and do the typical Boolean searches. They also allowed for more advanced querying features like proximity search.
So if in the example below we’re searching for Joaquin Loera, within two steps you also get results like Joaquin Guzmán Loera, and it allows you to search with regular expressions.
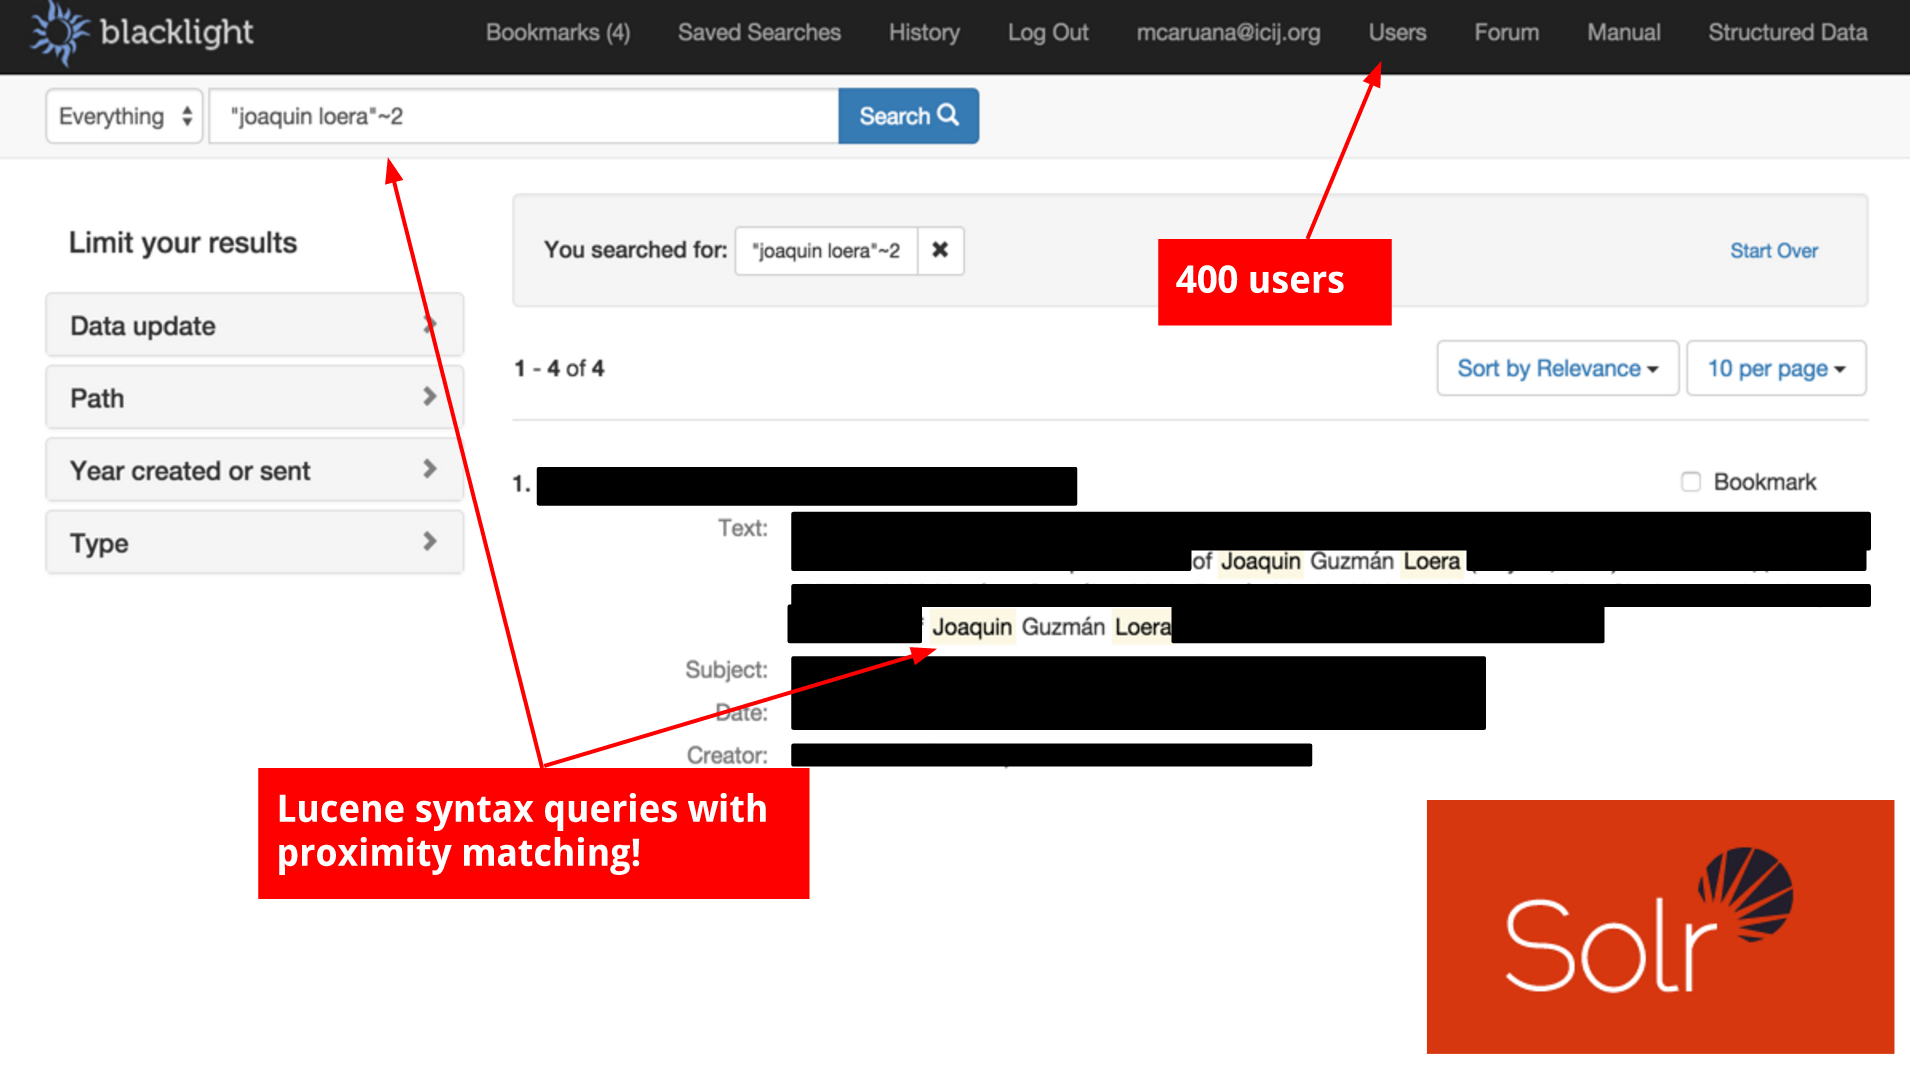
Blacklight also allows you to do searches on the API if you have that enabled, so you could do more complex searches. It’s open source, so we were able to tweak it as well.
For example, one thing reporters requested a lot was to search by inserting a whole list of politicians (rather than searching for each one individually). We then built in a feature to do batch searching. Our reporters then just had to upload a CSV file with a list of names – let’s say the politicians in their country – and within seconds, they got a CSV back with the results and the possible documents that had interesting information for them.
All of these customizations are why we turned to open source: because we were able to improve it and adapt it to our needs.
Tying It All Together with Graph Visualization
To review, the first platform we had to implement was to help reporters communicate. The second step was to give reporters access to the 11.5 million files and to be able to search inside them.
The third step was how to visually organize more than 210,000 companies in tax havens across 21 jurisdictions and all the people behind them: shareholders, beneficiaries, intermediaries, addresses, etc.
Inside the 2.6 TB, if you look closely, you find that we had a lot of documents that were in a database format that came from Mossack Fonseca’s internal database. We had to reconstruct that internal database, and once we had it in Microsoft SQL Server, we were able to conduct deeper investigations.
At the beginning of the Panama Papers investigation, we knew we had to use a platform to communicate and a platform to search the documents in the form of graphs. How did we know that? Because we’d done it before.
Before the Panama Papers investigation, we completed the Offshore Leaks Database. It was three years in the making and was the most visited website the ICIJ or our parent organization, the Center for Public Integrity, has ever done. It has still received, three years later, more pageviews than any other story we’ve published.
Released in June 2013, the Offshore Leaks Database is a simple search box. You search and you can find a name like Carmen Thyssen, one of the main art collectors in Spain. You probably have gone to the Thyssen Museum if you’ve been in Madrid. Some of the pieces in the museum include a Van Gogh, Water Mill at Gennep, that is being shown there.

The owner, however, is not Carmen Thyssen. Well, she is, but through a company in the Cook Islands. That’s what you were able to see in the Offshore Leaks Database, and you were able to explore the graphs. Back then this was just a website served with a MySQL database and using a graphs JavaScript library, Sigma.js, to visualize it.
Back then, when we noticed that this graph visualization was so well-used, we realized that it could be really helpful for our reporting process as well. So, we started looking for graph visualization tools.
That’s when we found Linkurious.
Linkurious is software that allows you to visualize graphs very easily. You get a license, you put it in your server, and if you have a database in Neo4j you just plug it in and within hours you have the system set up. It also has this private system where our reporters can login or logout.
It basically had everything we needed and that’s when we started working with Linkurious and Neo4j. We started working with them in the Swiss Leaks investigation in 2014, but it’s not until now that I think we’ve grasped the full potential of what graph databases can bring into our reporting.
As I was telling you, our databases in Offshore Leaks and in the case of the Panama Papers were in SQL, but thanks to another open source tool – in this case Talend – and extractions from a load tool, we were able to easily transform our database into Neo4j, plug in Linkurious and get reporters to search.
Below is one of the graphs where Linkurious allows you to search visually:
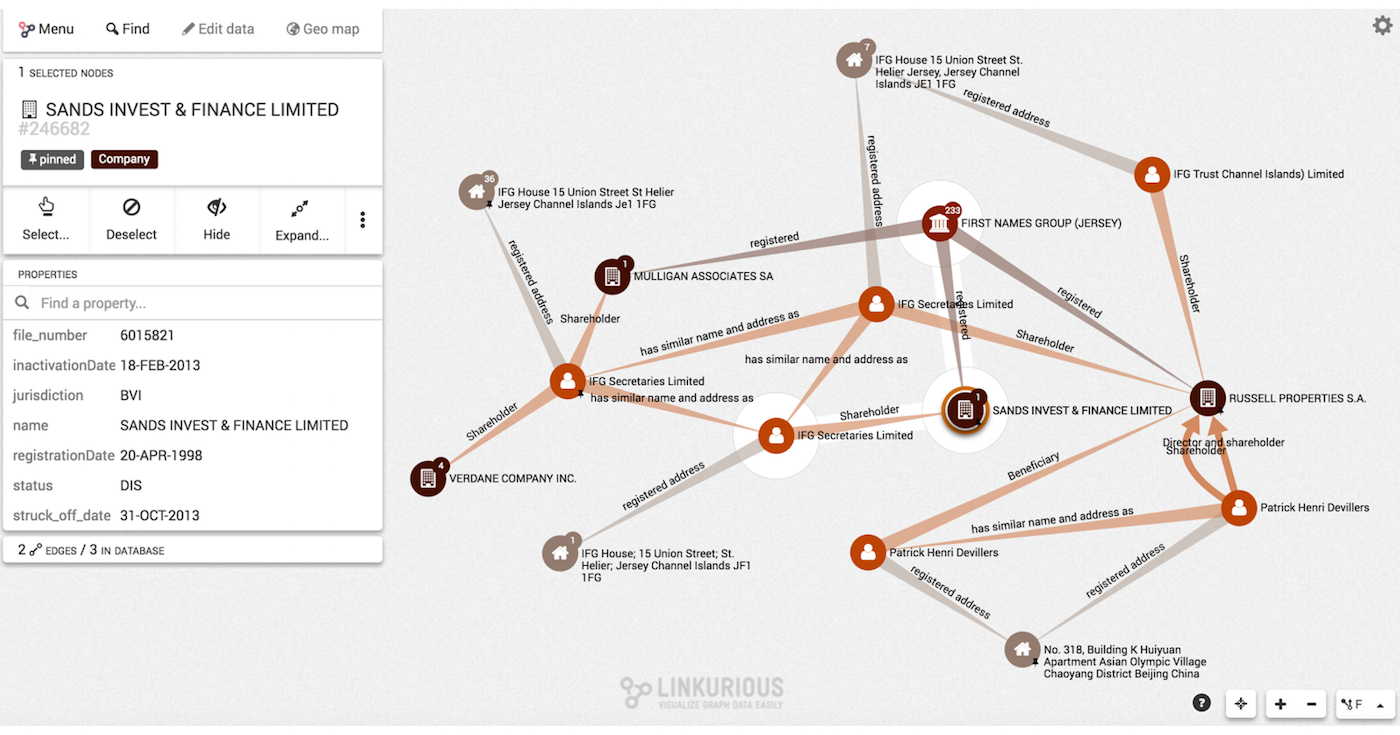
In the top left, you can make searches like they do in Google. Results appear as dots, and then reporters can simply expand dots. Remember that many of these reporters are not very tech savvy.
The good thing about Linkurious is that the reporters or the developers at the other end of the spectrum can also make highly technical Cypher queries if they want to start looking more in depth at the data. I really liked the fact that we could cater to both sides of the spectrum, get it to search, get reporters to even share the visualizations amongst themselves and keep collaborating not just with words and through documents but also with graphs.
Just by expanding dots, my reporters found a lot of information that they had not found previously. They found a lot of connections that they had missed when they had just looked at the documents individually.
Our database ended up having around 950,000 nodes and 1.2 million edges, and the size of it is around four GB. I know some of you may think that’s pretty small, but if we could handle this project with just three developers, imagine what you can do with more development power and with way more data at your company.
Why the ICIJ Loves Neo4j and Linkurious
Some cool features of Neo4j and Linkurious that we especially like: Not only do we like the fact that our reporters were able to share the graph visualizations amongst themselves, but we also liked the magic of finding the shortest path.
Most of my reporters don’t know how to do queries in Cypher, so the fact that they can ask whether Mar Cabra is connected to David Cameron and that Neo4j tells them immediately with just one click was pretty amazing.
We also like the fact that Neo4j and Linkurious had fuzzy searching. I remember a Finnish reporter telling me that she had found so many other Finnish clients of Mossack Fonseca that she’d found thanks to fuzzy matching techniques, because in many of our languages, names can sound similar.
The public-facing features of Linkurious were another plus. Even though the whole dataset was private, we could actually select a graph visualization, publish it to the web and embed it like you would embed any YouTube videos through an iframe. These visualizations could then be embedded into a story.
Linkurious also has an API that we’re currently working with so that we can build the new Offshore Leaks Database.
The Future of Data Journalism at the ICIJ
I like the fact that we were able to implement technology in the reporting in a way that I would dare to say has never been done before. We worked with the largest data leak in history. But to me one of the main reasons why we do the type of work is not only to bring down prime ministers, but also to expose crime and corruption. If crime and corruption and drug trafficking and weapons trafficking are global, reporters need to work globally.
A closing note about the ICIJ: While we have three developers, our full-time staff is only 12 people, and we are a non-profit media organization. That means that instead of depending on commercial funding from big corporations like many companies do, we depend on donors like you.
If you really like our work, if you really think we’re doing a good job, I would encourage you to think of donating because thanks to the donations of people like you we get to do the work we do.
Inspired by Mar’s talk? Click below to check out the rest of the videos from GraphConnect Europe.