


Presentation Summary
Andreas Kollegger, the product manager for Neo4j Bloom delves into the meat of what makes graph visualization so interesting. The multifaceted answer includes different perspectives and points of views looking at graph databases as a thinking tool, development tool, communication tool, interactive tool, reporting tool and analysis tool.
Graphs are not just for developers anymore. Mind maps are small-scale graphs that people put together to think through some domain.
Graphs help visualize the data and sort how you might want to write your queries. This is a developmental perk.
Newspapers present scenarios with multiple players to illustrate and explain situations. This makes graphs a helpful communication tool.
Live data could be walked through and explored. You could find how one part of the graph is related to some other part and discover new links. This makes graphs interactive tool.
In terms of business intelligence, you might want to be able to have charts, pie charts, line charts and see some reason for the data. This makes graphs a great reporting tool.
Finally, dat scientists want a deeper understanding of the data. They need to have a broad understanding of the data, which is much easier when it is displayed all at once. This makes graphs a valuable analysis tool.
Next, we look at how we are doing graph visualizations today.
Northwind is a fictional company made to exemplify the many use cases for Neo4j for enterprise. Kollegger breaks down how graphs help the purchasing, shipping, sales, and human resources department.
Companies are able to share relevant data with relevant teams and blur out irrelevant data. Graphs can share more with sales, less with human resources and integrate with Slack, iMessage and embed on a website for customers.
The end goal for Neo4j Bloom is for everyone who’s got data inside of the graph to be able to access, search, explore and (with the correct rights) edit that data.
Full Presentation
Hello, my name is Andreas Kollegger, I am the product manager for Neo4j Bloom. Bloom is our graph visualization tool. I want to introduce you to Bloom, give a little tour of the features and do some walkthrough examples about how you might use Bloom on a day-to-day basis.
We’re interested in the business views of the graph. That’s the main point behind Neo4j Bloom.
Why is graph visualization interesting?
Graphs are inherently visual. We always like to talk about the white board friendliness of graphs, but is that really enough to motivate building a graph visualization tool? There’s plenty of vendors who have fantastic applications. What are people doing with these graph visualizations?
A Thinking Tool
One way to think about graph visualization is that it is a thinking tool.
If you’ve seen mind map tools, those are just graphs. Mind map tools are small-scale graphs that people put together to help think through some domain. They realized the fact that they have some data. Now, they want to figure out what’s related to that data.
Maybe you’re making out a plan for a wedding. You’ll have to figure out all the things you need to have in sequence, all of the things that have to happen before other things, all these complex dependency trees might just be a little mind-mapping exercise. That’s a graph visualization.
A Development Tool
You might be building an application with Neo4j. You might be building some sort of master data management tool, or some logistics planning tool, or some fraud analysis. If you’re building an application, then you’re storing data inside of Neo4j.
It’s helpful to be able to see the stuff that you’re storing to make sure it looks the way you think it does. When you’re trying later on to run some queries and not getting the responses that you think you should, seeing the data helps you understand how you should write your queries. Being able to visualize the data is helpful as a development tool.
A Communication Tool
In newspapers there are scenarios portrayed with all the players involved, and then explaining all of the things that they’ve done together.
Graphs are a way of presenting different kinds of metaphors for explaining situations. Graph visualization is critical for that communication as a presentation tool. This is a fantastic use of graph visualization.
An Interactive Tool
If you have live data, not just an infographic, you are able to show people, “Here’s what my scenario looks like.” The scenario could be a live scenario that you walk through and explore. You could find how one part of the graph is related to some other part of the graph and maybe discover new things you didn’t know were there.
The graph itself becomes the tool for doing some useful work.
A Reporting Tool
Reporting is a bit more traditional in terms of data visualization. You might be interested in graph visualization because you want to do traditional business intelligence. You want to be able to look at all the data you have in the graph, but still do normal BI type things.
You want to be able to have charts in addition to your graphs. Those maybe some pie charts or line charts, see some reason for the data, and get some business insight out of that.
An Analysis Tool
If you’re a data scientist, you go past just making bar charts. You want to be able to have a deep understanding of the data. You’re going to be looking at the entire graph or different communities within the graph. You want to be able to understand all of the different communities that are there, and maybe how those communities relate to one another.
- Who is the most important person in this graph?
- What are the most important groups within this graph?
- How is this graph going to evolve based on the structures that you’ve analyzed?
Doing some analysis that then decorates the graph is the best way to actually understand what the analysis is telling you.
How are you doing graph visualization today?
There’s lots of different reasons why you might be interested in graph visualization. If you want to do graph visualization today, you have many nice choices.
This is a list of our lovely partners and friends who have fantastic tools that you can take explore.
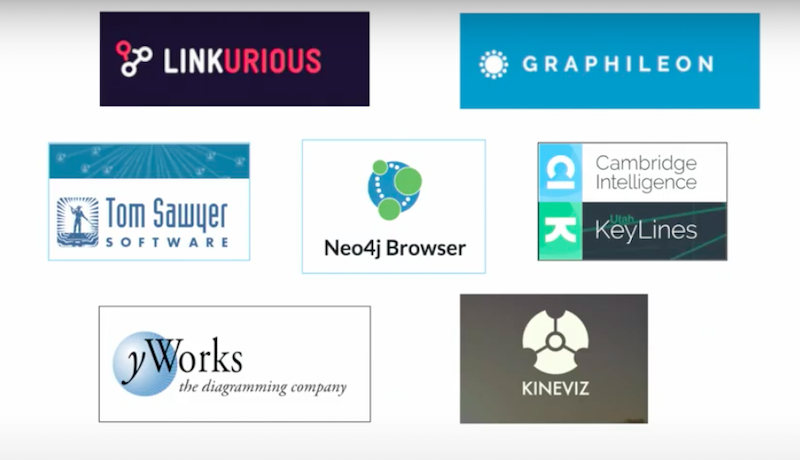
We love these folks. These are feature-rich, mature tools that do all kinds of great things with graph visualization. Friends like Linkurious, people like Keylines and Tom Sawyer, who’ve been at it for a while.
Toolkits like yWorks are great if you want to build your own diagramming tool. It is a graph visualization tool but custom-built for a particular application you’re trying to build. All kinds of great things are out there.
We also have players like Kineviz. They’re doing stuff in a 3D space with graphs, which is going to be really exciting. I love the idea of being able to walk through a graph and grab nodes and move them around, maybe clank them together. I’m not sure if that’s what their plan is, but I’m hoping.
If you’re familiar with Neo4j, you know that by far the most powerful tool for graph visualization is our own Neo4j Browser. It comes built into Neo4j for Neo4j. The Neo4j Browser has a modest amount of graph visualization you could do. If you’re comfortable writing some Cypher, you see the results of that Cypher as a graph of a few dozen nodes or cells. Neo4j Browser is a fantastic way to do work with Neo4j if you are a developer.
Graphs Are Useful for More than Just Developers
Graphs are useful for more than just developers, which is illustrated in the list of things we went through earlier. We talked about different ways to think about doing graph visualization and why you might be interested in graph visualization. Only one of those was talking about why developers are interested.
If your organization has data in the graph, more than just one department will be interested in seeing and working with that data. They might not be writing Cypher, but they will still need access. What do we do for those folks?
We decided to add a feature to Neo4j Enterprise Edition. Neo4j Enterprise Edition is the full complete package of Neo4j with all the stuff that we put together into one deliverable. This edition is useful out of the box.
We added a feature that lets anybody who’s interested in data inside of the graph to use, work with and even edit that data.
Neo4j Bloom
We designed and built Neo4j Bloom. One of the most fun things to do with Neo4j Bloom is have these lovely blooming graphs full of nodes.
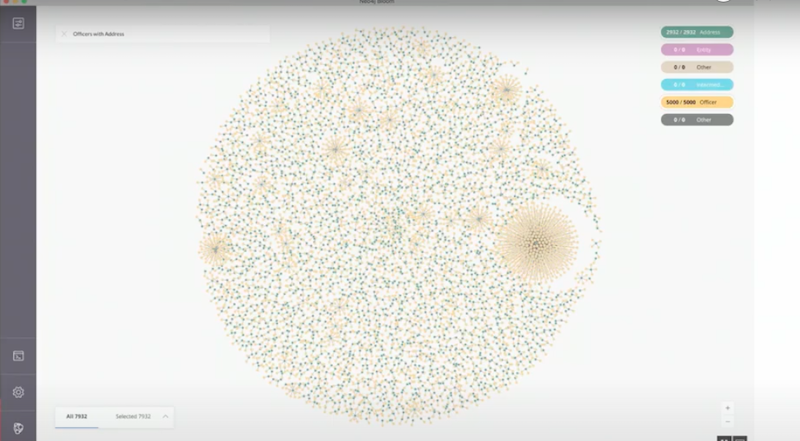
There are lots of sub graphs in here. We see different clusters within this particular visualization. This data set was pulled from the ICIJ. These are just officers and the addresses that they were using. We call it Neo4j Bloom because it blossoms out from the middle.
Looking at this, you easily identify the big cluster of nodes. There’s another point on the right that is clearly a cluster of activity where there’s something going on. If you’re doing a fraud investigation, that’s probably a good place to zero in and start to expand your investigation.
A lot of this seems like it’s fairly innocent stuff. I mean this is the ICIJ Paradise Paper, so lots of the stuff in there is just perfectly legitimate. It’s not fraudulent activity. It’s just normal day-to-day business stuff.
However, if you’re looking for where there might be some fraud, look for the highly connected parts of the graph, do some more exploration there, and then you could write some great journalistic investigative reporting. That’s one of the things you can do with Neo4j Bloom.
Let’s talk about the feature set that we have with Neo4j Bloom in 1.0 release.
We’re still a database company. That’s in our DNA, that’s how we think about things. The first thing we thought about when building a graph visualization tool, was what the data model will actually look like.
Sure, the data model is the Neo4j property graph. However, if we want to have the Neo4j property graph available to everyday users, they don’t necessarily know what labels are or what the relationship types are.
You know that when you’re building a data application with Neo4j, you’ve got a convention for when you use this particular kind of relationship type with this kind of label. You have in mind a business view of the graph or an application view of the graph that is represented inside of the property model. It’s similar to what happens in the relational world.
In the relational world, you have a conceptual model, which is the business view of the problem domain. But then you’ve got the physical model of how you break that down into tables, foreign key relationships and things like that.
Business users don’t care about the foreign key relationships. They care about the business entities. They care about that conceptual model that you started with. That’s our starting point with Neo4j Bloom. Our focus for Neo4j Bloom, is to have a data model that recaptures some of that business view of the graph. The business view is there, it is implicit in the actual graph, labels, relationship-types and even the property keys that you have. That recaptures the business entities and focuses on the business entities themselves. That’s our starting point.
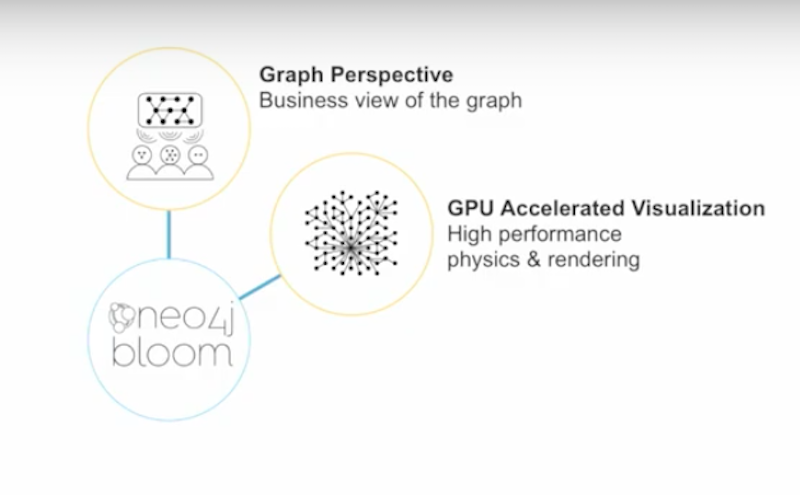
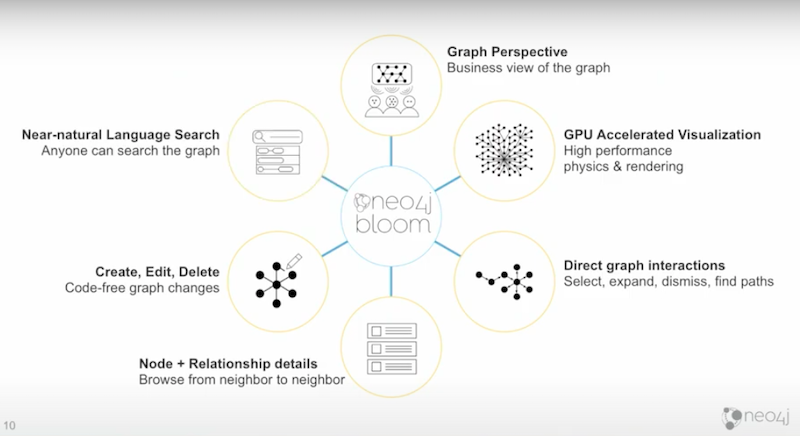
We’re technologists, we love writing code. What would be a graph visualization without being GPU powered? The math involved in doing the physics layouts, and even doing the kind of rendering that we want to be able to do requires GPU power to do properly. We built our own GPU-accelerated visualization engine for both doing the rending, but also for doing the physics calculations involved.
It wouldn’t be a graph interactive environment if you couldn’t interact with the environment. We made interaction a basic thing you could do with the nodes.

You are able to move the nodes around and explore the graph directly by pointing and clicking – no code required. If you want to, there’s two complementary views that are helpful together.

The graph is fantastic when you’re just exploring. This is great when you want to see overall structures and the neighborhoods of things. Sometimes you want to have a web browser view of things. This has come up earlier when we first did our market research on building a tool.
One of our customers said they would want to have a graph visualization tool that allowed them to look through their bill of materials. Then, they wanted to page through all of the bill of materials that are related to that. They wanted a drill-down view. They wanted a web browser view of the graph to look through all the details.
In addition to the graph’s structural view, which includes all the nodes, the classic circles and lines, we also have this detailed view that we’re calling a card view. In card view, we have node and relationship details. Then you are able to browse the graph through that as well. You could switch between the two modes of operating, and they work really well together.
Because this is the fundamental way of interacting with the graphics, it’s nice to be able to explore the graph. However, if you are a user who has the rights and the need to edit the graph, you have basic graph editing capabilities.

You could change property values, create nodes, create relationships and remove them as well. This becomes all you need to create some data, put it in Neo4j and use Neo4j Bloom. You already have useful things you are able to do, because the data itself is the application. The graph is the application.
The final bullet is near-natural language search.
These are the defining product features of what Neo4j Bloom is, how it’s different from other graph visualization products, and the things that we want to focus on. Because we’re Neo4j, the database company, this reflects our heritage. This is where our sweet spot is. This is what we feel we do the best.
We understand how people model data inside of graphs, because we’ve been doing that for well over a decade now. We also understand how to find stuff within the graph, that is how you actually query the graph with our proprietary Cypher query language that’s now become an industry standard.
We want to extend that and make it available to normal everyday users. We thought the way to do that is with a near-natural language search. I’m going to focus on these last two points a little bit more, just to explain exactly what I’m talking about there.
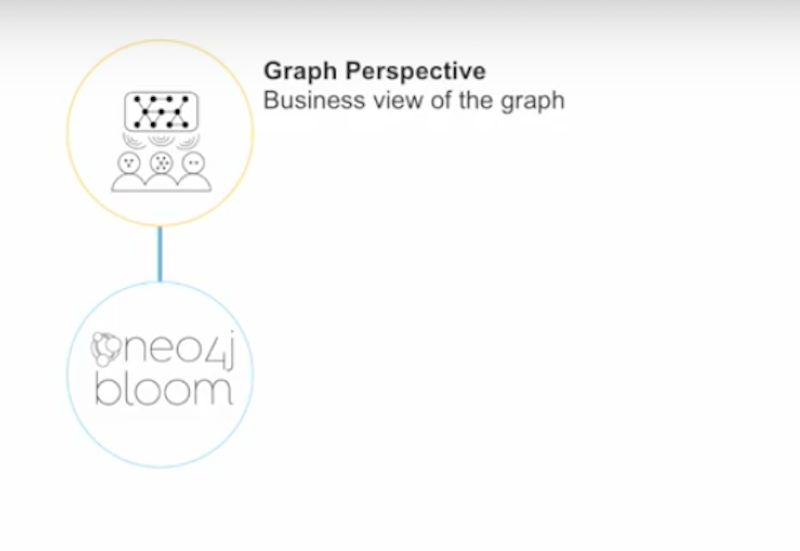
Graph Perspective
This is a business view of the graph.
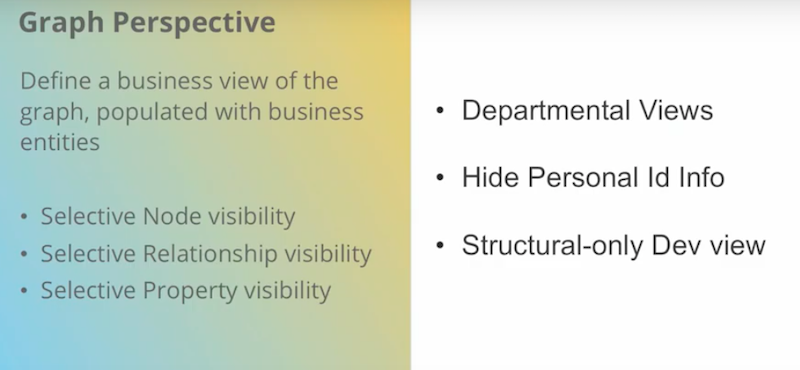
This is defined by the node labels and property keys that you have, categorizing those into business entities, and then how those business entities relate to each other. The fundamental idea is to recapture this business view, and then that’s the primary way you actually interact with the graph.
This is useful because you might start the same way many of our customers start – having a very specific problem that they’re trying to solve. They come to Neo4 because they’ve got a query problem. Perhaps that query doesn’t run very fast. They think that Neo4j is going to run that query faster. Some of their data moves over to Neo4j. Or they have a very specific demand problem that is really a graph problem. They move that data over to Neo4j and they have a graph application there.
If you have any data inside of a database, whether it’s Neo4j or anywhere else, it’s usually more useful than just a single application. There are probably multiple users of that data who would love to have access to that data. With these business views, the other nice part about this is that you can abstract a business view that has different perspectives. You could have different departmental views, one for HR, one for the sales team. They could all be looking at the same data, but looking at what they care about within the data, or what they’re allowed to see within the data.
If you’re concerned about being able to hide identifying information for compliance reasons, you could use the perspective to actually hide the data that people shouldn’t be able to look at. Or if you want to give your developers a purely structural view, they could have this perspective. They could have a view that sees only the nodes and the relationships but none of the content.
All of this is possible by having this abstraction on top of the property graph model which we’re calling a perspective view.
Near-Natural Language Search
The other feature that I mentioned is this near-natural language search.
This actually started from the observation about graphs being very whiteboard friendly. One aspect of being whiteboard friendly, is that it is visual, that’s very nice. Another aspect of being whiteboard friendly is when you’ve gone with a colleague, you’ve gone to a whiteboard and you’ve written something down with some circles and some lines. The kinds of structures that you’ve created, the kinds of names you’ve given things, both to the circles and to the lines, you could actually just read out loud, and the form somewhat coherent sentences sometimes.
Often the labels end up being noun-type things. The relationships will be verb-type things or sometimes attribute-type names. Yet you could find one part of the graph and just go from a node to relationship to a node to relationship, and have this somewhat stilted grammar that you could just speak out loud and understand. If you fill a couple extra words out then it becomes a language. That was our starting point for the near-natural language search.
We realized that all graphs and their data are really a dictionary. You could take advantage of that dictionary by expressing a grammar that you use for searching.
If you’ve gotten data that makes sense because of how you’ve labeled it, we use that as a dictionary for actually producing a natural language that we are able to parse. For somebody who’s not familiar or comfortable with Cypher, they could type in something that looks like what they might type into a Google search.
Rather than Google being the knowledge graph of the web, we wanted to be the knowledge graph for all graphs that are using Neo4j.
We also add two other ways of searching, we want to add full text rich. We’re going to take advantage of that inside of Neo4j Bloom. If you don’t know what the structure of the graph is, you could just type in your search. Let’s say “Tom Hanks” for example, hit Return, we’ll look through the entire graph and find wherever Tom Hanks shows up.
If you have some experts in your area that are familiar with Cypher, they could actually augment these perspectives that you have. Once you’ve defined a business view, in addition to defining what’s visible through that business view, you are able to write searches that are particular to that business view, where somebody could have idiomatic phrases that makes sense for the HR department or for the sales department, and then have those be parametrized.
Anything you write in Cypher could receive a parameter, and a normal human being could go to our Bloom search, type in an appropriate phase and give the right kinds of values. The Cypher will get executed, you get the results and you look like a genius.
Northwind Examples
I’m going to walk through both of those ideas using the Northwind example.
If you’ve used Neo4j, you know that we’ve got two data sets that we have baked into Neo4j’s Browser. You could use the movie data set which I referred to earlier with the “Tom Hanks” search. There’s also this Northwind example which is a bit more business friendly and has a very convenient feature.
This is a very rough schema of the Northwind relational database.
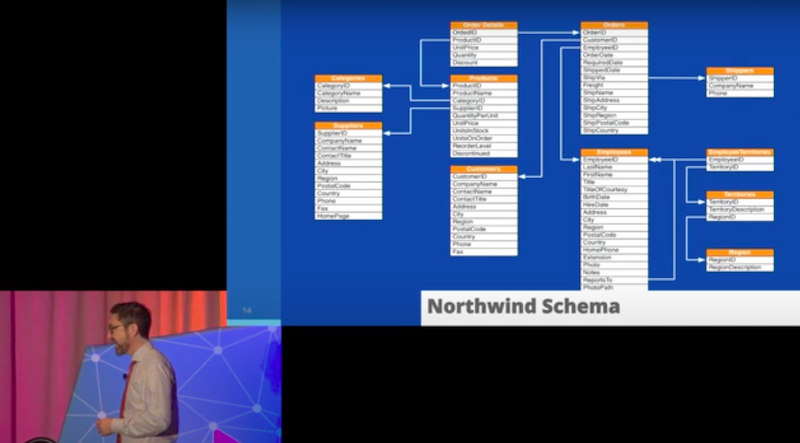
Northwind is a fictional company. They have some products that are in some categories that they sell to customers. The products are shipped via some shippers, and that’s pretty much it. It’s not a very complex domain, but it’s a reasonable way to actually think about things.
What’s fun about this domain is that just looking at this schema, you realize that some of these things are very closely related, like the orders and the order details are kind of the same thing. Just eyeballing the different tables, you realize that they’re actually different parts of the schema. You could draw boxes around and realize that those are actually different business entities. That’s one of the things we want to be able to capture.
Looking at that Northwind schema as a Northwind graph, it might look something like this.
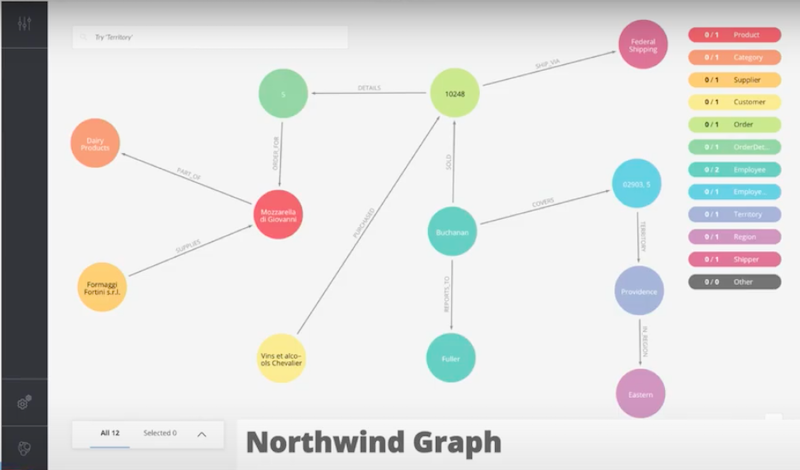
This is a screenshot of Neo4j Bloom showing a sampling of that data set, roughly positioned about the same way that the schema was laid out. You are able to see the categories of the nodes that are products. We didn’t make any changes to the data set. We let the order details still be separate nodes. We didn’t optimize that away to be just a relationship.
The order details go over to the green order. That then goes to some purple shipping company. All the same data is there, but now it’s in the graph. Now that it’s in part of the graph, you are able to explore this data in a really nice way.
Northwind Purchasing Department
If you happen to work for the Northwind purchasing department, you might get only a subset of that data.
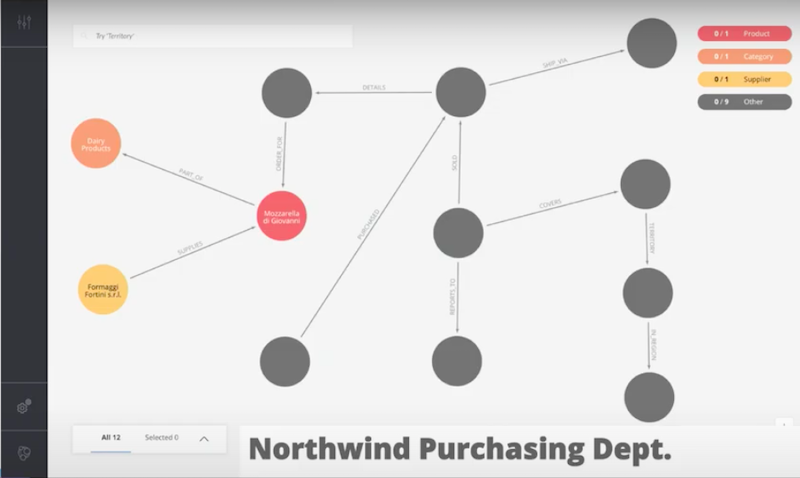
You might be able to only see the things that you need to know. This will enable you to know what to buy, so that you always have stuff on the shelf, and that your sales people are able to sell it.
You need to know the categories of things, the products that are in those categories, and then who the suppliers are. The rest of the graph is dark to you because that’s not stuff that’s important for you to know.
If this is the perspective that somebody has built for you, you could do something like this. This is an example of that somewhat stilted grammar that I was talking about.
This is beverage product suppliers.
This is not something that comes in conversation, but you could probably figure out what that means. I’m going to find the suppliers of these beverages, any products that are beverages.
If we try to run that in Bloom, we realize that from this graph pattern, it was actually just suppliers, product categories, and then the products that are in that category. We figure out what that was, figure out how to write the Cypher for that, ran the Cypher, got the results back, and then there is a result.
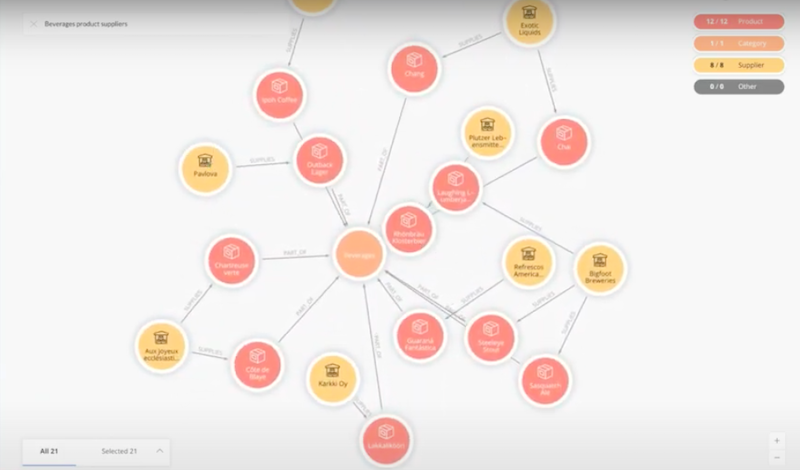
This is a bit more of a natural thing to say for somebody making purchasing decisions.
Here we have products ordered with pavlova, a delicious dessert. If you’re in the purchasing department, it might be helpful to know that when people order pavlova, that they order other things. You will know when you need to reorder the pavlova, you will also want to reorder those other things.
What are the products that are ordered with pavlova?
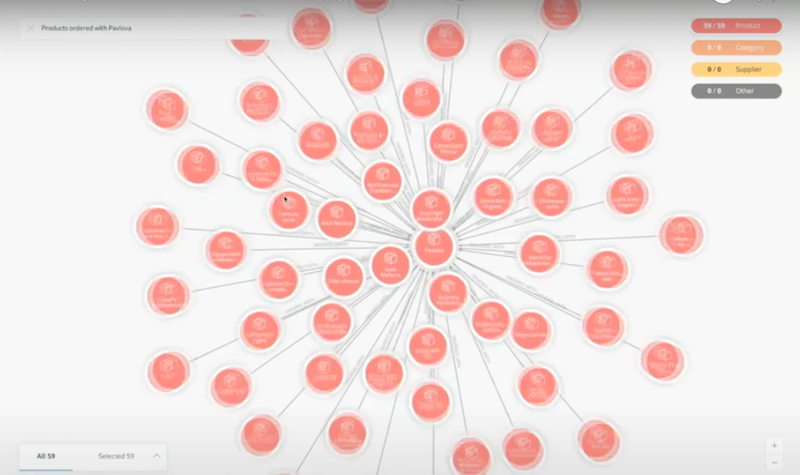
This is a simple question to ask and is the kind of thing that you could imagine people typing into a Google search. Instead you would type it here in Neo4j Bloom. Bloom tries to figure out what graph patterns it might exist. Because there are relationships between the products that are ordered together, we find both pavlova and the products that are related to pavlova in one big tree.
This is a structural view of the graph.
This is an unparameterized query entirely.

This is something you might run on a weekly or monthly basis. You turn on Bloom and say, “Okay, what am I low on stock on?” and it’ll just run a query and show you the results.
This is going to go through all the products and figure out what the view order levels are, we know what the current stock is. Let’s find the things that are below the reorder level, and go ahead and get them.
Here I’ve opened up the side detail view, which lets me scroll through all of the nodes that are on the screen.
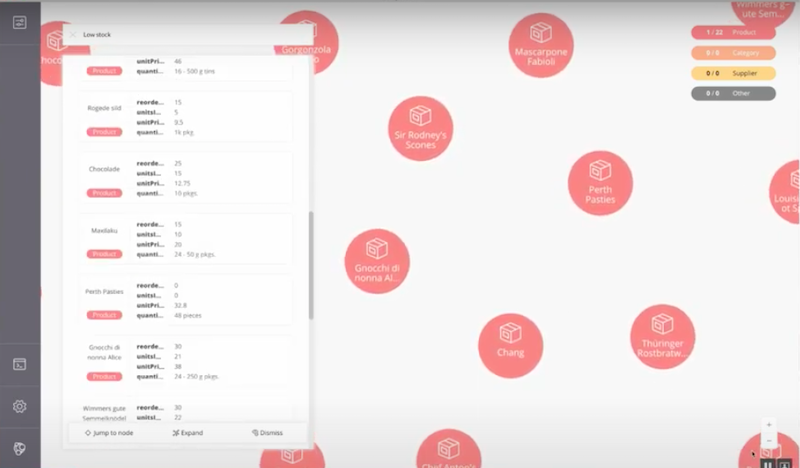
If I want to, I could double click in any of those cards, and see all of the details about what that product is.
Northwind Shipping Department
I’m going to go through a couple of different views from different departments. If you’re in the shipping department, the same kinds of ideas apply.
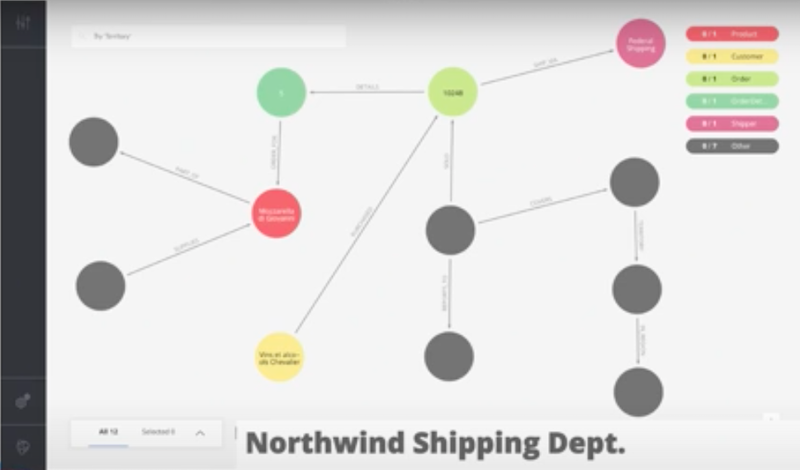
Now you see things like the order details and the product. You cannot see the categories, or who the suppliers are, because your only job is to figure out which customer ordered which thing. They asked for it to be shipped by this shipper, let’s go ahead and fulfill what those things are.
If you want to know who all the shippers are you could look at the shipper of orders to the ship city of Portland.

You could enter that into Neo4j Bloom. It’ll figure out what patterns are there and find what the results are. You then find out all the people who are shippers for the city of Portland.
We do a bit of the graph pattern matching. We figured out what the graph pattern is, and have our results.
I am able to ask things like who are the most popular shippers. These queries are a combination of graph pattern queries and extended custom search phrases. The custom search phrases become really exciting because once you start realizing the fun things you can do with Cypher, coming up with phrases makes it easy to run those whenever you want to. It is really fantastic.
As you add more and more phrases, you end up with this phrase book that lets you add them in Bloom, connect to the graph that you want to use and then get all kinds of useful things done just by calling out these phrases.
This does not exist in Bloom 1.0 to 1.2, but eventually we are leading towards a chatbot-like experience where we could have voice recognition. You would talk to Bloom and be able to find things. You could just be getting your morning coffee and asking Bloom about stuff about the graph and we’ll find the results.
Northwind Sales Department
Here is an example from the sales department. If you’re a sales person, this is your version of doing a recommendation query. This is similar to Amazon doing recommendations. That’s fantastic for consumers. There’s also a sales equivalent of that.
If you’ve got somebody who’s buying something from you, you want to figure out what else you could sell them while their wallet is open, right? This is an incredibly important question to ask. What could I cross-sell to somebody already buying Boston Crab Meat?
As a graph query, it’s pretty simple. As a Bloom search, it’s even simpler. You just start typing in until you finally get the phrase right. Cross-sell, you see that one of the completion options is that crab meat was there. As we’re doing the auto-complete, we both do auto-complete of the phrase itself, but also any property values that make sense within that phrase. I happen to see that crab meat was there. I clicked on crab meat, and then I got the results.

We know that crab meat is a good thing to cross-sell along with Sir Rodney’s Scones. I’m sure they’re delicious and probably complement crab meat really nicely.
I’m going to go through two more examples just briefly. This is the most reduced view of the graph.
Northwind Human Resources Department
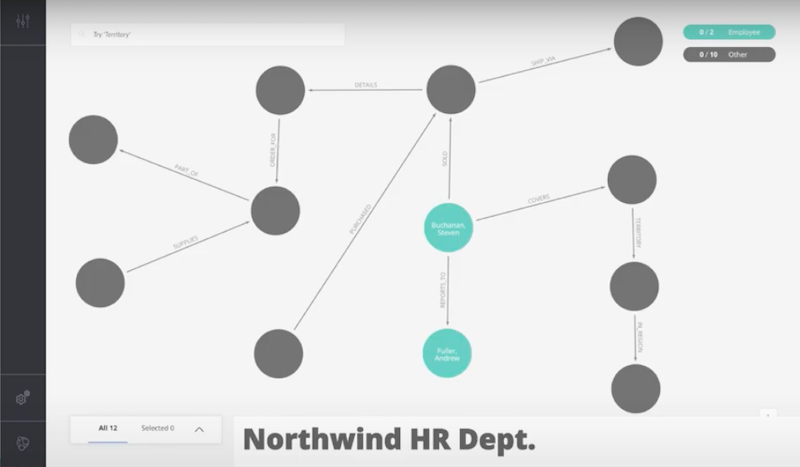
All the rest of the graph is now completely darkened. If you’re in the HR department, all that you really need to know is about the employees. All the sales stuff, all of the product stuff is not really relevant to you, so you don’t have a view that sees that. All you see is the employees, who they’re related to and who their reports are.
If you’re an HR person, you might want to be able to run a query like this.

You could have taken the time to have this integrated with Slack. You could have Slack send over a message to Bloom and say, “Hey, tell me the employees “who report to Fuller.” We find Fuller.
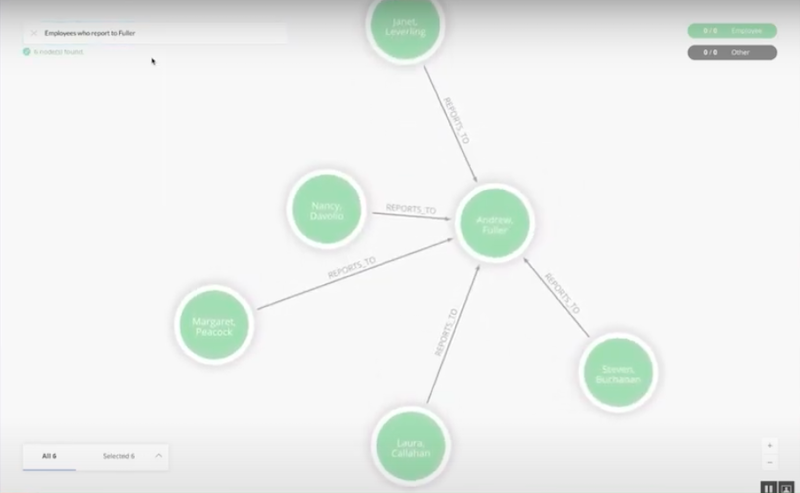
We find the people that report to Fuller.
I mentioned offhand that this is the kind of thing you could imagine integrating with Slack. That’s one of our goals with Bloom, we want to have a baseline of features that are easy to integrate with any other environment that you might be in.
One of the approaches that we want to take with that is that we have this idea of deep linking. If you’re using the Neo4j Desktop for instance, which is how Neo4j Bloom is delivered today, that desktop will be able to respond to URLs that will pull up Neo4j Desktop. If you’ve asked for Neo4j Bloom, Neo4j Bloom will come up, and then the rest of the world could actually pass through parameters like a search query to Bloom.
You could actually be in Slack, have somebody pop in a Bloom query and click on it. There’ll be some permissions checks. We don’t just automatically run stuff, but then have Bloom find parts of the graph. You could have that in any kind of a Slack channel, have it in messages, in WhatsApp, any other ways of communicating and actually use that as a way of actually helping other people find stuff that you might have found in the graph.
The last one that I’ll mention here is customer perspective.

You could take all of this. It’s useful for different departments within the organization. It’s also useful for your end customers. If you have your end customers and want to give them access to the graph as well, they are able to ask if they happen to be on some iMessage integration or something. You could pass any of the questions they’ve asked on to Bloom and you could ask questions about products and categories that they’re in.
You could ask again, “Tell me what beverages go with pavlova?” If you’re just in Neo4j Bloom itself, you would type that in, we’d do the auto completion. You go figure out, okay, let’s find pavlova, let’s find the things that people buy when they buy pavlova, our beverages, and let’s show that graph.
Here are all the beverages.
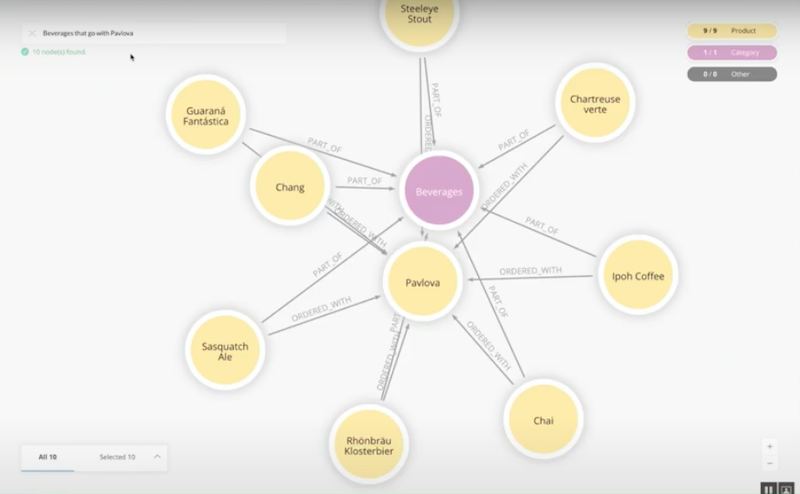
There’s some lovely Chartreuse Verte, some Ipo Coffee. These things sound like they’re fantastic with pavlova. Steeleye Stout, that’s probably the best choice to go with the pavlova.
This is the kind of thing that you could eventually embed onto your website. Neo4j Bloom, as we deliver today, is part of Neo4j Enterprise. It gets delivered on Neo4j Desktop, it’s an application that you add. It’s what we’re calling graph apps. It’s one of a growing list of apps that are available inside of Neo4j Desktop, but that’s the first place that we’re starting. We want to be able to make Bloom available anywhere that you want to use it.
That means, in addition to the full capabilities of Bloom, when it’s inside of Desktop having a reduced set of capability. If a scene that you’ve captured has a constraint in a particular perspective, like the customer’s perspective, you want to be able to give customers externally access to Neo4j Bloom’s features. You should be able to take this, embed it inside of an iframe and put it inside of your website with the little search box and have just that small part of the application available to you.
They wouldn’t get the card view, they wouldn’t be able to define a new perspective, or to do editing. However, it would deliver some nice value on an external website.
Goals with Neo4j Bloom

Our goal with Neo4j Bloom is that everyone who’s got data inside of the graph should be able to access that graph, whether or not they are comfortable with writing any kind of Cypher. If they’ve got a friend who writes Cypher, then they could do even more fun things.
Importantly, anybody should be able to search, explore and anybody with the correct rights should be able to edit the graph. When you’ve got Neo4j Enterprise plus Neo4j Bloom together, you have almost everything you need to work with graphs.
Beyond that, you can build custom applications that would then make Bloom integratable, embeddable and take that forward into your own application as well.
That’s Neo4j Bloom today. It’s a graph application for everyday graph uses.
Ready to learn more about graph data visualizations? Check out the On-Demand Webinar Neo4j Bloom: Data Visualization for Everyone.
Watch the Webinar Now
Watch the Webinar Now


