


Insurance fraud attracts sophisticated criminal rings who are often very effective in circumventing fraud detection measures. Once again, graph databases can be a powerful tool in combating collusive fraud.
In this series on fraud detection, we’re going to take a closer look at how graph databases help detect and mitigate three types of fraud:
- First-party bank fraud
- Insurance fraud
- E-commerce fraud
A Typical Insurance Fraud Scenario
In a typical hard fraud scenario, rings of fraudsters work together to stage fake accidents and claim soft tissue injuries. These fake accidents never really happen. They are “paper collisions,” complete with fake drivers, fake passengers, fake pedestrians and even fake witnesses.
Because soft tissue injuries are easy to falsify, difficult to validate and expensive to treat, they are a favorite among fraudsters, who have even developed a term for them: “whiplash for cash.”
Such rings normally include a number of roles:
- Providers. Collusions typically involve participation from professionals in several categories:
- Doctors, who diagnose false injuries
- Lawyers, who file fraudulent claims
- Body shops, which misrepresent damage to cars
- Participants. These are the people involved in the (false) accident, and normally include:
- Drivers
- Passengers
- Pedestrians
- Witnesses
Clever usage of roles can generate a large number of costly fake accidents, even with a small number of participants.
In the scenario depicted in the graphic below, a six-person collusion results in three false accidents. Each person plays the role of “driver” once and “passenger” twice. Assuming an average claim of $20K per injured person, and $5K per car, the ring can claim $390K in total.
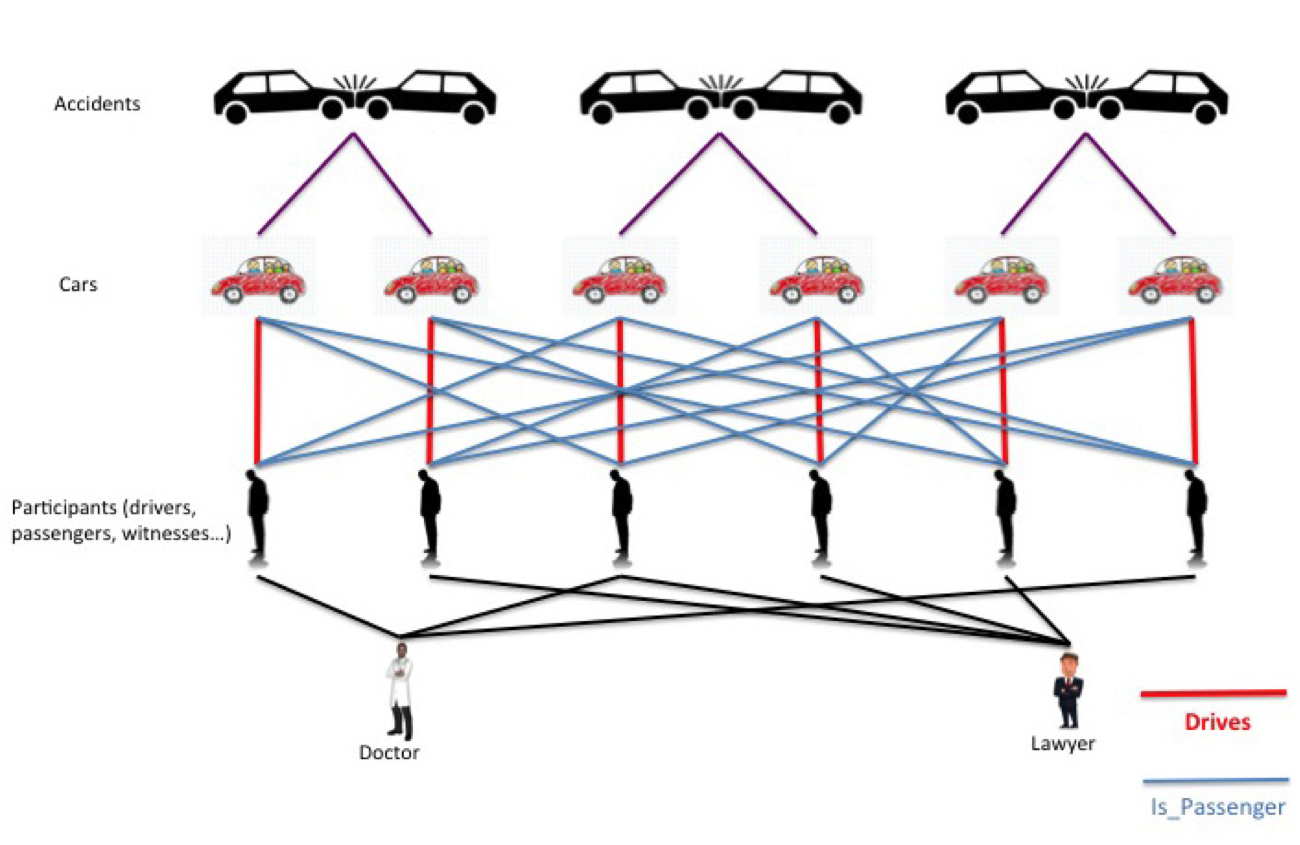
A simple six-person insurance fraud ring
As in last week’s first-party bank fraud example, the complexity and scale of such schemes can quickly soar. In an example where ten people collude to commit insurance fraud, five false accidents are staged, where each person plays the role of the driver once, a witness once and a passenger three times. Assuming an average claim of $40K per injured person and $5K per car, the ring can claim up to $1.6M for 40 people injured!This example is depicted in the graph below:

A 10-person insurance fraud ring depicted as a graph
Detecting the Crime
As with bank fraud detection, a layered approach has emerged as a best practice for detecting insurance fraud. While existing analysis techniques are sufficient for catching certain fraud scenarios, sophisticated criminals often elude these methods by collaborating.
Criminal rings are very skilled at concealing collusion, and inventing and staging complex “paper collisions” that do not arouse suspicion.
The next frontier in insurance fraud detection is to use social network analysis to uncover these rings. Connected analysis is capable of revealing relationships between people who are otherwise acting like perfect strangers.
How Graph Databases Can Help
The problem: Social network analysis tends not to be a strength of relational databases. Discovering the ring requires joining a number of tables in a complex schema, including:
- Accidents
- Vehicles
- Owners
- Drivers
- Passengers
- Pedestrians
- Witnesses
- Providers
On the other hand, finding fraud rings with a graph database becomes a simple question of walking the graph. Because graph databases are designed to query intricate connected networks, they can be used to identify fraud rings in a fairly straightforward fashion.
The graph below depicts how the above scenario might be modeled in a graph database:

A graph representation of insurance fraud
In this case, graph database queries can be added to the insurance company’s standard checks, at appropriate points in time – such as when the claim is filed – to flag suspected fraud rings in real time.And when your fraud detection team can flag fraud before it happens, the bottom-line impact is enormous.
Want to learn more about how graph databases improve fraud detection? Download this white paper, Fraud Detection: Discovering Connections with Graph Databases.
Catch up with the rest of the fraud detection series:


