Using Neo4j as an IoT data store on Raspberry Pi class hardware [Community Post]

Guest Contributor
3 min read

[As community content, this post reflects the views and opinions of the particular author and does not necessarily reflect the official stance of Neo4j.]
Last weekend a big wind and rain storm rolled through northwestern Oregon where I live.
Normally I don’t pay much attention to the barometer, but I was writing this blog post and noticed one of my Internet Things had captured the onset of the storm in the early morning hours of Saturday the 29th of August, 2015.
Here’s what it looked like:

Below is another snapshot of data from the day after the storm. In the summer, when the air conditioner kicks on, I see sawtooth patterns like this as the AC drives the temperature down and then it drifts slowly upward.
The Thing that captured this data is several rooms distant from the thermostat that controls the AC and I think this somehow explains the descending pattern of peaks and valleys in the late afternoon.

All of the data used to generate these charts was captured and stored in Neo4j running on Raspberry Pi 2 and similar (ARM7) hardware in my house.
My new IoT project: fold
A little over a year ago, I met Michael Hunger at OSCON 2014 and chatted about my IoT experiments with Neo4j. He encouraged me to write a guest post on the Neo4j blog. Now, after a complete rewrite of my IoT hub software, I am finally writing this post. 🙂

My new project, fold, is meant to explore an IoT counter-trend which I call “LAN-centric IoT.”
The primary trend (in my estimation) is Cloud-centric IoT, where devices are managed by cloud services. LAN-centric IoT assumes a handful of Raspberry Pis on a LAN can act as a sort of home-scale cloud, keeping most of the networking and data local.
The charts above and the graph visualization below were generated on the Raspberry Pi class machines (by fold invoking gnuplot and graphviz sub-processes) instead of passing the data to something like Google charts (a great service, but Cloud-centric).
How fold uses time trees to organize IoT data
I recently joined several Neo4j Slack groups and noticed a discussion about time trees. Fold uses a variant of the time tree to organize IoT sensor data as well as other events relevant to the Thing running fold.
The diagram below shows how fold maps time from years down to minutes. Nodes representing sensor data events link to the minute they happened in. The sensor data nodes store an event time in milliseconds, which allows for showing the order of events that occurred in the same minute.

Fold is very alpha-quality at this point since it’s a hobby project that I work on as time permits and as Things accumulate in my house.
I think other Neo4j users might be interested in fold if you are exploring IoT (got rPi2?) and especially if you know Java and Eclipse. It is easy to extend fold by creating a plugin with the fold channel extension-point.
I will watch the #share-your-project Slack channel and try to answer questions anyone has about fold.
Want to learn more about how to harness Neo4j for the Internet of Things? Click below to get your free copy of Six Essential Skills for Mastering the Internet of Connected Things and discover why it’s really the Internet of Connected Things.
Share Article


Explore
Related Articles

A workbench for teams to query, explore, and visualize graph data
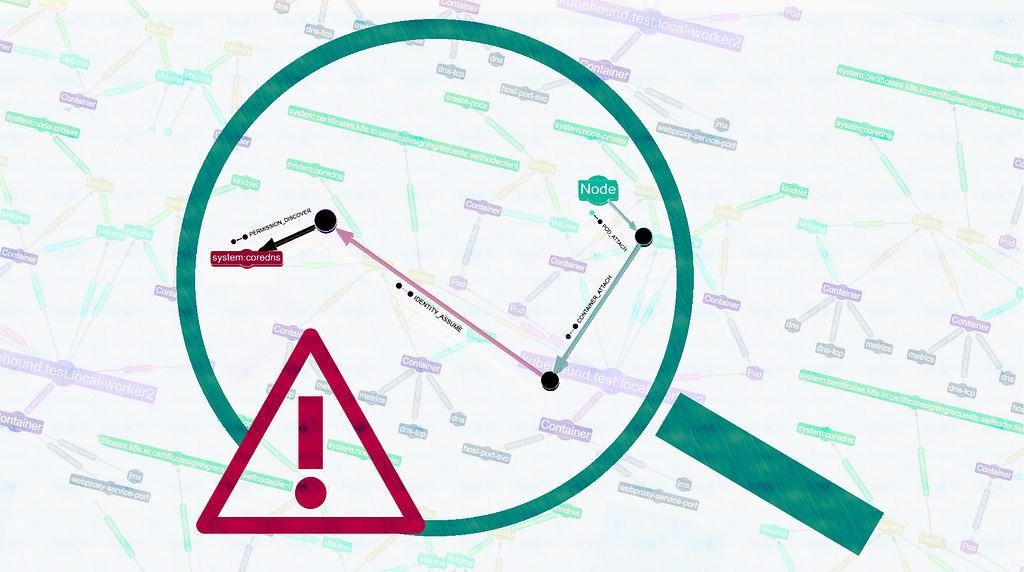
Bolster your cybersecurity by visualizing attack graphs with Neo4j & G.V()


15 best graph visualization tools for your Neo4j graph database
