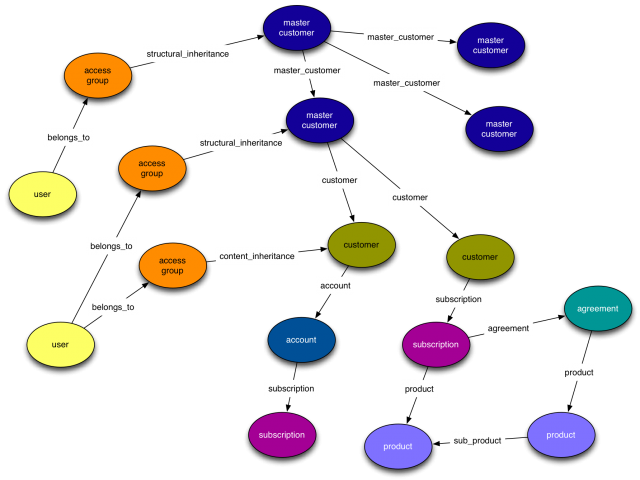
In AllThingsD.com, Emil Eifrem, CEO, Neo Technology writes about how graph databases are tackling the complexity of big data with semi-structured and highly connected data.
Faced with the need to generate ever-greater insight and end-user value, some of the world’s most innovative companies — Google, Facebook, Twitter, Adobe and American Express among them — have turned to graph technologies to tackle the complexity at the heart of their data. To understand how graphs address data complexity, we need first to understand the nature of the complexity itself. In practical terms, data gets more complex as it gets bigger, more semi-structured, and more densely connected. We all know about big data. The volume of net new data being created each year is growing exponentially — a trend that is set to continue for the foreseeable future. But increased volume isn’t the only force we have to contend with today: On top of this staggering growth in the volume of data, we are also seeing an increase in both the amount of semi-structure and the degree of connectedness present in that data.
Semi-Structure
Semi-structured data is messy data: data that doesn’t fit into a uniform, one-size-fits-all, rigid relational schema. It is characterized by the presence of sparse tables and lots of null checking logic — all of it necessary to produce a solution that is fast enough and flexible enough to deal with the vagaries of real world data. Increased semi-structure, then, is another force with which we have to contend, besides increased data volume. As data volumes grow, we trade insight for uniformity; the more data we gather about a group of entities, the more that data is likely to be semi-structured.Connectedness
But insight and end-user value do not simply result from ramping up volume and variation in our data. Many of the more important questions we want to ask of our data require us to understand how things are connected. Insight depends on us understanding the relationships between entities — and often, the quality of those relationships. Here are some examples, taken from different domains, of the kinds of important questions we ask of our data:- Which friends and colleagues do we have in common?
- What’s the quickest route between two stations on the metro?
- What do you recommend I buy based on my previous purchases?
- Which products, services and subscriptions do I have permission to access and modify? Conversely, given this particular subscription, who can modify or cancel it?
- What’s the most efficient means of delivering a parcel from A to B?
- Who has been fraudulently claiming benefits?
- Who owns all the debt? Who is most at risk of poisoning the financial markets?
Keywords: Adobe • Big Data • communications • Connected Data • Deutsche Telekom • Semi-Structured Data • Telco • Telenor • Viadeo