


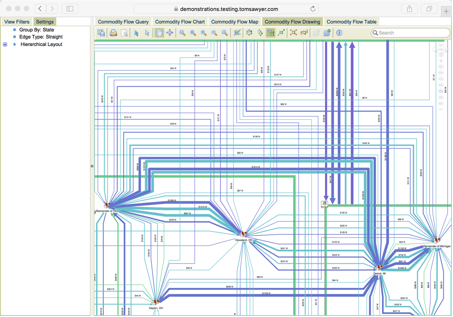
Figure 1. Commodity Flow Visualization Grouped by U.S. State
What Does It Show?
This graph and data visualization application is created with Tom Sawyer Perspectives. It displays information pulled from a subset of data from the United States Census Bureau, and was imported into a Neo4j graph database. The application presents the flow of commodities within the United States in a variety of unique views of data that allow for an exploration of commodity routes.
The house nodes denote cities or areas within a state. The edges indicate the commodity flow routes, and the route values are shown as labels rotated along the edges. Route values represent the value of goods being transported. Edge thickness is contingent upon these values, meaning thin edges have a lower economic value, and thick edges have a higher economic value. Boxes encapsulating certain areas and cities indicate that the data has been grouped by state.
The drawing utilizes orthogonal layout – one of several layout styles available with Tom Sawyer Perspectives. Based on the information you are trying to visualize, you may find that other layout styles are also suitable to visualize your data. These layout styles include circular, hierarchical, and symmetrical. Generally, for flow-oriented information, hierarchical layout would be the most appropriate choice.
Nodes can be collapsed to present an aggregated visualization of the relationships between selected the states and the values of the commodities rolled up as inputs and outputs of each state.
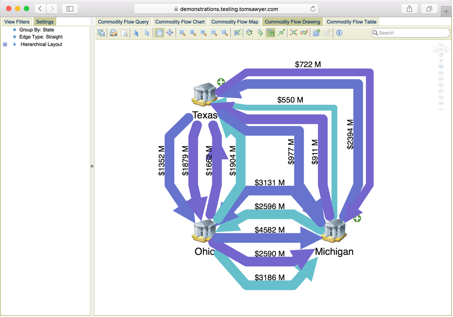
Figure 2. Commodity Flow Visualization with Collapsed State Nodes
How Was It Built?
This application was built with Tom Sawyer Perspectives, advanced graphics-based software for building graph and data visualization and analysis applications. In this application, the census data was migrated into a Neo4j database.
Tom Sawyer Perspectives supports federated data integration with update and commit facilities. In addition to Neo4j, these data integrators include REST, JSON, XML, Text, SQL, Excel and RDF. Using these integrators, you can bind dispersed data stored in various data sources to an in-memory data model, and then write rules and expression to express what you would like to see in each view of that data.
What Can It Do? What’s so Special about It?
The beauty of Tom Sawyer Perspectives is that it can display your data with multiple high-quality view types. This gives the user the ability to fully comprehend, display and explain massive amounts of data in the most simplistic, yet advanced, manner possible today.
Through the application’s Commodity Flow Query view, you have the ability to tailor your Neo4j Cypher query based on specific cities, states or rural areas within a state, along with the commodities you would like to investigate. If you need to analyze information for only certain areas within a state, cities and rural areas can simply be deselected in the Tree view, and they are filtered out of the drawing or map.
Additional filtering is available through the View Filters tab in the Tree view that allows you to explore various weight and value ranges for each commodity. The Settings tab offers the option of choosing the flow direction, edge type and routing style for even greater customization.
A Map view displays the routes on a geographic map, marked by map pins and edges. The Map view distinguishes the areas commodities are traveling through, how much weight is being carried, and the flow values associated with the commodities. Clicking on an edge or pin gives more details about the commodity route. Depending on your view preferences, fewer routes can be shown on the map by deselecting items in the View Filters tab of the Tree view.
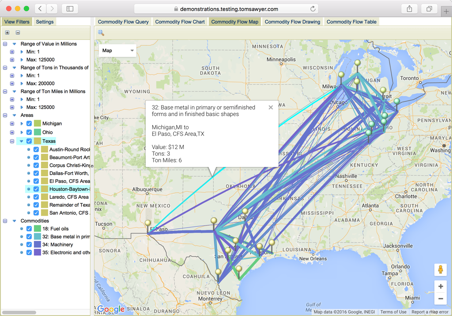
Figure 3. Commodity Flow Map Marked with Commodity Routes
In addition, a Chart view presents a concise summary of imports and exports based on your query. The information is presented in a clear bar chart format, useful for quickly comparing and contrasting which regions have the most or least imports and exports.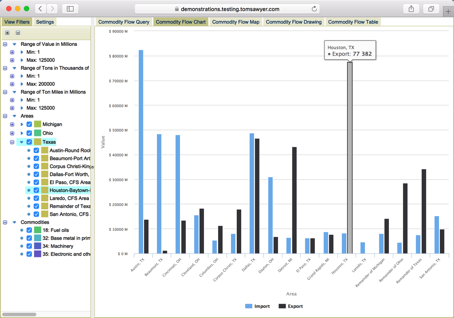
Figure 4. Commodity Flow Chart View Showing Imports and Exports
Tom Sawyer Perspectives breaks down vast amounts of industry data to provide maximum user comprehension and analytical insight.To try a demonstration of Tom Sawyer Perspectives, click here.
Tom Sawyer Software is a Gold Sponsor of GraphConnect Europe. Click below to register for GraphConnect and meet Emel and the rest of the Tom Sawyer team in London on 26 April 2016.


