Trekking boldly into the future: GoingWhoKnows where in the graph space

Chief Scientist, Neo4j
23 min read

Editor’s Note: Last October at GraphConnect San Francisco, Jim Webber – Chief Scientist at Neo Technology – delivered this very sciency closing keynote on the graph database landscape.
For more videos from GraphConnect SF and to register for GraphConnect Europe, check out graphconnect.com.
We’re going to talk about the future of where we’re going in the graph space. It’s going mainstream, and it’s becoming a really popular space to be.
This is partially closing keynote and partially my own catharsis. I can’t really afford therapy: You’re it.
I’ve got three things I want to grumble about to you and see if we can set a reasonable course through the interesting and emerging graph space.

First, we’re going to look at what it means to have graphs in a single model in a Neo4j-style database or do you do the multi-model and polyglot-style database?
Next, we’re going to look at what it means to do online transaction processing versus analytics and how that plays out in the graph space.
Finally, we’re going to talk about that native versus non-native stuff. I think that’s very, very interesting computer science going on there. It also happens to be the stuff that my team is working on over in the Old World.
Single Vs. Multi-Model Databases
Let’s start with the single, multi-model stuff.
Anyone ever heard of Unix? There’s a thing that underpins Unix; there’s a philosophy that I think is quite appealing to those of us in engineering and development.
It is: Do one thing and do it well.

Unix tools are all optimized to do one thing and do it well and then from that fundamental foundation, you can then build sophisticated workloads by chaining those tools together.
I rather like the idea of doing one thing well.
Neo4j does graphs; that’s what we do. We don’t try to be all singing, all dancing, all things to all people. We do graphs and we do it well. That’s what we’ve strived to do over the years, and it’s what we’re going to strive to do in the coming years.
But that’s not necessarily the only point of view.
You may say that some things that you have aren’t graphy. Maybe you think you need other data kits to deal with those. Maybe you want a mixture of technologies or need a single technology that can handle graphy and non-graphy data. Maybe.
Let’s see what happens when we play this forward.
Every data model is a graph model
In terms of whether to go with a single model or multi-model database technology, I would say this: Graphs are such a flexible model, they’re a model that can tolerate – or indeed, embrace – many, many different domains and data. They’re probably all you need.

You’ve got a document problem? Sure, but documents are just trees and trees are just simple graphs.
You’ve got shopping lists or maybe you’ve got a shopping basket that you want to turn into retail trends. Lists are graphs.
Train lines are graphs. Your lovely road network with this bridge over here is part of a large graph.
Spreadsheets are graphs. Now that is really, really weird because spreadsheets are the archetypal square. It’s a grid, not a graph, Webber.
Except, no: Even spreadsheets are graphs. Of course, we have relationships around neighboring cells in a spreadsheet, but where spreadsheets get very graphy is when you start using functions to refer to other cells in that spreadsheet.
In fact, Felienne Hermans, who is a professor from the Netherlands, will actually take your spreadsheet and will decompose it into a Neo4j graph and tell you where all the bugs are. Thus, even boring, square spreadsheets are graphs.
It is my thesis that practically anything can be modeled conveniently as a graph – and queried efficiently in Neo4j.
Graphs Aren’t Multi-Model – They’re Super-Model
I’ve seen a lot of vendor hype going on out there about multi-model databases.
I’ve been thinking though: Given that the most common data structures I work with are effectively a one-or-another variance of graphs, why would I get excited about tools that claim to do multi-model? Graphs already do multi-model.
Even things you might traditionally associate with more specialized databases – things like range queries and so on – don’t require a multi-model approach. With Neo4j 2.3 you do range queries, but that’s not the be-all and end-all of it because these range queries tend to be jumping off points for even more sophisticated graph analysis.
The graph, it turns out, is the supermodel.
Anything you need to do in a document, anything you need to do in a list or a tree, anything you need to do in a spreadsheet – you can already do in a graph.
So why would you bother going through the hassle of artificially separating out these domains and fighting some kind of multi-model problem when actually – in the real world – once you strip out all of the vendor bullshit most of the data you’re working with is conveniently a graph?
Why would you bother going to all of that trouble when it’s already performant and lovely for you?
End of rant one.
Online and Analytics
There are typically two kinds of workloads that we throw at our data processing infrastructure:
- Things that we want to do rapidly in response to some user activity, such as in between a web request and a web response.
- Things where we want to gain insight into a larger set of data, perhaps something that we’re prepared to run at many seconds, minutes, hours or days of latency.
In the past, when you did this kind of stuff…

…you usually end up building a cube per query.
So when it comes to analysis, what you end up doing in the “ye olde world” of grandad’s technology is doing some crafty ETL jobs. You build a cube per query, and you try and predict upfront which dimensions you’re going to need to roll into your cube to aggregate, and it’s all a little bit guesswork and pseudoscience. Eventually, you’ve got a big expensive warehouse that you’re terribly nervous of.
The correct response to seeing one of those OLAP cubes is:

Definitely the correct response. Why? What do you do with those things?
We think about OLAP as cubes because that’s the way the technology has driven us. We think about OLAP and analytics being kind of intermingled but they’re not.
The goal of analytics is to gain insight – not to build cubes. The goal is to gain insight into data so that we do something actionable on it, whether we are gaining insight into data reactively or whether we’re looking at data predictively, such as in predictive analytics.
Why graphs are perfect for analytics
These analytic workloads are very straightforward in a graph.
All your dimensions already exist in a graph. Graphs are naturally n-dimensional structures.
When you do analytics on Neo4j, your dimensions are given to you by relationship types and labels and so forth, and you don’t have some weird-ass cube to deal with.
It turns out graph theory is tremendously good for both reactive and predictive analytics.
Despite Emil having written a really nice book about graph databases, the best book on the planet, bar none, about graphs is Networks, Crowds and Markets by Easley and Kleinberg. In that book, they describe how to tame graphs to do sophisticated analyses using the almost 300 years of graph theory we have at our disposal to gain amazing insight.
A crash course in graph theory & World War I
I’m going to give you a crash course in graph theory.
Graphs love triangles. It’s really weird. Graph theoreticians have a really posh name for this: “triadic closure.”
A stable triadic closure is where I’ve got two sides of the triangle and the graph wants to close the third side. In some cases, it’s three positive sentiments. Another way of creating a stable triangle is to have two negative sentiments and one positive.
Knowing this, you can now start to do some really sophisticated predictive graph analyses, simply by iterating over your graph, making these triangles.
Believe me? Let me give you a historical example where we already know the outcome. This is the great houses of Europe around 1850.

In this graph, the black relationships tell us allies and the red relationships tell us enemies. You can see that Europe was already a fairly fractious place 150-odd years ago.
Now, graph theory doesn’t know anything about the great houses of Europe. It doesn’t know anything about history. All graph theory knows is that it wants to make stable triangles.
So let’s roll this forward and iterate over this. Immediately, we bring Italy in.

It forms a stable triangle with Austria and Germany. See that? They’re all friends.
Then what happens over here is France and Russia dissolve their longstanding aggravation and actually they do this:

This new relationship between Russia and France is weird. The graph hates this. Anyway, after the Russians and the French gang up, this happened:

This is awkward for two reasons.
First, there’s a famous historical document that described this new alliance, it’s called the Entente Cordiale. My French isn’t actually very good but I do know the translation of Entente Cordiale. It’s like, “England, please stop beating us up.” That’s what it loosely translates as – awkward.
Secondly and seriously, the graph does not like this unstable triangle between Russia, France and the UK.
The graph wants to eliminate that edge between Russia and the UK. So, finally Russia and the UK become friends. You iterate over the graph, just making these low-energy, stable triadic closures and you end up here:

This is a low-energy graph. There is nothing else that the graph wants to change. All of these are stable triadic closures.
Not knowing anything about World War I, graph theory just predicted the starting lineup for World War I.
But you can also apply this to your domain.
You can apply this to figuring out what people are going to buy next. You can apply this to figuring out insurance underwriting and risk. You can apply this to a whole range of things.
Graph theory isn’t perfect, but it’s a decent way of having a future view of how your world will be.
The point here is there’s nothing special about this. Once your data is in a graph, this is just more graph analytics. No scary OLAP cube, no ETL magic required.
When you’re doing this in graphs, there’s no cubes to build. You just use the graph that you already have running on your servers. You’ve just got your graph and the algorithm that you want to run against it.
The graph that you’re using to serve OLTP queries to your web property, is the same graph that you’re running these deep analytic queries on.
The proper role of offline analytics
However, at some point you do run up to a limit. When you’re doing some really large jobs you want to be able to bring data out of the database and compute across it, which is great.
What Emil talked about earlier with Cypher running on Spark means that you’ve got a really unified API to the whole graph universe. Your compute engine speaks Cypher, your database speaks Cypher.
This enables a kind of virtuous cycle where you project some sub-graph out of the database via query, you crunch it through your processing layer and then you drop the results of that back into the graph. It’s a continuous cycle of enrichment.
So, in this case, what you’ve got is something a bit like this (below) where your app can speak Cypher to Spark or your app can speak Cypher to Neo4j.

You’ve got this unified view of your underlying graph be it compute or be it storage and query. But in the future, I think there is an exciting opportunity to do this:

I think there is an opportunity for some Cypher query planner or some other middleware to intervene on your behalf and try to figure out when it should dispatch to the database (like Neo4j) for a database query and when it should dispatch to a compute engine (like Spark) to crunch over those graphs in parallel.
I’m not saying that the Neo4j team will build this tomorrow, but to me, this is an obvious next step.
Native vs. Non-Native Graphs
My final gripe. Native versus non-native.
My colleague, Max De Marzi, just wrote a stunningly good blog post about performance, and particularly, he took umbrage with vendor benchmarks. He said it’s funny that when a vendor writes a benchmark their stuff always comes out on top. That’s the TL;DR. It’s true.
That kind of got me thinking.
We know how fast Neo4j is. Ian Robinson and his team are always beating Neo4j to death and seeing how fast it can go. But fundamentally what struck me was Max happened to take umbrage with a database that was not graph native, but that claimed to be a zillion times faster at everything.
This got me thinking about the differences between native and non-native databases. Even before we get into fancy things around like cluster architecture and so on, there are some fundamental differences between a native and a non-native graph database and it comes down to cost of access.
Native vs. non-native use of indexes
In a native graph, like Neo4j, most of the operations that you are doing in order to traverse the graph are cheap. They are in constant time. All Neo4j does is chase pointers around a data structure in order to traverse the graph and that’s super cheap to do.
On my laptop I can kind of spin up some vendor bullshit benchmark and I can show that my laptop will do 14 million traversals a second which is some laptop, a nice laptop but it’s just a laptop.
If I were not a native graph database yet I wanted to fake a graph API to the user, what do I actually do when it comes to fast traversals? Well, typically I’m going to use indexes to fake this. The thing is with indexes, they’re not cheap.
Back in 2010, Marko Rodriguez and Peter Neubauer coined this term, index-free adjacency.
It means that when you’re at a node, and you’re looking to traverse to a neighboring node there’s no global index lookup there. The node itself, because of its connectivity, kind of acts like a mini-index and because of that, we can do these super cheap traversals.
In Neo4j, we do have some index lookups but they tend to be few and far between. Index lookups tend to be for finding a starting point in the graph, and once you’ve found a starting point, it executes the constant-cost operation of index-free adjacency until you reach your informational goals.
But if you’re faking it, you’re doing all of this stuff in indexes.
Indexes aren’t bad things, but you have to understand that the algorithmic cost of accessing an index is log, and if you have to do an index lookup for every hop through your graph that means overall you’ve got n (log n) complexity.
That has nothing to do with implementation details, however. It’s a choice that you’ve made when you built non-native kit.
You’re going to fake the relationships by doing index lookups. And by the way, if you want to traverse both ways, you’re going to need two sets of indexes and that has an impact on your write performance as well.
If you’ve got an n (log n) cost for your graph traversals, you will lose out to any native database which can do this in one step period. Computer science wins out.

By computer science, I decree that native technology wins out over non-native.
What about distributed systems?
But what about when we’re going to cluster these things? Because eventually we want to put this stuff into production, and we want to do some clustering.
There’s a really interesting thing going on in distributed systems. There is a significant tension between having a system which is available and having a system which is reliable.
Available means that even in the presence of faults, the system will be able to accept reads and writes. It doesn’t mean that you’ll get the correct answer from the system. It just means that it will be available for reads and writes.
Reliable is the property of a system where even in the presence of faults you give the correct answer and you can’t have both.
So back in the day, Fisher, Lynch and Patterson wrote their famous paper. It’s now called FLP, which demonstrated that you cannot have both. You can have availability or you can have reliability.
There are interesting design trade-offs when you’re clustering. A lot of the other NoSQL databases are definitely towards the availability end of the spectrum.
But the thing is, in the graph world things are a bit more difficult. We need consistency in the graph world. If you’re using graphs and you allow for bidirectional traversal, you actually need to have consistency of two.
Consistency of two is hard. It’s not like just twice as hard as consistency of one. It’s like a million harder. So you’ve got to be able to keep two sets of replicas in sync and if you don’t, bad things happen.
You might say, “There are already databases out there that are doing both availability and reliability and surely they must work.” No, I’m afraid they don’t. They will lose your data.
The honest ones actually write it on their webpage how they will corrupt your data under normal operations, and I salute them for being honest but you can’t use them safely.
Introducing Neo4j Core-Edge
Which brings us to what is Neo4j doing about the trade-off of reliability and availability? Fair question, good friends, fair question.
Ian Robinson and I wrote a book with a guy called Savas Parastatidis called REST in Practice. It was a pretty interesting topic to be involved with, and we got to think about why the web scales.
So why does the web scale the way it does? The web scales because it federates load through the network.
It’s not about having 10,000 machines serving one million concurrent users because that’s not web scale. That’s exactly 100 scale.
So, how do we take our influence of the web philosophy and direct that towards building better ways of making native graph clusters?
What Emil didn’t announce earlier is that from Neo4j 3.0 onwards, we have a web-like clustering protocol where we have an architecture that the engineers call core-edge, where we have a relatively small number of machines in the core of your network.

These core machines can be geographically distributed or co-located, and they’re like the data citadel. They keep it safe. They don’t serve stale data – they are reliable.
In fact, these core machines are coordinated by a protocol called RAFT.
In that call, we’ve got a model whereby when you commit a transaction to Neo4j, that transaction is guaranteed safe and replicated. When you’ve got an act back that transaction cannot be destroyed other than by an act of God wiping out your whole data center and all of your backups.
However, federating that load outwards like the web does, we have a bunch of machines that we call edge machines because they live at the edge of the network. These machines are caches, but they’re not just like dumb, memcache-style caches.
These are fully functioning Neo4j instances, which means you could run graph queries on them and you can put them locally or you can spread them around the world or you can do whatever you like.
We’ve got this notion now where we can federate load out through the network. The keystone of this is RAFT. RAFT means your data is safe. Those core machines are provably safe. The RAFT guys have done a brilliant job with that protocol. I love RAFT.
When you look at RAFT, the protocol itself is humane. That’s an important thing. The understandability of RAFT means there are very few places for bugs to hide and bugs in distributed systems are difficult.
Once you commit, your data is now safe. If you can’t trust a database to keep your data safe, you have no business putting your data in that database.
You don’t poke your fingers in unknown holes and then not expect to have them come back bitten by some critter. Databases are the same. You can trust us with your data. Your data is important – your businesses run on it. The very least we can do is not corrupt it and not lose it.
These edge machines though, they seem to be eventually consistent with respect to the core and didn’t I just say that was a bad thing? Well, that’s not the case.
In Neo4j 3.0, we will also give you the ability to read your own writes, which is a really nice way of reasoning about your data. So suddenly you can write things into the core, and you can read your writes from an edge at some point.
The way that we plan to do that is using the Neo4j Bolt Protocol, which happens to be a fork of MessagePack that’s just twice as fast.
Looking for inspiration from the web, we’re going to support something like HTTP’s “etags” so that when you do a read, you’ll be able to set to X transaction level or greater. And if the transaction hasn’t percolated over to you yet, you just get paused for a moment until that happens.
This gives you the ability to do things like write core and then read edge, which is nice because the ability to read your own writes makes reasoning about your use of the database really straightforward.
That means you can write stuff and then you’ll see it. I can’t tell you how bloody hard that is in distributed systems. Using etags we can do it on the web, and using the equivalent of etags we can do it inside the database cluster.
But Neo4j can actually go further. You can even choose linearizability in this cluster, which is practically the Holy Grail for databases. With Neo4j 3.0, you choose your level of consistency when you query the database.

Neo4j 3.0 allows you to read from any machine, including from any edge. It also allows you to read your own writes (RYOW) from core or edge. You can even read the leader.
There’s a role in RAFT called “leader” which tends to be the most up-to-date instance. Or indeed, you can even choose to perform linearizability by getting you to query a quorum of the core machines.
Yes, once you do that, it’s relatively expensive, but in those cases where you absolutely, positively need linearizability, you’ve got it. That’s pretty sweet.
And we’re going to RAFT all the things.

We are not going to give you a choice on the write channel, however.
On the read channel you’re going to get to choose your consistency. Most of the time you’ll probably pick conservative consistency levels.
On the write channel, you don’t get to pick. We are going to RAFT all the things on the write channel because RAFT keeps your data safe.
Once your data is committed around the cluster, it is safe and in Neo4j it also means durable on disk. So if we suffer partial failures, we just bounce back from that. You guys don’t get to turn that off. That’s our prerogative.
In conclusion
So where are we then, ladies and gentlemen?
Graphs are the supermodel. They already do all of those things you’re thinking about doing. If you think about doing documents, it’s a graph. If you’re thinking about doing trees, it’s a graph. If you’re thinking about doing hierarchies, it’s a graph. If you’re thinking about doing this, it’s a graph.
It’s like Admiral Ackbar – it’s a graph!

I don’t care what Gartner says. Graphs are the big game and multi-model is a distraction.
If you want to do polyglot persistence, great. There are databases that do one thing and one thing well. Glue them together. It’s the 21st century.
Cypher on Spark is also game changing. You’ve now got a uniform graph API to the two fundamental pillars of the data ecosystem: To Neo4j, your storage and query graph; and to Spark, your graph compute.
That’s going to be such an exciting place to live in the future graph space.
Finally, once you’ve got a safe RAFT, you can start to build amazing super-powered clusters.
Neo4j itself is going to continue to evolve, and we are going to continue to evolve faster. You will have to come to GraphConnect Europe, and I’ll tell you all about it then.
Inspired by Jim’s talk? Register for GraphConnect Europe on April 26, 2016 at for more industry-leading presentations and workshops on the evolving world of graph database technology.
Share Article


Explore
Related Articles

A workbench for teams to query, explore, and visualize graph data

1 of 3: The difference between a graph, a knowledge graph, and a context graph

2 of 3: Why graphs, knowledge graphs, and context graphs matter to customers
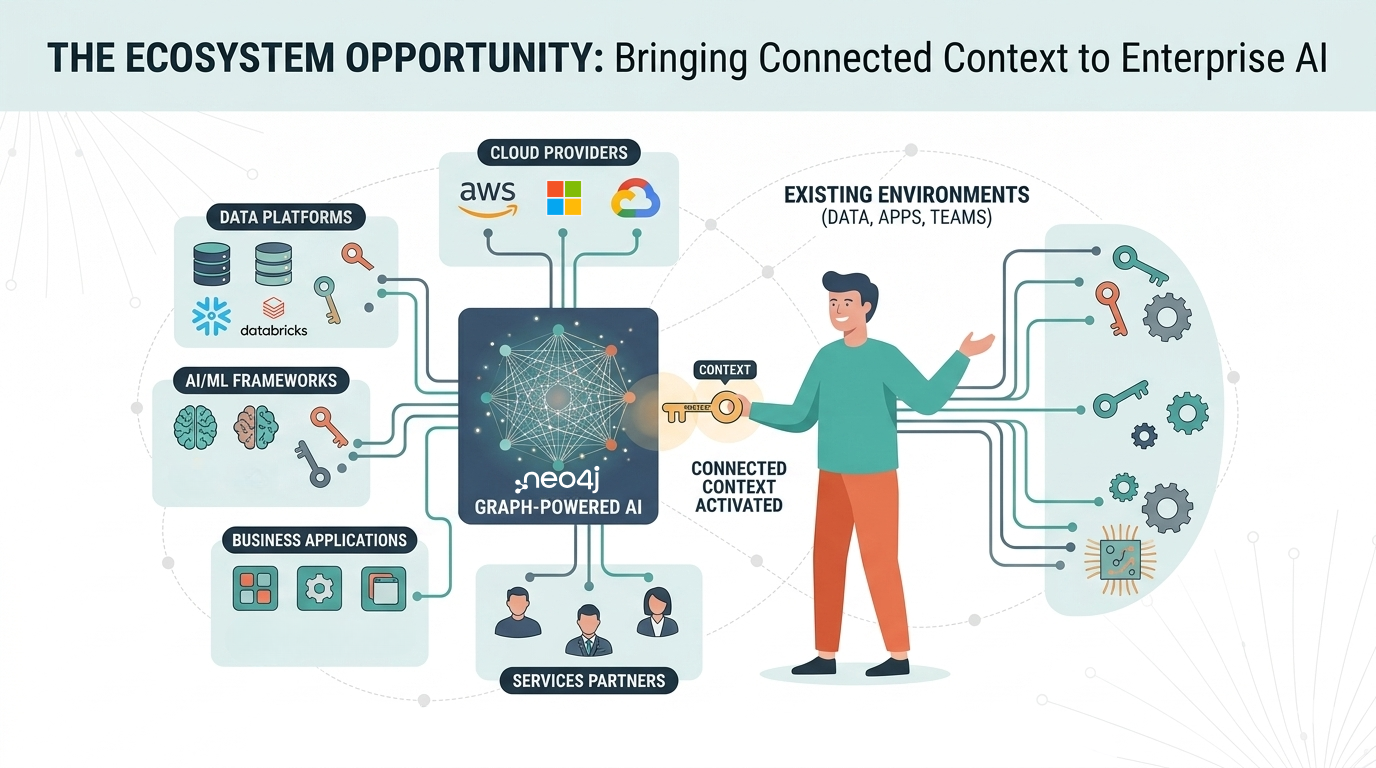
3 of 3: The graph ecosystem: Bringing connected context to enterprise AI
Digital twins that learn: connected asset intelligence with Neo4j and Databricks