


For more videos from GraphConnect SF and to register for GraphConnect Europe, check out graphconnect.com.
My role is to explain why I think there are signs that your data – and maybe not just your data, but your data stories – are telling you that you have graphs. And not only are graphs everywhere; they’re eating the world, and your data knows that.
I tweet a lot and do some other things on social media because part of my advocacy as a data chick is to make sure everyone loves their data. I think one of the ways in which we love our data is by making sure we’re providing the right homes for it, and that we’re providing the right tools and techniques for it.
In case you just got off a plane with no Wi-Fi (in other words, you flew Air Canada because we don’t have Wi-Fi on Air Canada) you know what today is, right? It’s Back to the Future day.
One of the things that Emil already covered was the parallel between where we are with graph databases and processing now versus where we were when relational databases were becoming new.
Have any of you lived through the discovery or invention of relational databases?
Just earlier today, I thought about how graphs are changing the world.
We learned about how graph databases are influencing world leaders. I think they’re going to change the world in some way – not just because they’re graphs, but because I think data is going to change the world.
Monsanto told us about a new circle of life that involves genotypes –and how they are going to change the world – along with some really important problems surrounding feeding people and taking care of each other.
Then we heard about how being able to discover, derive and visually see the connections between data allows investigative journalists to more effectively share data, because they can do so in a format that is easier to consume than a bunch of strictly-formatted spreadsheets. This makes it easier for non-technical people to understand the data.
We also heard about food traceability and how Lending Club put together a MacGyver-like package of microservices.
Finally, we heard about how even though we’re overwhelmed with documents, we can find the metadata and tags in those documents using graph technology, which increases their searchability while omitting search results that don’t apply.
Any one of these things could be directly changing the world, or they could be providing the tools for you and your organization to change the world.
Hierarchies in the Real World Are Actually Graphs
So, why graphs?
I have some kind of snarky and potentially contentious opinions that explain why thinking about graphs is important.
I think that no matter how many people are big fans of hierarchal taxonomies or applying structure to the world – based on my decades of experience playing with data – there really aren’t a lot of true hierarchies.
And by true hierarchies I mean a tree hierarchy, in which something has exactly one parent. Those don’t really exist, and we spend a lot of time developing systems or designing databases where we want to pretend that our data is a hierarchy.
We think HR org charts and product catalogs are hierarchies, but by trying to enforce a hierarchical view of the world on our data, we actually make it harder on ourselves.
Here’s an example of a typical hierarchy.
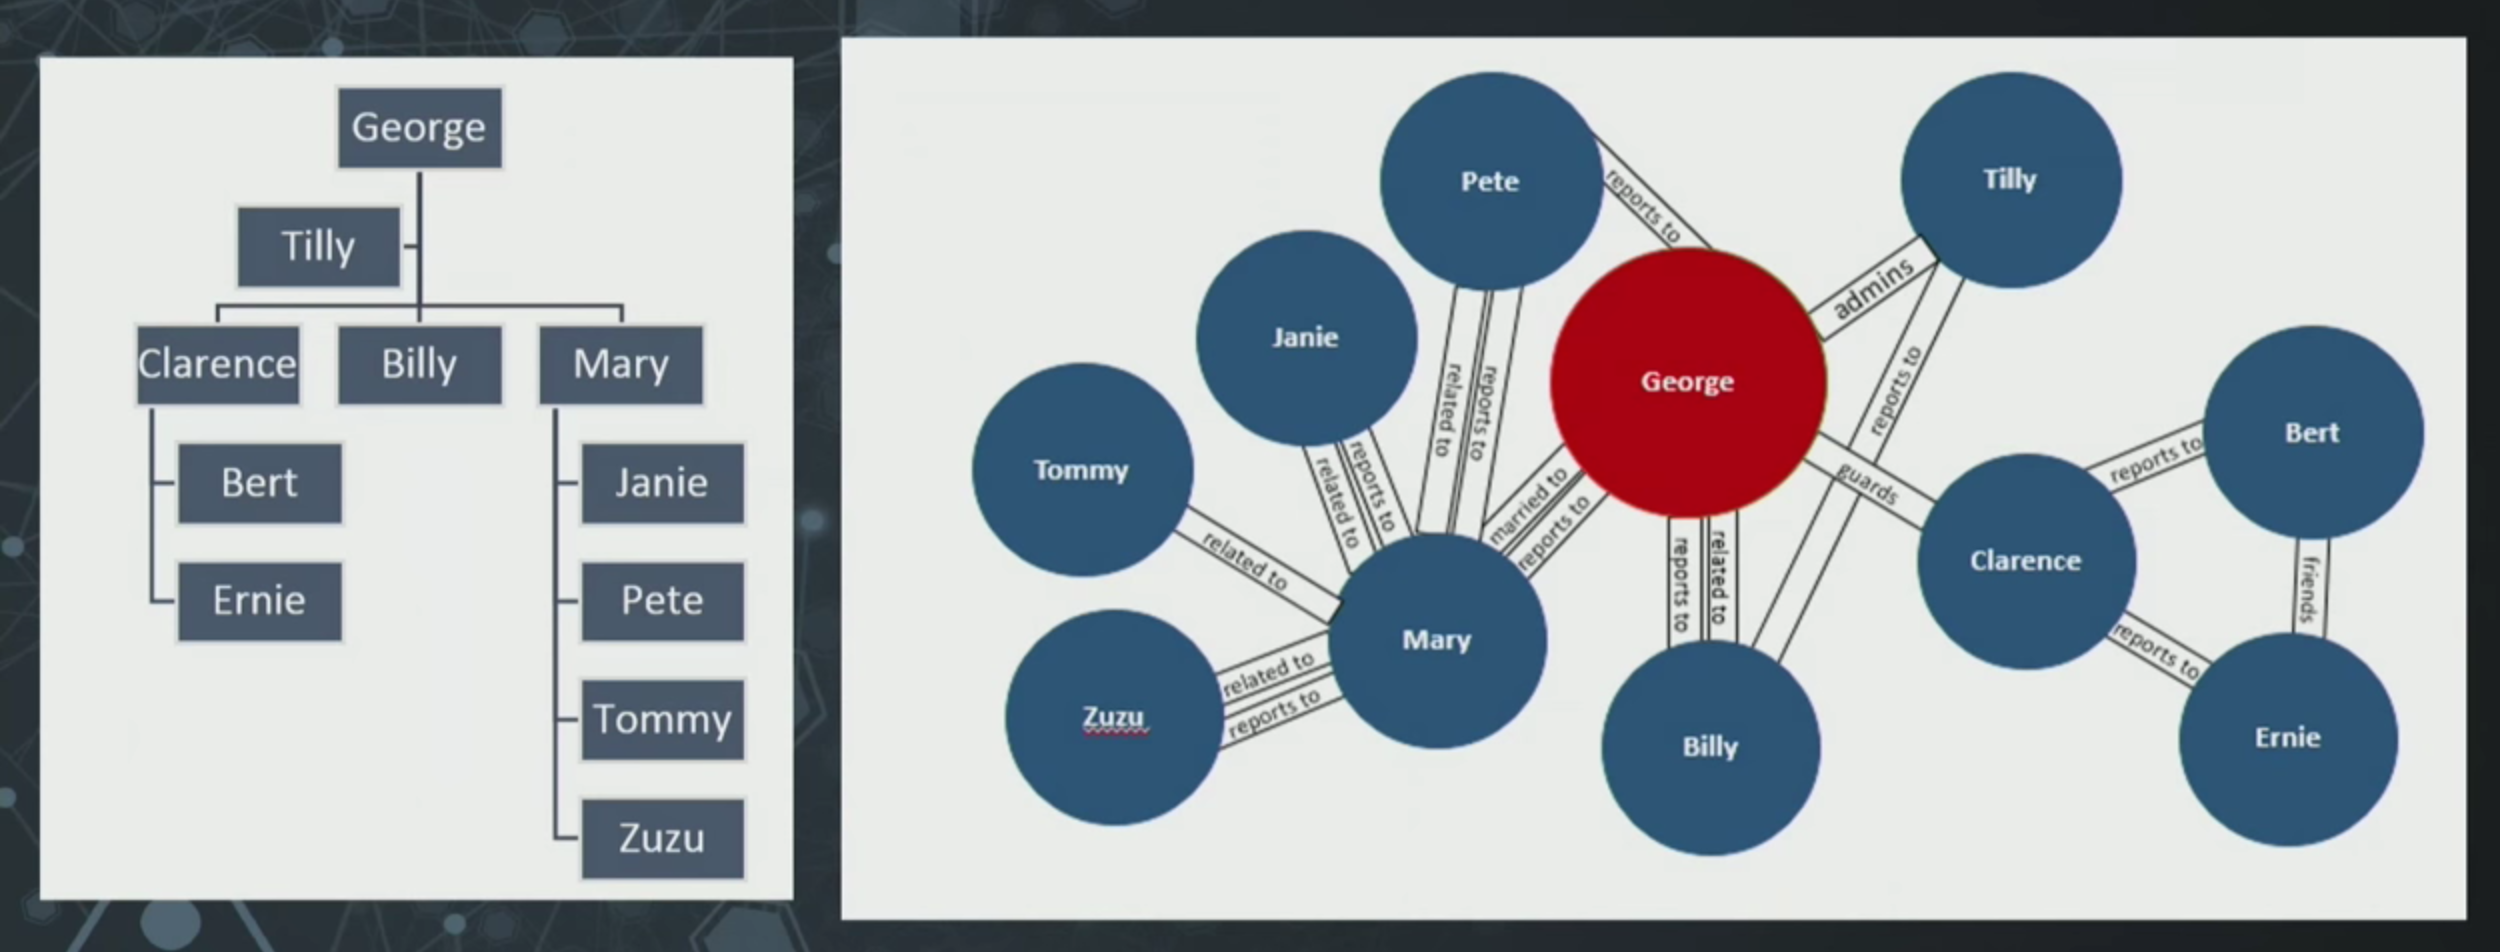
Let’s say you have a friendly bank in Bedford Falls, and you own a savings and loan (S&L) and people report to you. That’s all fine and dandy until you realize that the people who report to you have other relationships to you as well.
You can see a hierarchy on the left, and a greater hierarchy on the right that shows not only that people are reporting to each other, but they’re married to each other, or related to each other, or report to you directly or act as a supervisor.
We try to put all of our data about people into hierarchies and people just do not cooperate with that. You’ve probably found the same to be true of your data.
The same thing is true for items, products, departments, parts and facilities. We try to put structure in our world, and we try to do that through the data in our solutions. And we end up suffering because there is always a “dotted line” in the reporting structure.
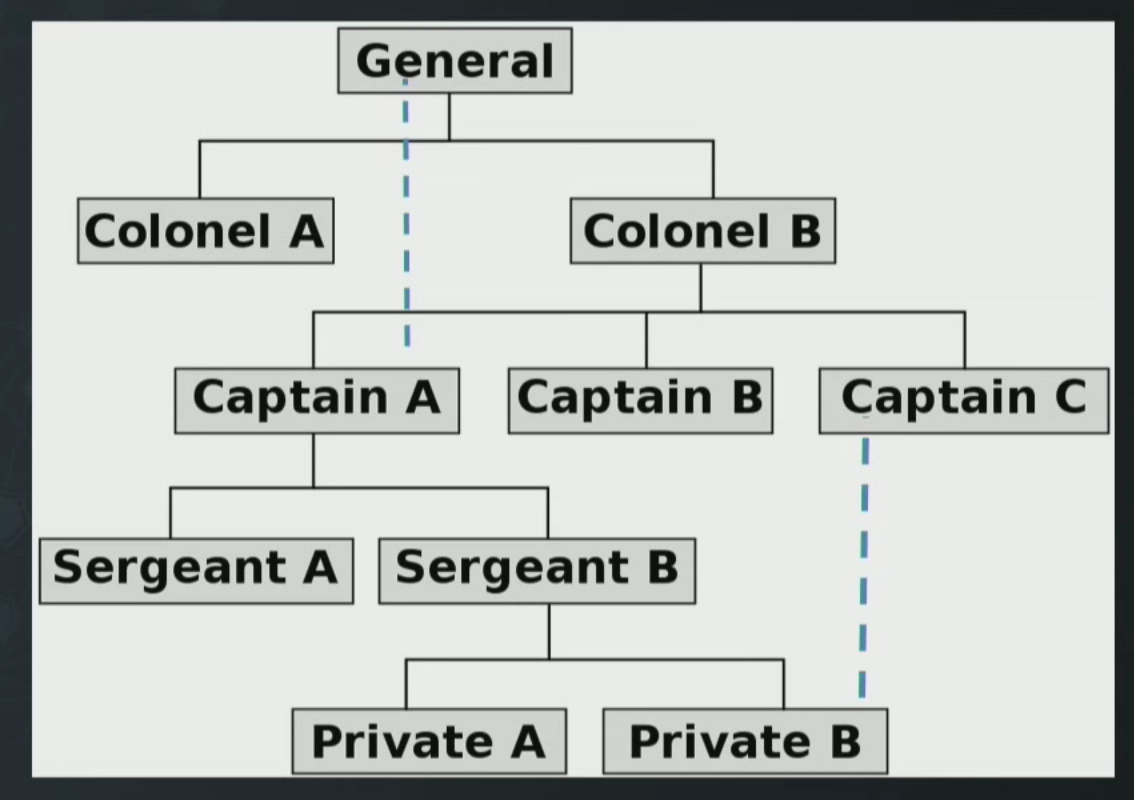
Then people give you business rules, such as “You can only hold one job position at a time,” and yet we end up having people shadowing other people or overlapping other people – it happens all the time.
Then you go back to your ERP or package vendor and say, “But we actually need five people filling this position. Two people are primaries and the rest are secondaries, but we don’t know what to call everybody else.” And they say, “It doesn’t work that way, because you can only have one person in a position.”
Modeling Data Hierarchies with a Relational Database
In the relational world, we struggle with these concepts. I work with relational databases, and I work with a transactional system.
If we put together a flag football team right now I’d be on Team Relational. That’s what I do with most of my life. I’m an SQL server MVP. I’m a data modeler. I do ERDs all day.
I’m telling you, I dream in data models that are highly relational but that doesn’t mean I think relational database systems are the solution to everything.
Here would be a typical way that someone might set up that purely hierarchal reporting structure in a table.

We’d have employees, employee names, and employee titles which point back to their one parent. This is how I was taught to do it, but then we have the problem that people can report to more than one person, and what do you do with the person at the top? Well, there are workarounds for that.
You might create a dummy record, or you might have the CEO reporting to the CEO. We do these tricks with our data even when we think the data is hierarchal.
Even the purely hierarchical implementation has issues. In the relational world, it would be a recursive relationship to say that employees report to employees; except we just learned that employees have multiple relationships to each other.
There are probably a hundred other relationships between employees and other people. So we end up with these highly recursive, self-referential joins (heaven forbid that word) just like we do in a relational database.
Another problem exists in the case of departmental hierarchies.
What happens if we add a new level of middle managers, or we remove one manager, or we need to move half the people from one manager to another? We can do all of this in a relational database. There are blog posts, scripts and tools about how to do it, and yet – it’s messy when we try to do it this way.
Tricking a Relational Database
We have tricks in the relational world for dealing with both hierarchies – which I already told you don’t really exist – and these relationships between the same entity to other entities. We might have special data types.
In the SQL server world there is an actual data type called hierarchy ID, which is designed to store a path of all hierarchies for entities that are related to each other. It’s really fun to play with, and it does all these tricks with hierarchal data.
The only problem with it is it performs only in very simple structures and not at a real-world scale. That’s because it’s doing a trick in the relational database.
We can set up adjacency lists, put in a column that does path enumerations, and create closure tables that do path analysis and nested sets. If you’ve ever implemented any of these tricks in the relational world, you probably had to write a lengthy documentation to explain how they work.
They work, but the reason we have to implement them is because of the underlying foundational assumptions of relational databases – that data is optimized for write, and that the data follows a very strict structure.
That’s not a failing. If you go to a NoSQL conference, people will tell you that it’s a feature and it’s the reason we build things in relational databases. The data story for well-fit data deserves to be in relational databases.
The Problem of Data Relationships in Relational Databases
Having said that, we have this other problem dealing with highly flexible and very important data relationships. Not just with foreign key constraint – and we implement those things, as I said, as a relational database – but we find out that this hierarchy really isn’t a hierarchy.
It’s really closer to a network or materials-type structure. That means that we don’t go build a special relationship in a relational database. Instead, we create another table that’s an associative entity to take care of our many-to-many relationship between employees. We stuff it full of data, and we’re all good.
Except now we’ve introduced a whole other set of problems for dealing with this many-to-many relationship. I won’t go into all of those problems here; they’re just a tradeoff. But it means that we transform something that was really a relationship into a table – a data item – and we treat it just like any other data item.
Because of this, we have to do all kinds of special processing and querying, and address a number of anomalies that we could accidently introduce by implementing certain workarounds.
All Data Is Suffering
One of my key observations, with apologies to the Buddha, is that all data is suffering.

What does that mean? I’m not an expert in this, but my general understanding about this noble truth is that we suffer. Suffer just means to deal with, stress about or have a pain point with.
More generally, we suffer when we try to fit things in our world into a belief system or structure that doesn’t really apply and over which we have no control. That’s stretching the truth a little bit, but basically we, our data and our business users suffer because we’re trying to force some data queries into a world in which it was never designed to be.
One of the key points when dealing with a graph and graph data is that in the relational world, foreign key relationships aren’t relationships at all. Remember, the relational database got its name because the tables are relations, not because of the lines between boxes or the circles in our graph diagram.
The tables are constraints. They are actually the seatbelts we put on our data to keep it from going out of control. They are not the relationships that our business users talk about or that we think about in our lives. That’s why in the relational world, we have to create them and put them in a table.
The other drawback of relational databases is that we can’t assign properties, tags or labels to relationships. We can give them a name in the database, but no one sees those.
The important thing about graphs is that we’ve put the priority on the relationships just as high – or higher – than the nodes in the graph database. Additionally, relational databases don’t scale well when we’re doing these relationship-like queries or understandings.
Relational databases aren’t about relationships; they’re about things that have constraints between them for data integrity.
I think this is the most misunderstood difference between why we say certain data – or more importantly, certain questions – are a better fit for the graph. People want to use an “either/or” approach: Which do you think is better, a graph database or a relational database?
That’s not a question I can answer, because to answer it effectively, I need to know what question we’re trying to answer.
The relational database focuses on tables, and the graph database focuses on relationships. Certain business questions are really more about the relationships, whether it’s discovering them or documenting them. It’s a classic tradeoff.
7 Ways Your Data Is Telling You It’s a Graph
So why do I think that your data is telling you it’s a graph?
#7. Its Name
Network, tree, taxonomy, ancestry, structure – if people are using those words to talk about an organizational chart or reporting structure, they’re telling you that data and the relationships between that data are important.
#6. You Are Using Tricks to Make It Feel Graph-y
We’ve all heard about developers trying to implement data in a relational database and then putting a layer on top of it to make it look or feel graphy. That’s what we’ve all done with our relational structures.
It’s not really just relational, but also hierarchal structures. Remember, I’m experienced enough to have been pre-relational. We had hierarchal databases. We have hierarchal structures in other database formats like XML, JSON and others.
#5. Your Software Vendors Are Telling You it can’t Be Done
That’s usually because they’ve designed something in a way that assumes a non-graph database or graph processing stance, and they are now trying to add a layer after the fact or onto a commercial product, which is just not easy to do.
#4. Your Questions Are Path-y
It’s more common to say we need a graph database and processing because our questions are graphy, not so much because our data is. Data can be graphy, especially the structural stuff, but the important things are the questions we want to ask of the data.
When you learn about query languages in general, because it’s a demo or presentation, you see really simple relational query things like, “Show me all the orders and their order lines.” It’s a great way to learn a structured query language or about relational databases, but those aren’t the hard questions we’re asking of our data these days.
We’re asking the forensic or the antifraud ones, which ask, “How many times did someone who knew this person three levels out ever visit this postal station and ship a box from this location to this country?” We can actually track that data and answer it in a non-graph database, but it’s going to be very expensive and it’s going to take a long time to run.
There’s also a good likelihood that we’ll have to come up with a completely separate solution to do that, which is designed specifically for that question in order to optimize getting those answers, which is usually an issue of budget or additional skills.
I think we have done a lousy job as analysts and architects about asking our business users, “What are your more advanced questions?” We don’t ask that as we’re building transactional systems because one, we’re afraid of the answer, and two, because we might not be able to provide what they need.
That’s because all data suffers if we only have a relational database. It’s not just an eightfold path in your data; it could be over hundreds or thousands of paths or nodes.
#3. Your IT team Says “It’s Going to Be Slow”
Or they might say, “It’s going to impact other systems,” or “We need to build a data warehouse,” or “I don’t think we can answer that one.” It might be a sign that what you really need is the right tool.
#2. You Aren’t Allowed to Ask Your Data Certain Questions
#1. You Do a Proof of Concept in Neo4j and it Just Works
This is the number one.
I hear it over and over again: “We built a proof of concept, but it wasn’t our old-school proof of concept where we put a rapid prototyping thing together and did some coding in .NET. We actually built a proof of concept in Neo4j with an underlying data model and visualizations.”
You’re able to prove that your data or queries are graphs just by doing that proof of concept.
When to Use Graph Databases
We’ve all heard a number of case studies that highlight the situations in which graph databases work best. Here are just a few:
Recursion:
Anytime there’s any question of recursion, you need to use a graph database. Recursion is when things are related to the same type of thing going on for an infinite number of relationships, and they produce a very ragged set of answers.
For example, graph databases work well in social media, where one person might have three followers and the next person might have 100 million followers. It also works with the “Kevin Bacon” problem and organizations related to organizations.
Master Data Management:
Most people don’t think of master data management as a graph issue, but it is. Product lines, product configurations and customers are always graph questions.
Network and IT Operations:
The ultimate graphs are IT systems, which I work with every day. This includes assets, identity, bill of materials, who’s using what, where it’s located – all of those things.
Real-time Recommendations:
Not just recommendation engines, but finding out that we have dots that are connected and don’t even realize it. A lot of the competitive advantage stories I hear are about being able to ask your data questions and knowing where graph databases can answer those questions.
Forensics and Fraud:
This is the most exciting because it allows you to track behavioral patterns – how do people act and when are they not acting like they used to? Changes in behavior can either indicate something fraudulent, or it could just be someone walking through a retail store.
Resource Optimization:
This is where IT professionals can offer organizations monetary savings and risk mitigation by answering: What’s the shortest path to get there? Where are things? Where are the hot spots, the servers that are being underutilized, the people who are overscheduled?
Promotions Building:
Graph databases can also be used for building retail promotions that will lead to more purchases and renewals. Or they can be used for targeted offers and things you haven’t even thought of offering.
Data Modeling and Graphs
I told you I was a data modeler. One of the things I like about graphs is that there’s not this logical and physical separation. There’s an underlying data model, and the physical graph you build is both the data model and the database.
We can do whiteboard data modeling where we draw circles with nouns in them and add relationships between them. And it’s accessible to people from all levels –business people, C-level people, managers and other IT people.
Here’s another contentious idea: Our traditional entity-relationship data models still have a role. It doesn’t mean we’ll be generating graph databases out of them. But in some companies, there are decades of understanding about our current data – what it looks like, what the exceptions are, its properties and its labels – and we can contribute that to a graph implementation.
How Data Relationships Drive Better Insights
The key to being able to do graph processing and run queries with almost no limitation is that you could just start at the customer level and keep going.
On a traditional relational project, you need to have a defined scope. If you have to develop something really expensive and agile, chances are this will end up at the back of the queue indefinitely.
Case Study: Polyvore
Polyvore allows young fashionistas to clip pictures from websites, along with their underlying metadata, and combine those pictures into one image they can share and that others can “like.”
It’s essentially crowdsourcing the compiling of outfits and special features along with metadata. This can inform a product vendor or manufacturer how an end user uses, buys and combines their products.
It also allows for social engagement through liking and commenting. It’s essentially someone putting together a virtual web store with a bunch of people’s products as if they owned all the stores in the world.
But the underlying relationships – products, metadata, what products people use, how products are used together, what people think of the new combinations – gives manufacturers and vendors the opportunity to interact with users in this space and write their own contests. That’s really exciting, and the added ability to mine the subsequent data has a lot of power.
A Note on Master Data Management
Master data is also a graph because I can ask important questions about customers, but I can also de-duplicate customer data based not only on syntax – like how a name is spelled and what phone numbers are associated with that name – but through the use of other patterns, such as the number and type of interactions.
Because you have this 360-degree view of data – you can now ask questions you couldn’t afford to ask before. but it’s not just data.
Getting Started with Graphs
Here are some tips for getting started with graphs:
- Read the O’Reilly Graph Databases book – it’s free to download
- Take the free online course on graph databases
- Learn about RDBMS-to-graph concepts and tools
- Install and play with Neo4j
- Have fun exploring GraphGists (it should not shock you that my second-favorite GraphGist is the one on Belgian Beer)
- My white paper on why your master data is a graph (I’m biased, but I still recommend it)
Then, help business users understand that there could be relationships in their data that aren’t currently documented in their relational databases. In the past, we’ve told them that relationships are just constraints, instead of reminding them that that data we have in different databases or in different tables still might have an essential relationship.
Discovering new insights into your own data gives your organization a competitive advantage based on data relationships in your existing data.
Being able to quantify the insights that you can take with existing data is the first step to helping an organization understand how to get more insights through new data, external data or new questions.
Inspired by Karen’s talk? Register for GraphConnect Europe on April 26, 2016 at for more industry-leading presentations and workshops on the evolving world of graph database technology.


