Graph Databases for Beginners: Data Modeling Pitfalls to Avoid

Editor-in-Chief, Neo4j
6 min read
With the advent of graph database technology, data modeling has become accessible to masses.
Mapping business needs into a well-defined structure for data storage and organization has made a sortie du temple (of sorts) from the realm of the well-educated few to the province of the proletariat. No longer the sole domain of senior DBAs and principal developers, anyone with a basic understanding of graphs can complete a rudimentary data model – from the CEO to the intern.
(This doesn’t mean we don’t still need expert data modelers. If you’re a data modeling vet, here’s your more advanced introduction to graph data modeling.)
Yet, with greater ease and accessibility comes an equal likelihood that data modeling design might go wrong. And if your data model is weak, your entire application will be too.
In this Graph Databases for Beginners blog series, I’ll take you through the basics of graph technology assuming you have little (or no) background in the space. In past weeks, we’ve covered why graph technology is the future, why connected data matters and how graph databases make data modeling easier than ever, especially for the uninitiated.
This week, we’ll discuss how to avoid the most common (and fatal) mistakes when completing your graph data model.
Example Data Model: Fraud Detection in Email Communications
graph database are highly expressive when it comes to data modeling for complex problems. But expressivity isn’t a guarantee that you’ll get your data model right on the first try. Even graph database experts make mistakes and beginners are bound to make even more.
Let’s dive into an example data model to witness the most common mistakes (and their consequences) so you don’t have to learn from the same errors in your own data model.
In this example, we’ll examine a fraud detection application that analyzes users’ email communications. This particular application is looking for rogue behavior and suspicious emailing patterns that might indicate illegal or unethical behavior.
We’re particularly looking for patterns from past wrongdoers, such as frequently using blind-copying (BCC) and using aliases to conduct fake “conversations” that mimic legitimate interactions. In order to catch this sort of unscrupulous behavior, we’ll need a graph data model that captures all the relevant elements and activities.
For our first attempt at the data model, we’ll map some users, their activities and their known aliases, including a relationship describing Alice as one of Bob’s known aliases. The result (below) is a star-shaped graph with Bob in the center.
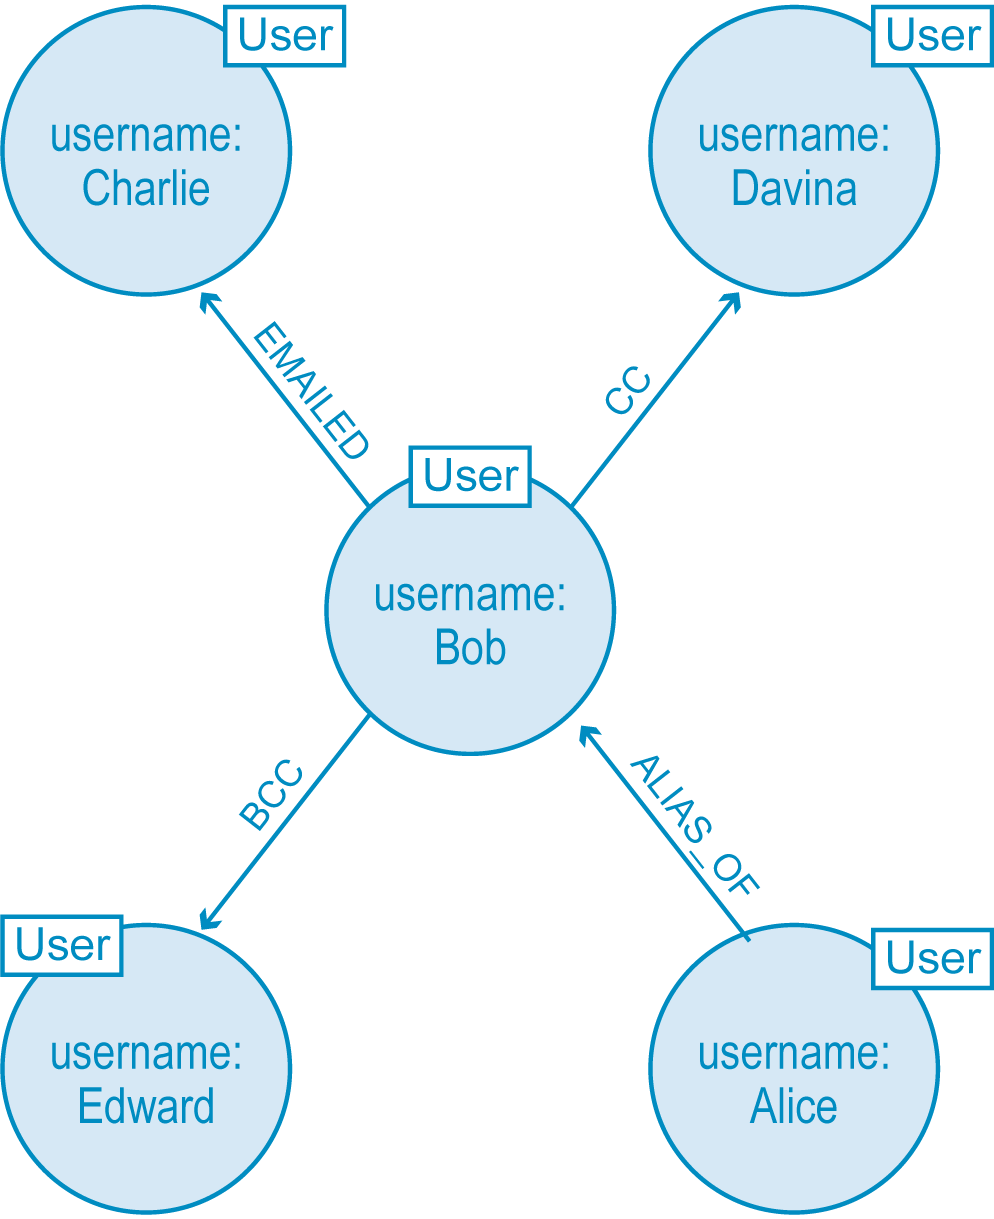
Our first data model attempting to map Bob’s suspicious email activity with Alice as a known alias. However, this data model isn’t robust enough to detect wrongful behavior.
At first blush, this initial data modeling attempt looks like an accurate representation of Bob’s email activity; after all, we easily see that Bob (an alias of Alice) emailed Charlie while BCC’ing Edward and CC’ing Davina. But we can’t see the most important part of all: the email itself.
A beginning data modeler might try to remedy the situation by adding properties to the EMAILED relationship, representing the email’s attributes as properties. However, that’s not a long-term solution. Even with properties attached to each EMAILED relationship, we wouldn’t be able to correlate connections between EMAILED, CC and BCC relationships – and those correlating relationships are exactly what we need for our fraud detection solution.
This is the perfect example of a common data modeling mistake. In everyday English, it’s easy and convenient to shorten the phrase “Bob sent an email to Charlie” to “Bob emailed Charlie.” This shortcut made us focus on the verb “emailed” rather than the email as an object itself. As a result, our incomplete model keeps us from the insights we’re looking for.
The Fix: A Stronger Fraud Detection Data Model
To fix our weak model, we need to add nodes to our graph model that represent each of the emails exchanged. Then, we need to add new relationships to track who wrote the email and to whom it was sent, CC’ed and BCC’ed.
The result is another star-shaped graph, but this time the email is at the center, allowing us to efficiently track its relationship to Bob and possibly some suspicious behavior.
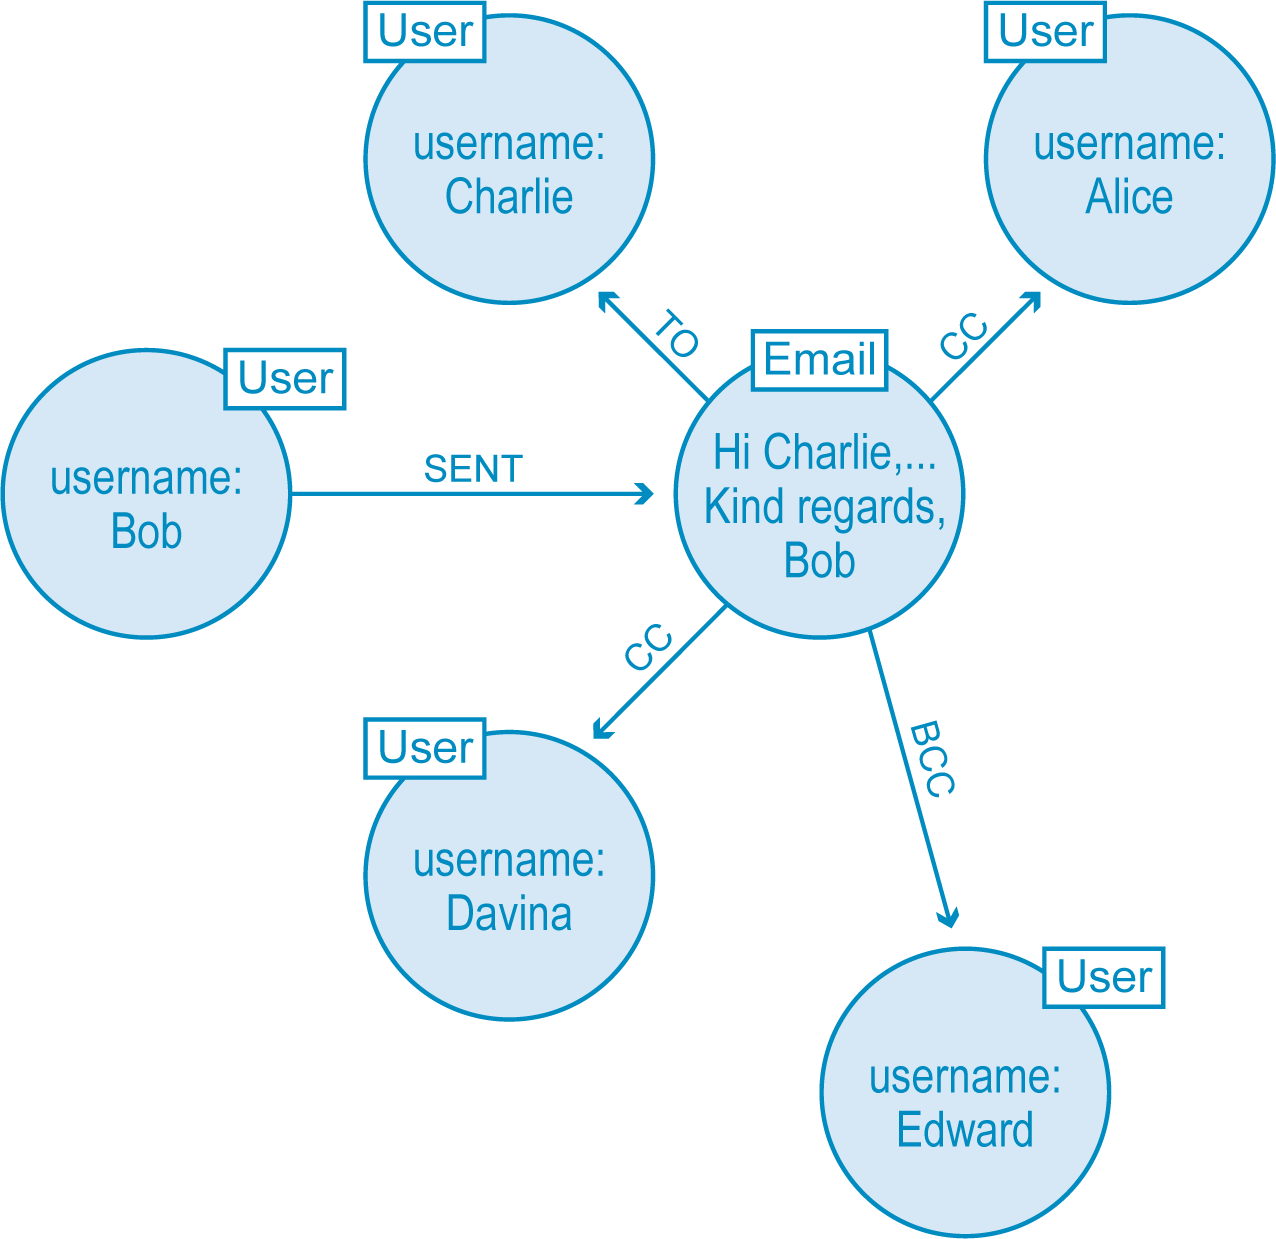
Our second attempt at a fraud detection data model. This iteration allows us to more easily trace the relationships of who is sending and receiving each email message.
Of course we aren’t interested in tracking just one email but many, each with its own web of interactions to explore. Over time, our email server logs more interactions, giving us something like the fraud detection graph below.

A graph data model showing many emails over time and their various relationships, including the sender and the direct, CC and BCC receivers.
The Next Step: Tracking Email Replies
At this point, our data model is more robust, but it isn’t complete.
We see who sent and received emails, and we see the content of the emails themselves. Nevertheless, we can’t track any replies or forwards of our given email communications. In the case of fraud or cybersecurity, we need to know if critical business information has been leaked or compromised.
To complete this upgrade, beginners might be tempted to simply add FORWARDED and REPLIED_TO relationships to our graph data model, like in the example below.

Our updated data model with FORWARDED and REPLIED_TO relationships in addition to the original TO relationship.
This approach, however, quickly proves inadequate. Much in the same way the EMAILED relationship didn’t give us the proper information, simply adding FORWARDED or REPLIED_TO relationships doesn’t give us the insights we’re really looking for.
To build a better data model, we need to consider the fundamentals of this particular domain. A reply to an email is both a new email and a reply to the original. The two roles of a reply are represented by attaching two labels – Email and Reply – to the appropriate node.
We then use the same TO, CC and BCC relationships to map whether the reply was sent to the original sender, all recipients or a subset of recipients. We also reference the original email with a REPLY_TO relationship.
The resulting graph data model is shown below.

Not only do we see who replied to Bob’s original email, but we also track replies-to-replies and replies-to-replies-to-replies, and so on to an arbitrary depth. If we’re trying to track a suspicious number of replies to known aliases, the above graph data model makes this extremely simple.
Homework: Data Modeling for Email Forwards
Equally important to tracking email replies is tracking email forwards, especially when it comes to leaked business information.
As a graph data modeling acolyte, your homework assignment is to document how you would model the forwarded email data, tracking the relationships with senders, direct recipients, CC’ed recipients, BCC’ed recipients and the original email.
Conclusion
Data modeling has been made much easier with the advent of graph technology. However, while it’s simpler than ever to translate your whiteboard model into a physical one, you need to ensure your data model is designed effectively for your particular use case.
There are no absolute rights or wrongs with graph data modeling, but you should avoid the pitfalls mentioned above in order to glean the most valuable insights from your data.
Catch up with the rest of the Graph Databases for Beginners series:
-
- Why Graph Technology Is the Future
- Why Connected Data Matters
- The Basics of Data Modeling
- Why a Database Query Language Matters
- Imperative vs. Declarative Query Languages: What’s the Difference?
- Graph Theory & Predictive Modeling
- Graph Search Algorithm Basics
- Why We Need NoSQL Databases
- ACID vs. BASE Explained
- A Tour of Aggregate Stores
- Other Graph Data Technologies
- Native vs. Non-Native Graph Technology
Share Article


Explore
Related Articles


Why Machines Need Embeddings: Turning Graph Structure into Features

Finding Hidden Bottlenecks in Flight Networks with Aura Graph Analytics on Databricks

Find Impactful Graph-Powered Insights in Databricks

The Persistence Tax: Why It’s Time to Let Your Graph Analytics Sleep