
The Basics of Data Modeling

Editor-in-Chief, Neo4j
8 min read

For six-ish months of my life, I was a database developer.
Starting out, the first thing I learned was data modeling. Our team was using a relational database (RDBMS), specifically MySQL (we later switched to Postgres). Like a lot of backend developers at the time, we didn’t intentionally choose to use an RDBMS, it was just the default (that’s no longer the case).
Of course, that meant my lessons in data modeling would follow the relational data model – and not to spoil the ending – but it sucked.
This isn’t to say that the RDBMS model is always bad (it isn’t) or that it always sucks (it doesn’t). But when it’s used as the one-size-fits-all data model for every project and application under the sun, well, there’s going to be a lot of mismatch.
The good news: The relational model doesn’t have to be your default.
Other data models exist, and they are awesome. Today, we’re going to take a closer look at one in particular – the graph data model – and walk you through a better first-time data modeling experience than I originally had.
In this Graph Databases for Beginners blog series, I’ll take you through the basics of graph technology assuming you have little (or no) background in the space. In past weeks, we’ve covered why graph technology is the future and why connected data matters.
This week, we’ll discuss the basics of data modeling for graph technology.
(Psst! If you’re already a data modeling vet, check out this article on how to deploy your seasoned skills to a graph database model.)
What Is Data Modeling Exactly?
Data is like water. It’s probably useless if you don’t put it in a helpful container. The shape, size and functionality of that container depends on your intended use, but in general, a container is necessary.
The same goes with data. When it comes to creating a new application or data solution, you need to provide a structure for that data. That structuring process is known as data modeling.
Often reserved solely for senior database administrators (DBAs) or principal developers, data modeling is sometimes presented as an esoteric art unknownable to mere mortals. You may worship the expert data modeler from afar.
While some data modeling scenarios really are best left up to the experts, it doesn’t have to be difficult by default. In fact, data modeling is as much a business concern as a technological one. So if you don’t know a single line of code, you’re in luck.
Anyone can do basic data modeling, and with the advent of graph database technology, matching your data to a coherent model is easier than ever.
A Brief Overview of the Data Modeling Process
Data modeling is an abstraction process. You start with your business and user needs (i.e., what you want your application to do). Then, in the modeling process you map those needs into a structure for storing and organizing your data. Sounds simple, right?
With traditional database management systems, modeling is far from simple.
After whiteboarding your initial ideas, a relational database requires you to create a logical model and then force that structure into a tabular, physical model. By the time you have a working database, it looks nothing like your original whiteboard sketch (making it difficult to tell whether it’s meeting user needs).
On the other hand, modeling your data for graph technology couldn’t be simpler. Imagine what your whiteboard structure looks like. Probably a collection of circles and boxes connected by arrows and lines, right?
Here’s the kicker: That model you drew is already a graph. Creating a graph database from there is just a matter of running a few lines of code.
Relational vs. Graph Data Modeling: A Match-Up
Let’s dive into an example.
In this data center management domain (pictured below), several data centers support a few applications using infrastructure like virtual machines and load balancers.
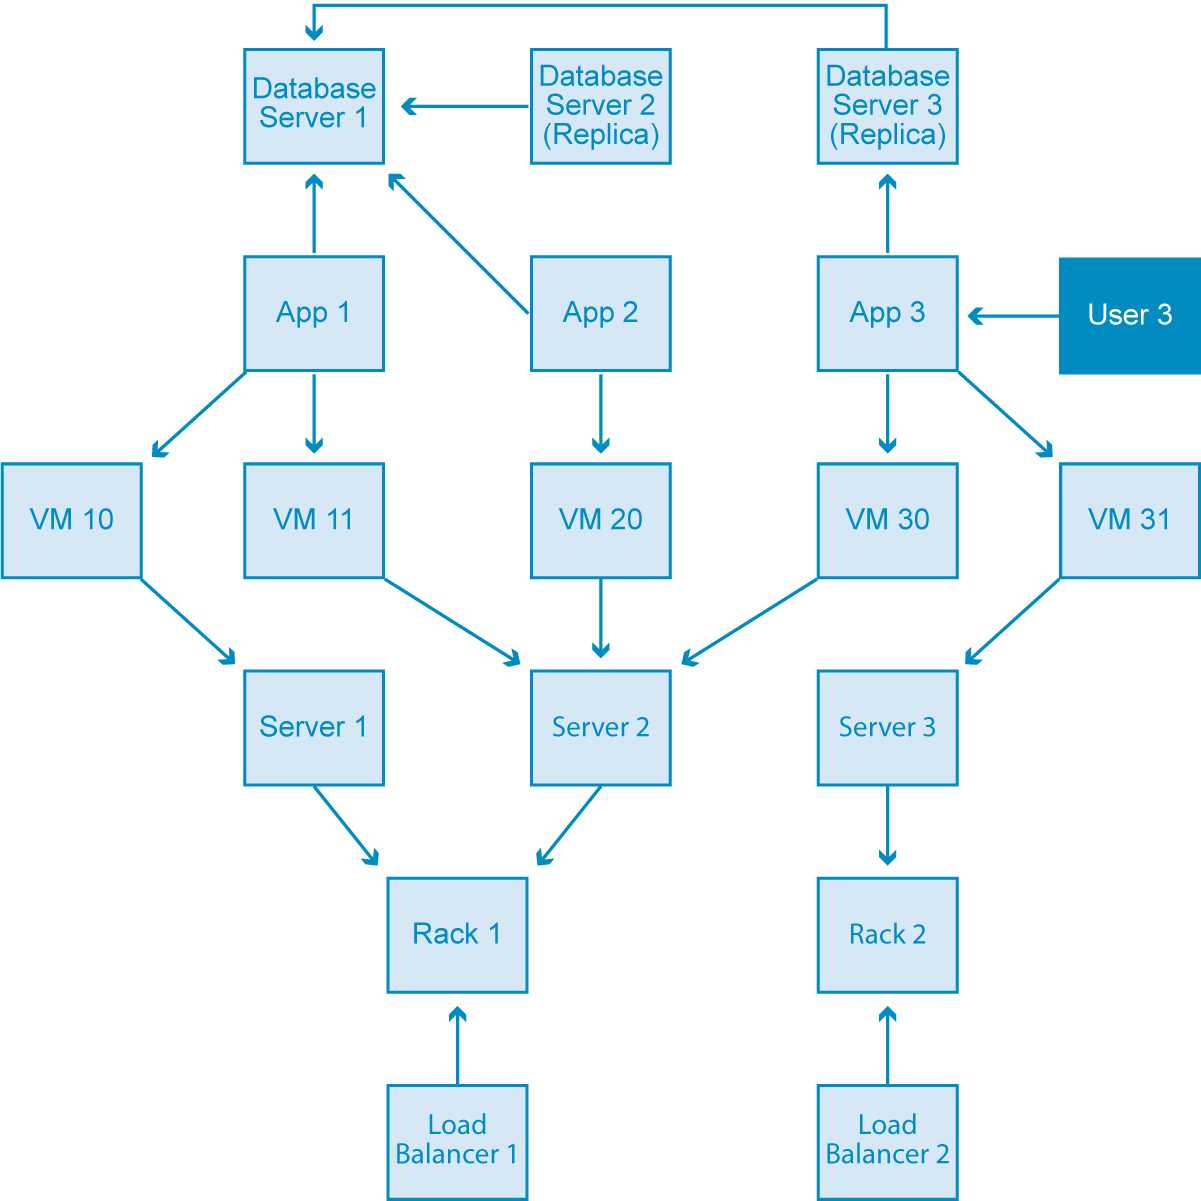
We want to create an application that manages and communicates with this data center infrastructure, so we need to create a data model that includes all relevant elements.
Now, for our match-up.
The Relational Data Model
If we were working with a relational database, the business leaders, subject-matter experts and system architects would convene and create a data model similar to the image above that shows the entities of this domain, how they interrelate and any rules applicable to the domain. It would require a lot of back and forth as well as a lot of what-if thinking trying to plan for every possible exception or rule-breaking (i.e., model-breaking) instance.
It would be a long meeting.
From there, a senior DBA would create a logical model from this initial whiteboard sketch before mapping it into the tables and relations you can see below.

In the diagram above, we’ve had to add a lot of complexity into the system to make it fit the relational model. First, everywhere you see the annotation FK (tech lingo: foreign key) is another point of added complexity. And if you’re not a seasoned sysadmin, I’ll let you in on what you should think when you hear “complexity”: shit will break more often.
On top of all this, new tables have crept into the diagram such as AppDatabase and UserApp. These new tables are known as JOIN tables. (“JOIN” is written in all caps by industry convention, but it’s also a great visual aid to think of JOIN tables as shouting at you. They’re shouting because they’re difficult to work with.)
I hate to be the bearer of bad news, but JOIN tables significantly slow down the speed of a query (and imagine how many queries will be running through your 24×7, mission-critical enterprise application. Yeah, lots.). Unfortunately, they’re also a necessary evil in the relational data model.
The Graph Data Model
Now let’s look at how we would build the same application with a graph data modeling approach. At the beginning, our work is identical – decision makers convene to produce a basic whiteboard sketch of the data model (pictured again below for reference). But there’s a key difference to this meeting: They get out early and enjoy a few hours of extra jet ski acrobatics (like anyone would).
Why’s that? Because with the graph data model, they didn’t have to plan for every possible expansion, exception or fire hazard that might affect the database. Today’s meeting was just a starting point, and if something comes up later the model is adaptable. No sweat.
Refreshed from their jet ski session, our data modelers return to the next step in the process. After the initial whiteboarding process, everything looks different. Instead of altering the initial whiteboard model into tables and JOINs, they enrich the whiteboard model according to their business and user needs.
That’s right: The data model gets better, not worse.
After enrichment, here’s what the newly enriched data model looks like after adding labels, attributes and relationships:

As you can see, the enriched data model isn’t that much different than the initial whiteboard sketch, except that it’s, you know, more helpful. In fact, this data model is now ready to load into a graph database (such as Neo4j!), because with graph technology what you sketch on the whiteboard is what you store in the database.
Bottom line: The only thing standing between you and your completed data model is an EXPO marker and a blank whiteboard.
Why Data Modeling Isn’t a One-Off Activity (No Matter What Database You Use)
It’s easy to dismiss the major differences in data modeling between relational and graph databases. After all, data modeling is just an activity you have to complete once at the beginning of your application development – right? Wrong.
Let’s go back to story time: RDBMS data modeling was rough for a liberal arts grad, but then it got worse.
While we were still in the whiteboarding and brainstorming phase, changes were easy to make to our data model. Of course figuring out which relationships had to be one-to-one and which ones had to be one-to-many wasn’t always easy, but executing those changes was a breeze. After the whiteboarding phase, not so much.
Once we’d plugged and chugged our whiteboard model into Postgres, changes were a lot more difficult. Schema migration is literally no one’s favorite database activity (probably that guy just skipped to the comment section). And once the database was live and in production, my answer to any proposed changes: fuggedaboutit.
Of course, the suits didn’t forget about it. They still needed changes, because the user needs were constantly changing. And business requirements changed too, constantly. That’s because, life alert: change happens.
Why would anyone assume that change wouldn’t happen to their data model? Wouldn’t it just be better to use a data model that accepted change as a fact and prepared for it, instead of digging in its heels and bracing for the inevitable?
Conclusion: Change You Can Believe In
Systems change, and in today’s development world, they change often. In fact, your application or solution might (read: will) change significantly even in mid-development. Over the lifetime of your application, your data model constantly shifts and evolves to meet changing business and user needs.
Relational databases – with their rigid schemas and complex modeling process – aren’t a good fit for rapid change. What you need is a data model that doesn’t sacrifice performance and that supports ongoing evolution while maintaining the integrity of your data.
Now that you know the basics of data modeling, the choice is clear.
If you’re creating an application with a well-understood, minimally changing data model, stick with the tried-and-true relational database. Seriously, just stick with what already works.
But maybe your path is leading you somewhere else. Maybe you’re creating something new. Maybe you’re trail-blazing into uncharted territory. Maybe you can’t plan for a database with all the right answers, because you don’t even know the questions users are going to ask it.
If this describes your next project, then you need a data model that’s agile. You need a data model that evolves alongside development (without breaking down or lagging behind). You need a graph data model.
The future is uncertain (you can count on that). Choose a data model that matches that reality.
Thinking about building a knowledge graph?
Download The Developer’s Guide: How to Build a Knowledge Graph for a step-by-step walkthrough of everything you need to know to start building with confidence.
Catch up with the rest of the Graph Databases for Beginners series:
- Why Graph Technology Is the Future
- Why Connected Data Matters
- Data Modeling Pitfalls to Avoid
- Why a Database Query Language Matters
- Imperative vs. Declarative Query Languages: What’s the Difference?
- Graph Theory & Predictive Modeling
- Graph Search Algorithm Basics
- Why We Need NoSQL Databases
- ACID vs. BASE Explained
- A Tour of Aggregate Stores
- Other Graph Data Technologies
- Native vs. Non-Native Graph Technology
Share Article


Explore
Related Articles

Mastering Fraud Detection With Temporal Graph Modeling


How to Improve Multi-Hop Reasoning With Knowledge Graphs and LLMs

What Are the Different Types of Graph Algorithms & When to Use Them?

