
Graph Databases for Beginners: Graph Theory & Predictive Modeling

Community Graphista
9 min read
There’s a common one-liner, “I hate math…but I love counting money.”
Except for total and complete nerds, a lot of people didn’t like mathematics while growing up. In fact, of all school subjects, it’s the most consistently derided in pop culture (which is the measure of all things, we’re sure).
As a reader who’s interested in a technical topic (graph databases) but wants a non-technical introduction to aforementioned topic, I’m going to make a not-too-bold assumption: You probably don’t like math very much.
But what if I told you, that instead of using math to just count your money, you could use math to make more money? Interested? Turns out, that’s exactly what we’re going to talk about today.
In this Graph Databases for Beginners blog series, I’ll take you through the basics of graph technology assuming you have little (or no) background in the space. In past weeks, we’ve tackled why graph technology is the future, why connected data matters, the basics (and pitfalls) of data modeling, why a database query language matters and the differences between imperative and declarative query languages.
This week, we’re going to take a step back from graph database technology and look at the mathematics powering it all: graph theory. Then we’ll look at how that math – in conjunction with graph technology – helps companies grow their bottom line.
Graph Theory (Not Chart Theory)
Skip the definitions and take me right to the predictive modeling stuff!
First, let’s define just a few terms.
If you’ve been with us through the Graph Databases for Beginners series, you (hopefully) know that when we say “graph” we mean this…
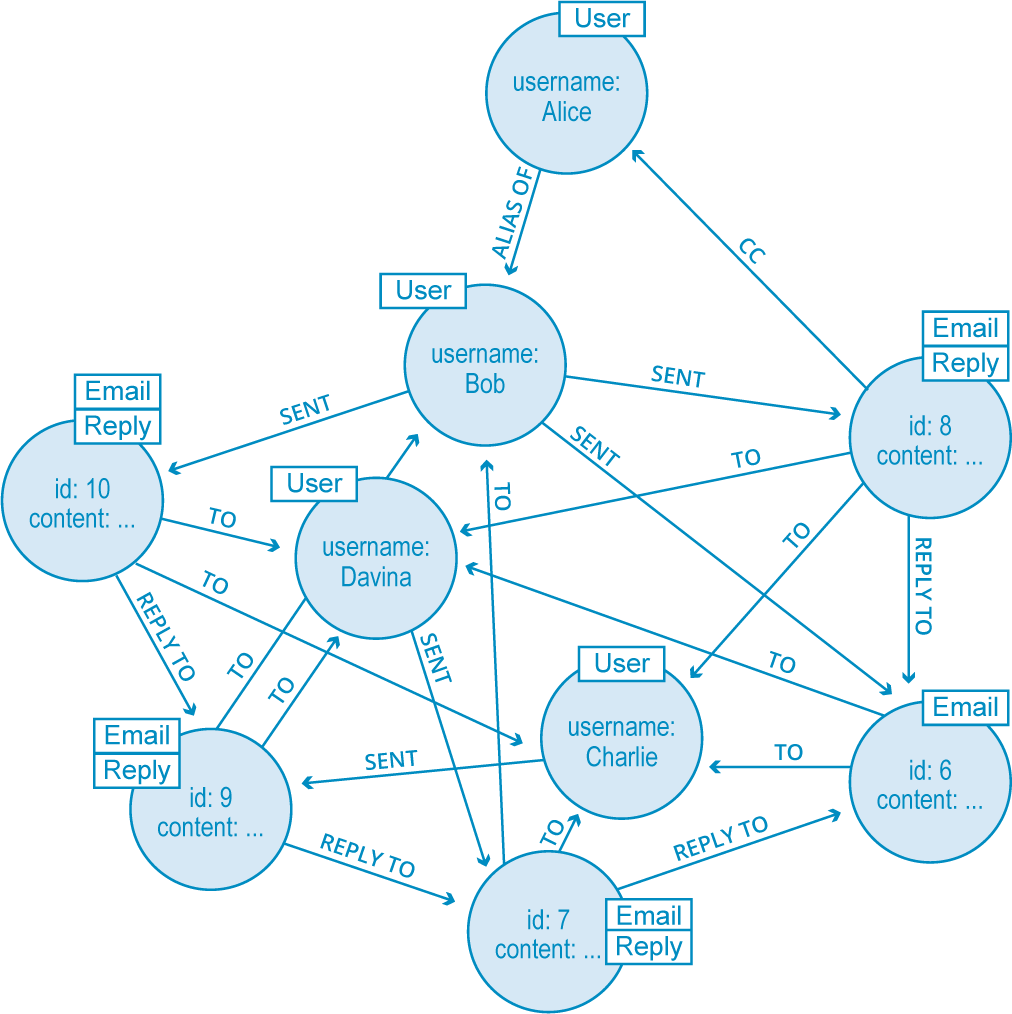
…and not this:
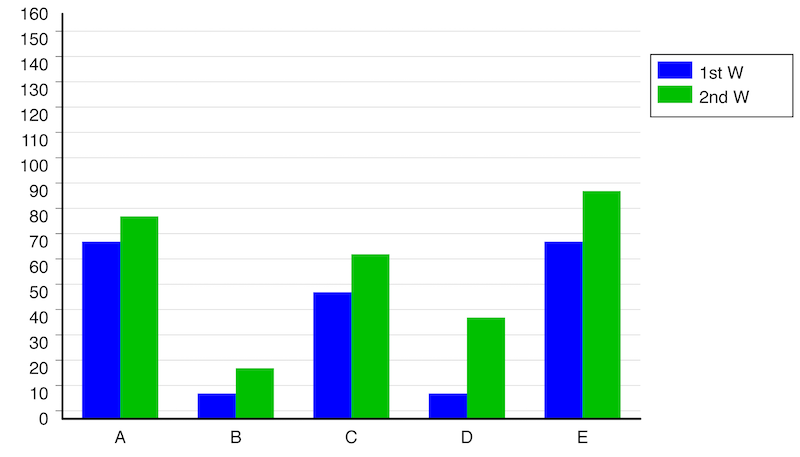
This is a chart, not a graph (for the sake of this blog post, and really for the sake of this whole website). Image source
Graph theory is a type of math that doesn’t use a lot of numbers. A total nerd came up with it to stop his friends (not really his friends) from bugging him about getting out of the house more (he didn’t). Fortunately for you, you too can use this math to avoid getting out of the house and lose your friends.
So when we say “math” you don’t have to find “x” or even use numbers so we’re good, right?
Also, for the sake of the examples of this blog post, we’re going to be using a lot of social science and network science examples.
“Wait,” I hear you say, “we have to use math and science now too? Ugh.” But this science doesn’t involve cutting open frogs or finding the velocity of the train headed to Philadelphia or working on anything that was clearly a hoax invented by the Chinese.
So if you came for the “make money” part of this blog post, stick around. We’re going to use math and science to make money, and while the examples come from just a few narrow fields of aforementioned math and science, they’re applicable to your business too. We promise, because graphs are everywhere.
Triadic Closures
One of the most common properties of graphs is that of triadic closures. This is the observation that if two nodes are connected via a path with a mutual third node, there is an increased likelihood of the two nodes becoming directly connected in the future.
In a social setting (social science!), a triadic closure would be a situation where two people with a mutual friend have a higher chance of meeting each other and becoming acquainted.
The triadic closure property is most likely to be upheld when a graph has a node A with a strong relationship to two other nodes, B and C. This then gives B and C a chance of a relationship, whether it be weak or strong. Although this is not a guarantee of a potential relationship, it serves as a credible predictive indicator.
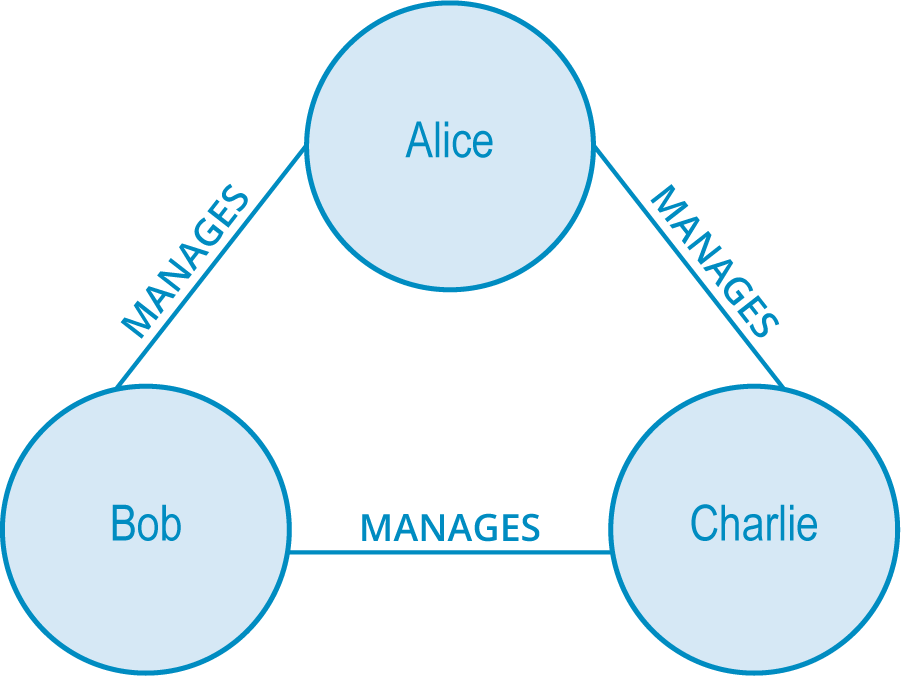
Let’s take a look at this example.
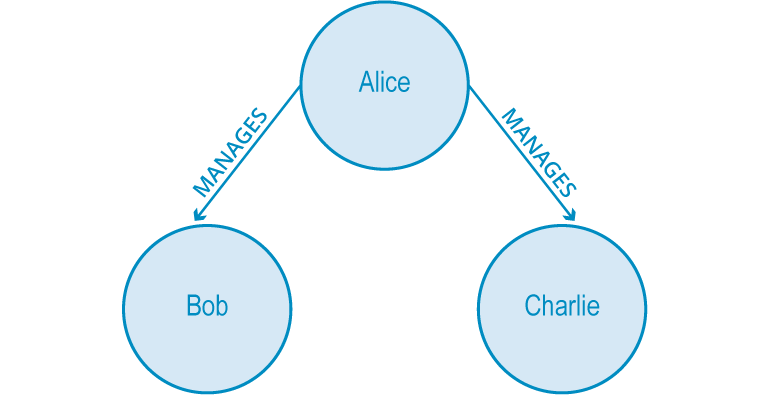
Above is an organizational hierarchy where Alice manages both Bob and Charlie. This is rather strange, as it would be unlikely for Bob and Charlie to be unacquainted with one another while sharing the same manager.
As it is, there is a strong possibility they will end up working together due to the triadic closure property. This creates either a WORKS_WITH (strong) or PEER_OF (weak) relationship between the two of them, closing the triangle – hence the term triadic closure.

But How Do I Use It?
“Social graph theory definitions are great and all, but how do I use the math to make more money (and therefore count my more money)?” I hear you asking in your head.
To dive into every single use case of graph technology would be a George R.R. Martin-length series of novels that wouldn’t even cover them all (and still wouldn’t be finished), so we’re going to settle for a few examples as we define each new term. Hopefully these illustrations help get your creative juices flowing on how graphs – and particularly graph algorithms – help build your bottom line.
Social Networks: Imagine you have a social network application (whether external or internal), and you want to suggest connections to your users in a way that delivers the most value (i.e., not just random suggestions). You would likely build your predictive graph model to suggest connections that complete triadic closures. This gives your users the most relevant and useful recommendations. Happy users (almost always) = more business value (i.e., money) from your social network.
Other Examples: Not running a social network? Here are some other applications of triadic closures:
- A real-time recommendation engine might use triadic closures to suggest new products to ecommerce shoppers that are closely related to past purchases.
- In Customer 360, predicting triadic closures helps you build a more complete (i.e., less siloed) picture of a customer because you’re able to see the entire picture of how a customer’s data is connected.
- In network management, investigating triadic closures may help you identify which servers or other network components are dependent on the same bottleneck, making your impact analysis more accurate.
Structural Balance
Another aspect to consider in the formation of stable triadic closures is the quality of the relationships involved in the graph. To illustrate the next concept, assume that the MANAGES relationship is somewhat negative (who likes to be managed?) while the PEER_OF and WORKS_WITH relationships are more positive.
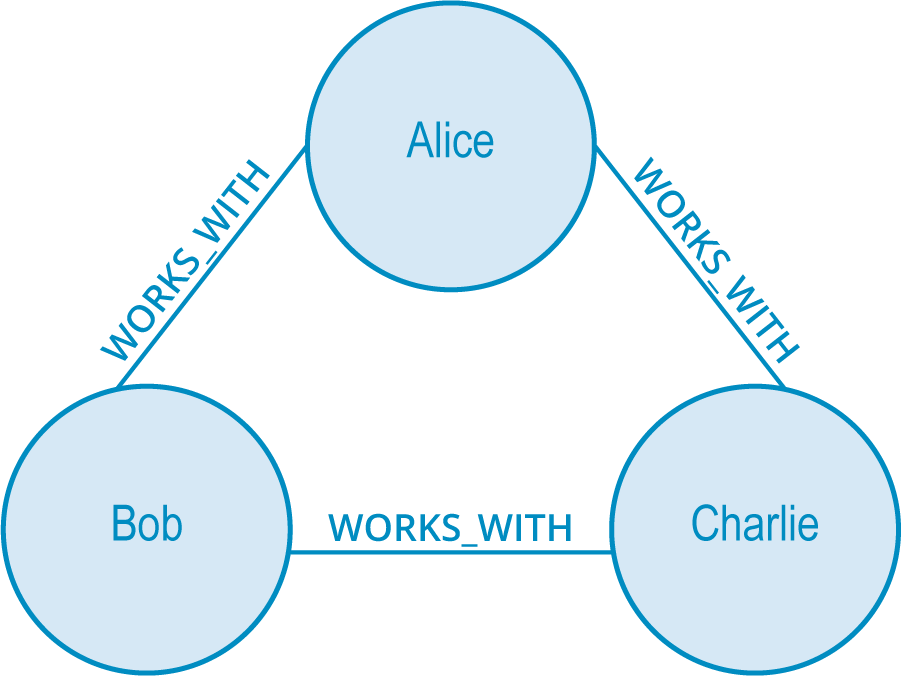
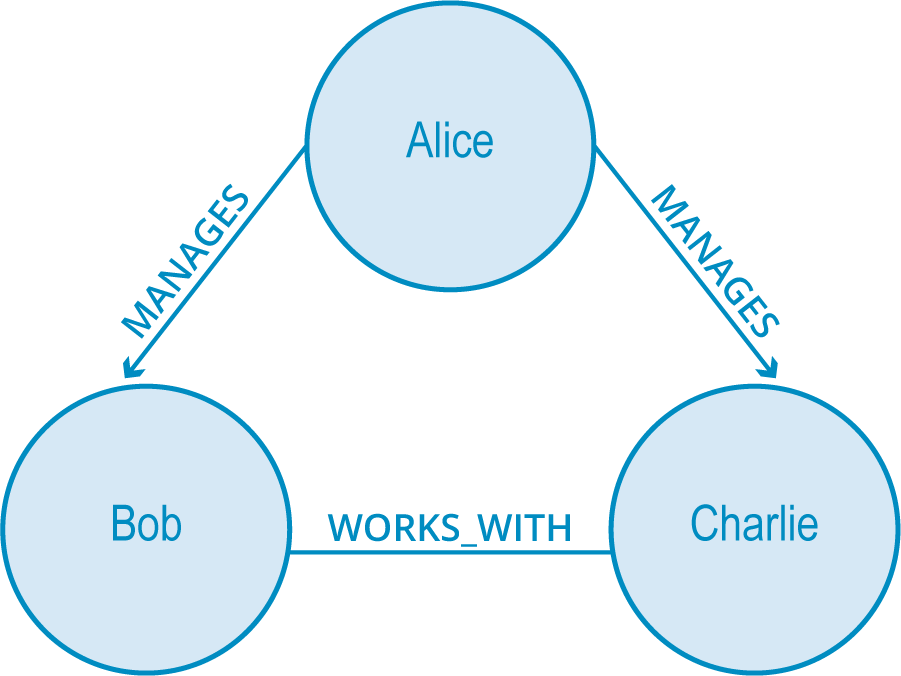
Based off of the triadic closure property, we fill in the third relationship with any label, such as having everyone manage each other (weird), like in the first image below, or the (somehow even weirder) situation in the second image below.

However, you can see how uncomfortable those working situations would be in reality. In the second image, Charlie finds himself both the peer of a boss and a fellow worker. It would be difficult for Bob to figure out how to treat Charlie – as a fellow coworker or as the peer of his boss?
We have an innate preference for structural symmetry and rational layering. In graph theory, this is known as structural balance.
A structurally balanced triadic closure is made of relationships of all strong, positive sentiments (such as the first example below) or of two relationships with negative sentiments and a single positive relationship (second example below).
Balanced closures help with predictive modeling in graphs. The simple action of searching for chances to create balanced closures allows for the modification of the graph structure for accurate predictive analysis.
But How Do I Use It?
Fraud Detection: Imagine you’re trying to catch the bad guys in the financial services sector with a fraud detection application. When you look at the data as a graph, fraud rings always have a particular shape. So if you build your predictive model to identify potential instances of structural balance (such as two synthetic identities listed under the same phone number or any number of other known fraud tactics), then bam you now have a subset of your data to investigate for potential fraudulent activity.
Other Examples: Here are a few other ways you might use the structural balance principle of triadic closures to further your world domination goals (that’s what you’re here for, right?):
- If you’re building an artificial intelligence application, then having your system learn how to identify structural balance is essential to making relevant, context-driven decisions.
- Within identity and access management, analyzing triadic closures with structural balance helps you identify users who have (or need to have) access to structurally similar assets or other applications – this helps you set more accurate inheritance rules accordingly.
- If you’re managing an organizational knowledge graph, pinpointing structural balance is key to interconnecting your data that may otherwise be siloed.
Local Bridges
We go further and gain more valuable insight into the communications flow of our organizations by looking at local bridges.
Local bridges are a tie between two nodes where the endpoints of the local bridge are not otherwise connected, nor do they share any common neighbors. Think of local bridges as connections between two distinct clusters of the graph. In this case, one of the ties has to be weak.
For example, the concept of weak links is relevant in algorithms for job search. Historical studies have shown that the best sources of jobs come from looser acquaintances rather than close friends. This is because closer friends tend to share a similar worldview (are in the same graph component) but looser friends across a local bridge are in a different social network (and are in a different graph component).
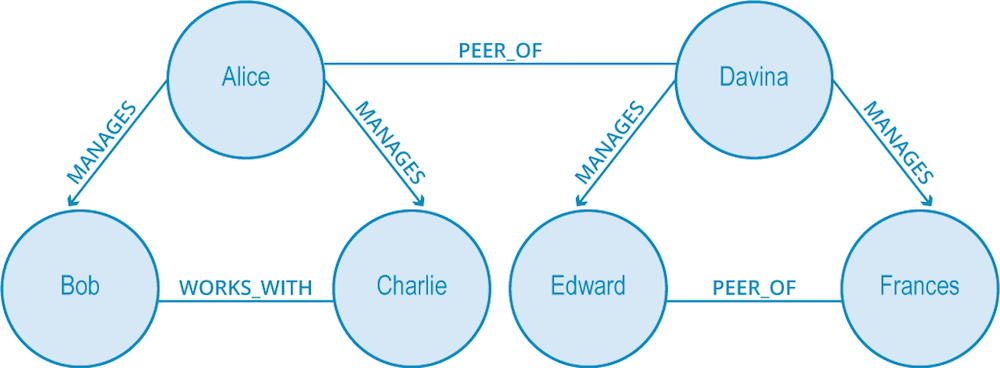
In the image above, Davina and Alice are connected by a local bridge but belong to different graph components. If Davina were to look for a new job, she would be more likely to find a successful recommendation from Alice than from Frances.
This property of local bridges being weak links is something that is found throughout social graphs. As a result, we make predictive analyses based on empirically derived local bridge and strong triadic closure notions.
But How Do I Use It?
Data Lineage: So, you’re the person tasked with tracking user data for GDPR or some other regulatory compliance? Graphs have got you covered. The principle of local bridges – and the graph algorithms that help you identify them – means you can more accurately predict how two (or more) clusters of data are in fact related to the same user. Imagine how a sales department may be storing data on a particular user, but marketing might also be storing data on the same user. By identifying a local bridge between these similar clusters, you more accurately meet GDPR requests on stored user data.
Other Examples: Here are a few other applications of the local bridges concept when it comes to predictive modeling:
- Consider the example above (about job searches) in greater detail: If you’re building a professional networking site aimed at job seekers, then building local bridges within your social network app makes your job recommendations more accurate.
- If you’re a cybersecurity professional, it’s imperative to identify local bridges between clusters of vulnerable network components, firewalls, or other possible lines of attack. Your opponents certainly will be.
- Local bridges are also the bedrock of advanced recommender systems, because leveraging local bridges allow you to accurately model and predict links between various clusters of data that include users, their past purchases and their current shopping carts.
Conclusion
While graphs and our understanding of them are rooted in hundreds of years of mathematical study (i.e., graph theory), we continue to find new ways to apply them to our personal, social and business lives. Technology today offers another method of understanding these principles in the form of the modern graph database.
As you’ve seen through this Graph Databases for Beginners series so far, you simply need to understand how to apply graph theory and related analytical techniques in order to achieve your business goals.
Catch up with the rest of the Graph Databases for Beginners series:
- Why Graph Technology Is the Future
- Why Connected Data Matters
- The Basics of Data Modeling
- Data Modeling Pitfalls to Avoid
- Why a Database Query Language Matters (More Than You Think)
- Imperative vs. Declarative Query Languages: What’s the Difference?
- Graph Search Algorithm Basics
- Why We Need NoSQL Databases
- ACID vs. BASE Explained
- A Tour of Aggregate Stores
- Other Graph Data Technologies
- Native vs. Non-Native Graph Technology
Share Article


Explore
Related Articles

Mastering Fraud Detection With Temporal Graph Modeling

What Are the Different Types of Graph Algorithms & When to Use Them?


Top 10 Graph Database Use Cases (With Real-World Case Studies)

