Your technical documentation should be a graph: Here’s why

Co-Founder and CEO, Structr
5 min read
TL;DR: This blog post is mainly about how technical documentation should ideally be structured: as a graph (not to be confused with a chart).
As a software developer and author I have had the chance (and also the obligation) to write about software from many different perspectives and in even more different formats: Manuals, marketing papers, website articles, support issues, bug reports, blog posts, conference talks….
Each human being is different, and even if we try to group and categorize them, there are still a lot of different groups of users: Noobs, beginners, aspiring learners, power users, developers, administrators, professional critics and more.
Any target group has different needs when it comes to written technical documentation, but they all have one thing in common: The docs should explain how the software works best for them to achieve their individual goals and to make them happy, because most software applications are created for users to use in the first place. Without users, any software is use(r)less so any documentation should always be written not only for users but with users’ happiness in mind.
The progress of insight is non-linear
Whenever we approach unknown territory (in this case complex things like technical software), we typically start by making some first cautious steps, testing something here and there, trying to make sense of what we see and experience.
Depending on our unique personalities, we might continue with trial and error, or eventually consult the manual. I think it’s safe to say that most people read documentation sooner or later and jump between how-tos, practical tips, reference documentation and FAQs.
The progress of insight from exploring new things, either by trial and error or reading the docs, is not foreseeable at all. It’s true that the learning curve of humans approaching new areas is more or less steep, but what’s more important is that it’s completely non-linear, at least for most of us.
Documentation should just be there to support people when they got stuck, or to lift them onto the next level of wisdom. In contrast, classical technical documentation is linear and oftentimes structured like a print document: A sequence of chapters and sections with a leading index.
If there’s any structure beyond that, it is merely a tree: Chapters and sub-chapters. That’s it. This might be good for storytelling, but surely not optimal for supporting a non-linear learning path.
Writer’s Bias
Writing technical documentation is difficult.
Not only should you use reduced, simple, exact and unemotional language (depending on the type of documentation of course), like this tweet impressively shows:
How a career in technical writing ruined me as a letter writer pic.twitter.com/atLXrxRCXb
— Karl Kovacs (@karlkovacs) April 3, 2016
Good documentation should also be comprehensive, correct, unbiased, etc, etc.
You wouldn’t be writing about something if you didn’t qualify as an expert on this given matter. It’s your special knowledge that enables you to write about it, but it could also limit you to your own context and bias. As a developer, you might tend to describe things in a very technical slang, assuming knowledge to be present at the receiver which might seem trivial to you but that isn’t for anybody else.
When writing a continuous piece, you tend to write it in a constant style, trying to avoid changing the diction of the text. Good for a novel, but bad for satisfying the needs of a wide audience.
The path of maximum intuition
As all humans take different, non-linear ways to enlightenment, and there always exists an optimal path through the matter from one milestone to the next for each of us.
This is what I call “The Path of Maximum Intuition,” and it’s based on the principle that it takes less energy for humans to learn new things if they are close to existing context, alongside available knowledge and based on facts and experiences they already trust.
What’s the next obvious step in a particular situation? How can we describe complex topics in words users can grasp without thinking? How can we make them understand complex interrelationships more easily because they connect to their personal context?
Of course, it all depends on the knowledge and context a reader has, and the ability of the writers to put themselves in the reader’s shoes. The consequence is that there’s no one-path-fits-all, not the one best path, and there’s not even the “golden middle course.” All of these would be a more-or-less acceptable compromise.
Solution: use a graph
The solution might sound simple: Just structure the documentation as a graph.
Instead of forcing readers to follow a single, linear, flat sequence of sections, just offer different routes between articles or items. Just like there are different ski slopes for beginners and pros, you could even mark the connections with different colors, from blue over red to black.
By offering more than one outgoing connection from one doc item to the next, you allow users to find their individual path through the documentation, following their natural intuition, saving energy for creative tasks.
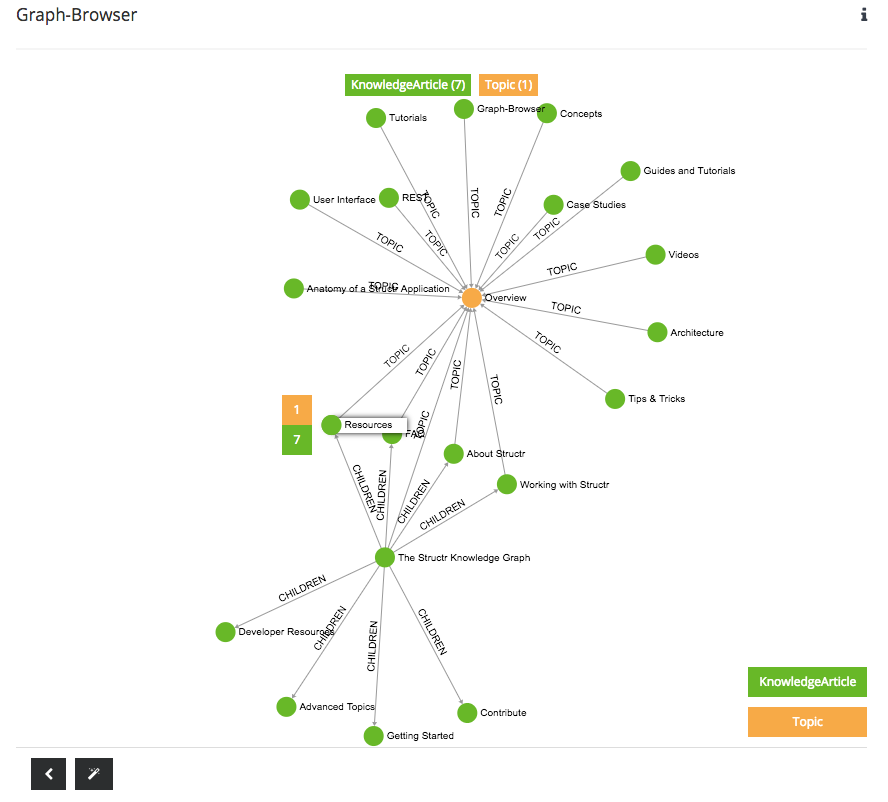
We at Structr haven’t yet implemented all the ideas and features mentioned above, but our new documentation site is a graph with all the potential in it. We call it The Structr Knowledge Graph.
Besides the official technical documentation, you will find help articles, FAQs, tutorials and explanatory videos as well as links to Stack Overflow questions, GitHub issues or discussion threads, all of them being nodes in a graph.
The goal is to use a mixture of manual categorization, natural language processing (NLP) and as much information as possible extracted from the original content sources to make it the best knowledge source about all things Structr.
We’re constantly working on improving the Structr Knowledge Graph and we’ll add more and more content and features to support our users and make them happy. 🙂
Structr is a Gold Sponsor of GraphConnect Europe. Click below to register for GraphConnect and meet Axel and the rest of the Structr team in London on 26 April 2016.
Share Article


Explore
Related Articles

Neo4j Named “One to Watch” in Snowflake’s 2026 Modern Marketing Data Stack Report

POLE+O: The 5-Type Ontology That Solves the Hardest Part of Building a Knowledge Graph

1 of 3: The difference between a graph, a knowledge graph, and a context graph
