SumoDB in Neo4j: Graph Analytics in Snowflake — Part 2
Senior Developer Advocate at Neo4j
5 min read

SumoDB in Neo4j: Graph Analytics in Snowflake — Part 2
In our previous blog, we showcased how graph databases can be used to model the world of Grand Sumo. We devised a graph model comprised of bashos, bouts, rikishi, and kimarite in Neo4j based on data from https://sumodb.sumogames.de/Default.aspx. Neo4j Bloom was used to visualize our model and we used the Neo4j Graph Data Science Algorithm Eigenvector Centrality to analyze the most important/central rikishi in all the bouts that involved the top 3 rikishi of the top division, Makuuchi.
In this post, we will dive into how to use Neo4j Graph Analytics for Snowflake. We will show how to install the Neo4j Graph Analytics App from the Snowflake Marketplace, granting appropriate permissions, and how to prepare and run Graph Algorithms directly on our native Snowflake data tables. Using Neo4j Graph Analytics for Snowflake can offer several advantages such as cloud scalability, on-demand pricing, and using the power of graphs where your data already lives.
The data — Makuuchi of Haru Basho 2026
Previously we only considered the top 3 rikishi and every bout they have had in the Juryou and Makuuchi divisions. This made our graph heavily biased toward those specific rikishi. Today we will expand on our data for the graph, using the top 42 rikishi from the Makuuchi division in the Haru Basho 2026 and every bout they have had in their Juryou and Makuuchi careers. This brings us to a graph consisting of around 20k nodes and 86k relationships. Represented as a csv, we have about 25k rows and 44 columns pulled directly from the sumodb.sumogames.de website.

The platform — Snowflake
Snowflake offers a cloud-native, fully managed data platform that is easy to use and set up. Instead of translating, transforming and loading our data into a native graph database via cypher import statements, the Neo4j-import tool, or the load CSV tool, Snowflake lets us drop our CSV in as a table and automatically infers data types without the need to map out the graph model. Our table consists of the basho date, the day of a bout, the rank and name of the West camp rikishi, the winning move (kimarite), and the rank and name of the East camp rikishi, as well as who won and lost the match.
The algorithm — Louvain Community Detection
Neo4j Graph Analytics for Snowflake offers efficient and parallelized graph algorithms ranging from Dijkstra’s algorithm to graph neural networks. For this blog, we are going to dive into a famous community detection algorithm called Louvain. This algorithm works by maximizing a modularity score for each community, where the modularity quantifies the quality of an assignment of nodes to communities. This means evaluating how much more densely connected the nodes within a community are, compared to how connected they would be in a random network.
The setup — Getting started
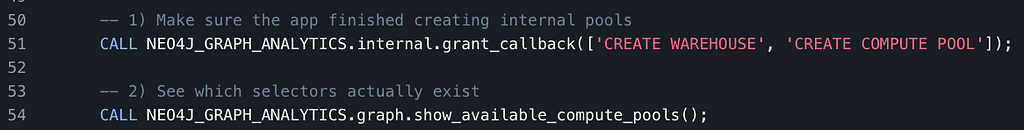
Neo4j Graph Analytics for Snowflake can be installed from the Snowflake Marketplace. The installation tutorial can be found here. The main steps involve providing the application with appropriate privileges. This is as simple as a few calls to grant permission and usage:

If the application doesn’t create the COMPUTE_POOL on installation, you can achieve this manually by doing the following:
Once we have the installation, permissions, and privileges set, we are ready to use Neo4j Graph Analytics on our data.
Putting it all together
In order to use Neo4j Graph Analytics for Snowflake, we begin by defining the node table and relationship table to be used in the Graph API. This can be seen below:
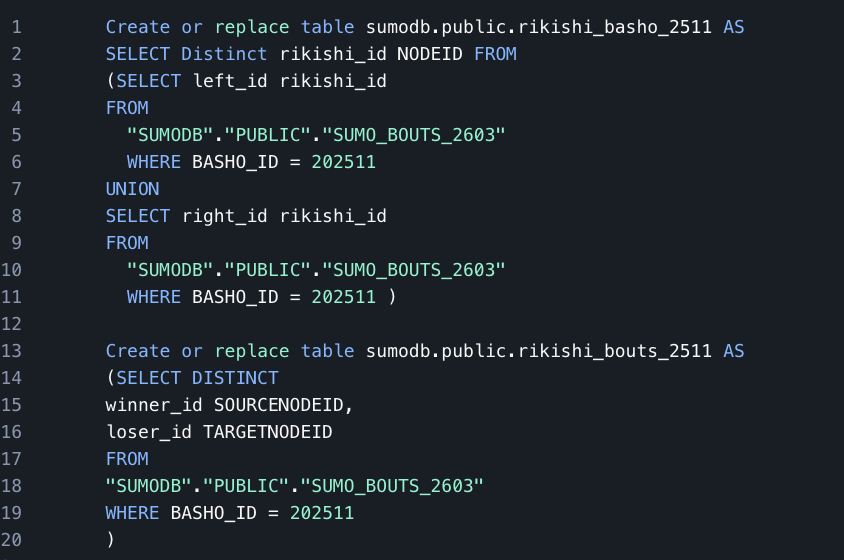
For our initial example, we will focus on a single Basho — Kyushu Basho 2025. We define all distinct rikishi_ids as our node table and the winning and losing rikishi id for each bout as our relationship table. Once we have our node and relationship tables created, using Louvain Community detection is done by simply calling the api with our tables in the correct places as shown below:
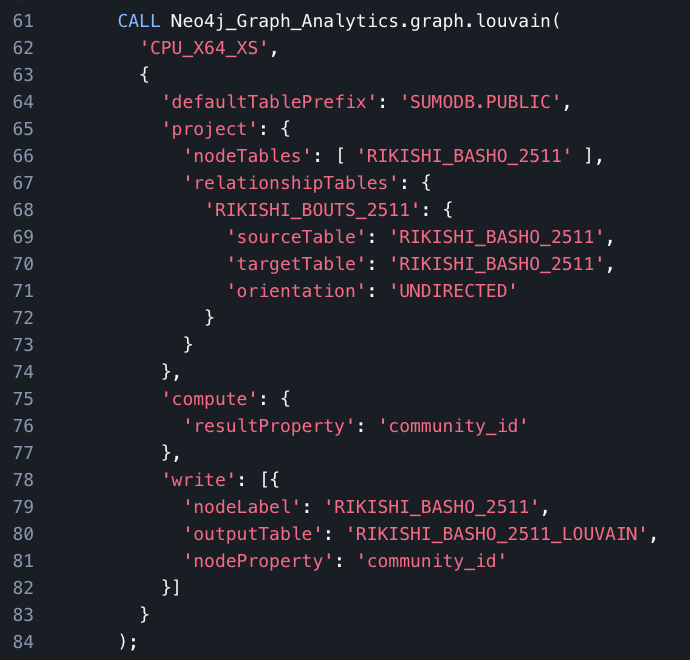
This procedure call will return the following on success:
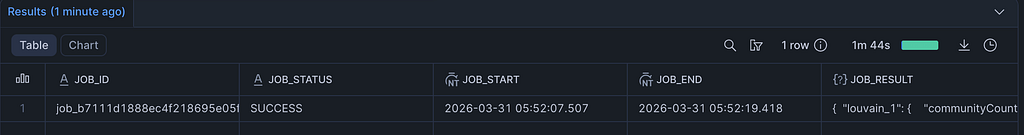
The results — Inference from relationships
In our example, we provided the Louvain algorithm only the Rikishi Ids and the pairs of Ids from each bout in the Kyushu Basho of 2025, yet from this data alone we are able to see some interesting results. Snowflake offers the ability to create python notebooks to visualize the graph seen here:

The three communities discovered in our example turn out to correlate to ranks of the rikishi across the basho. The upper ranks of the Makuuchi from Maegashira rank 4 up through Yokuzuna shown in purple, the rank-and-file Makuuchi ranks from Maegashira 17 through 5 can be seen in yellow, and the Juryou ranked rikishi can be seen in Orange. This makes sense as throughout the tournament most rikishi are assigned to bouts within a few ranks of their own rank.
Conclusion
In this post, we walked through the installation of the Neo4j Graph Analytics App from the Snowflake Marketplace, we showed how to prepare our data for the Graph API, and explained how Louvain Community Detection can be used to infer the rank of a rikishi simply by analyzing the pairings of the rikishi throughout the basho.
Next time, we will show how combining multiple graph algorithms together in Snowflake can be used to analyze the archetype of each rikishi and group rikishi by their most common kimarite to find what makes top rikishi successful.
If you enjoyed this blog, feel free to like, follow, and share it with others. You can find the code used in this blog post at my github here.
SumoDB in Neo4j: Graph Analytics in Snowflake — Part 2 was originally published in Neo4j Developer Blog on Medium, where people are continuing the conversation by highlighting and responding to this story.
Share Article


Explore
Related Articles

Hybrid Search in Neo4j: Full-Text, Vectors, and Graph Topology with Cypher