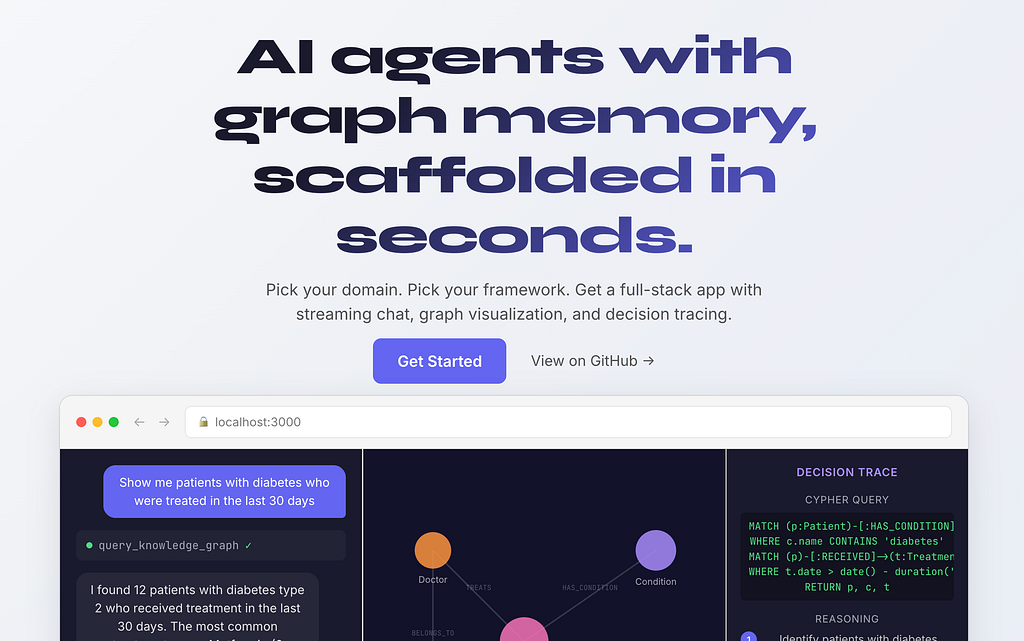
AI Agents With Graph Memory, Scaffolded In Seconds with uvx create-context-graph
A Neo4j Labs CLI that turns one command into a full‑stack context graph agent app — with a knowledge graph, decision traces, streaming chat, and a graph visualization built in.

If you’ve built an AI agent in the last year, you’ve probably learned a hard lesson the same way I did: the agent isn’t the hard part anymore. The context layer is.
Pick any framework — PydanticAI, LangGraph, Claude Agent SDK, OpenAI Agents, CrewAI, AWS Strands — and you’ll get a streaming chat loop and tool calls running in an afternoon. What you won’t get is an answer to questions like:
- “Which patient did the agent recommend that treatment for last week, and why?”
- “What’s blocking the v2 launch, and who has bandwidth in the current sprint?”
- “Why did we switch from JWT to OAuth2 in the auth service three months ago?”
These aren’t similarity questions. They’re structure questions. Connected. Multi-hop. Provenance-aware. The kind of thing a flat chat log or a vector index can’t really answer — because the answer lives in the relationships between things, not in the things themselves.
That’s the gap create-context-graph is built to close.
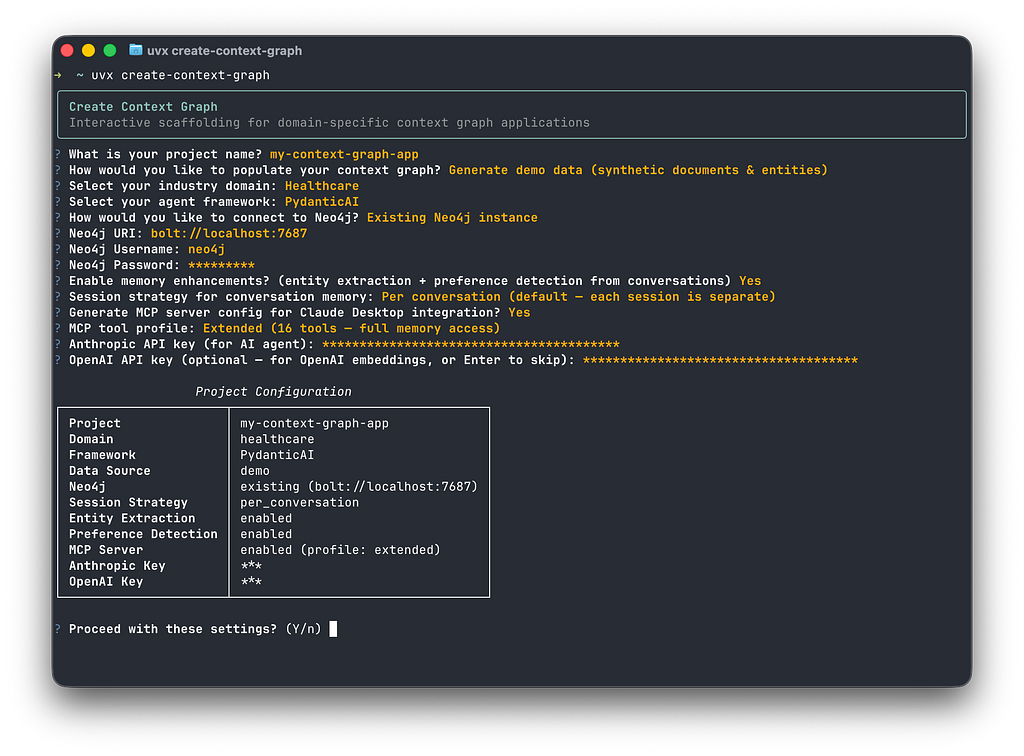
create-context-graph is a CLI scaffolding tool – think create-next-app, but for AI agents that need real memory.
One command generates a complete, working full-stack application:
uvx create-context-graph

- A FastAPI backend wired to Neo4j
- A Next.js 15 frontend with streaming chat and an interactive graph visualization
- A working AI agent in your framework of choice
- A domain ontology schema with entity types, relationships, and Cypher-powered tools
- Optional demo data so you can ask real questions on first run
Create Context Graph is an open source Neo4j Labs project and is built on top of neo4j-agent-memory – the underlying Python package that gives every generated app three memory types in one connected graph.
uvx create-context-graph my-app \
--domain healthcare \
--framework pydanticai \
--demo-data
That single line gets you a runnable agent app with realistic patient, provider, diagnosis, and treatment data — plus an agent that can actually reason about the relationships between them.
Most agent memory implementations stop at the first two layers: a chat history and a vector store of past content. That’s enough to make an agent feel responsive. It’s not enough to make it understand.
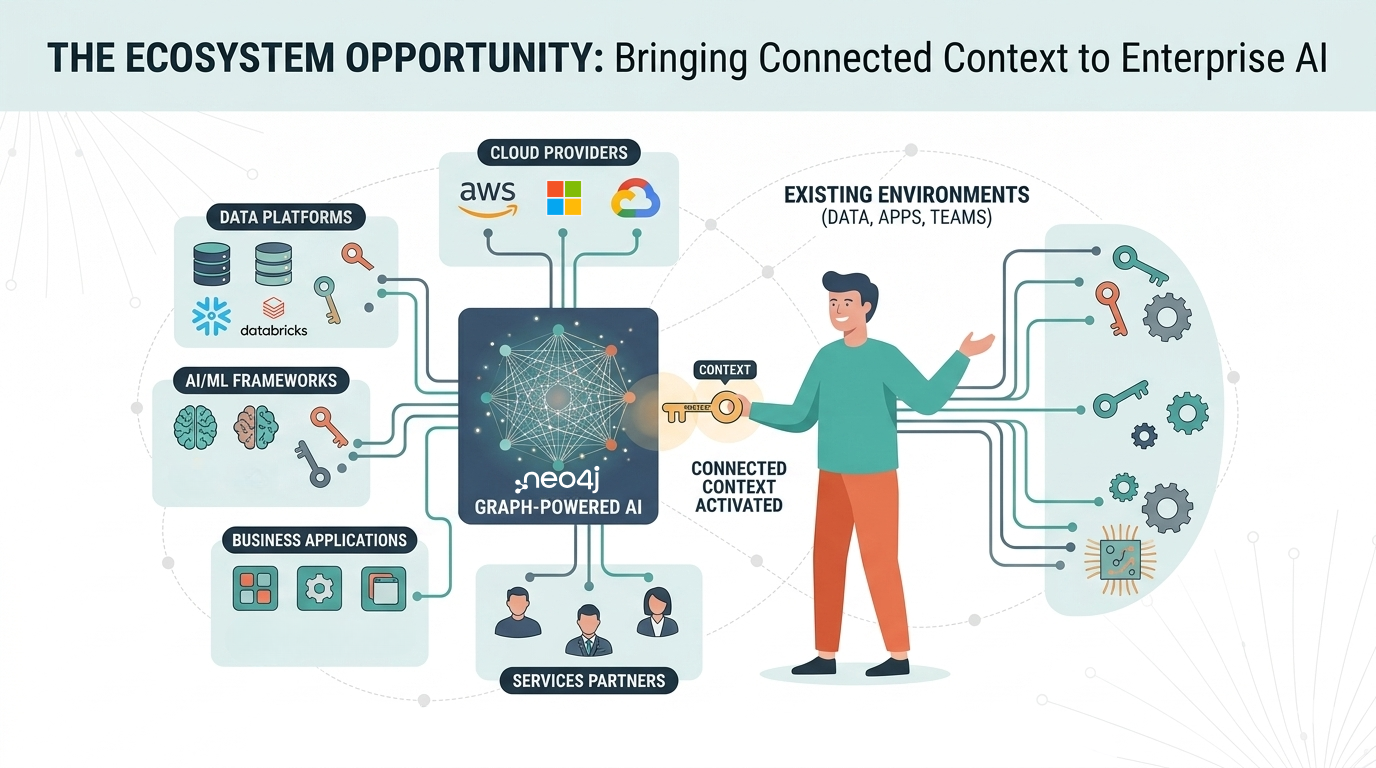
A context graph is what you get when you store all of an agent’s memory as a connected graph and treat structure as a first-class citizen.
This is where the agent’s understanding of the world lives. Entities are categorized using the POLE+O model:
- Person — patients, players, employees, researchers
- Organization — companies, hospitals, teams
- Location — places, facilities, regions
- Event — incidents, encounters, sprints, transactions
- +Object — everything else (issues, documents, code files, products)
Every domain (healthcare, financial services, software engineering, gaming, conservation — there are 22 of them out of the box) layers domain-specific entity types on top of POLE+O. So :Patient is a :Person, :Cycle is an :Event, :Issue is an :Object. That cross-cutting type system is what lets you combine domains and connectors without re-modeling everything from scratch.
When the agent makes a decision — recommending a treatment, choosing a tool, picking an approach — the reasoning chain is captured as a :DecisionTrace with linked :TraceStep nodes. Each step records the thought, the action taken, and the observation that came back.
You don’t just know what the agent said. You know why.

Vector stores give you recall. The graph gives you understanding. Similarity search is great for finding things that look alike. It’s not great for “find every sub-issue of ENG-101 that’s blocked by an unstarted issue in the current cycle, assigned to someone other than the original author.” That’s a graph query, and it’s the kind of question agents need to answer in real applications.
Every tool call the agent makes lights up the corresponding nodes and edges in the graph view in real time. You don’t just see the answer — you see the path the agent took to get there.
Each domain ships with a full ontology, demo data, agent tools, and graph schema. A few of the more popular ones include financial services, healthca, gaming, real estate, manufacturing, conservation, data journalism, GIS, hospitality, and a dozen more. Don’t see yours? The ontology is YAML — add a custom domain in a few minutes.
The agent file in the generated project is the only thing that changes between frameworks. Tools, memory, and the frontend stay identical. Switch frameworks with one CLI flag — useful for benchmarking or migration.
Create Context Graph Data Connectors
Demo data is fun. Your own data is even more fun and meaningful.
The CLI has a –connector flag that imports from real services and maps them into the POLE+O ontology automatically. Two of the most useful for developers are Linear and Claude Code sessions – and they’re worth looking at in detail because they show two very different shapes of context graph.
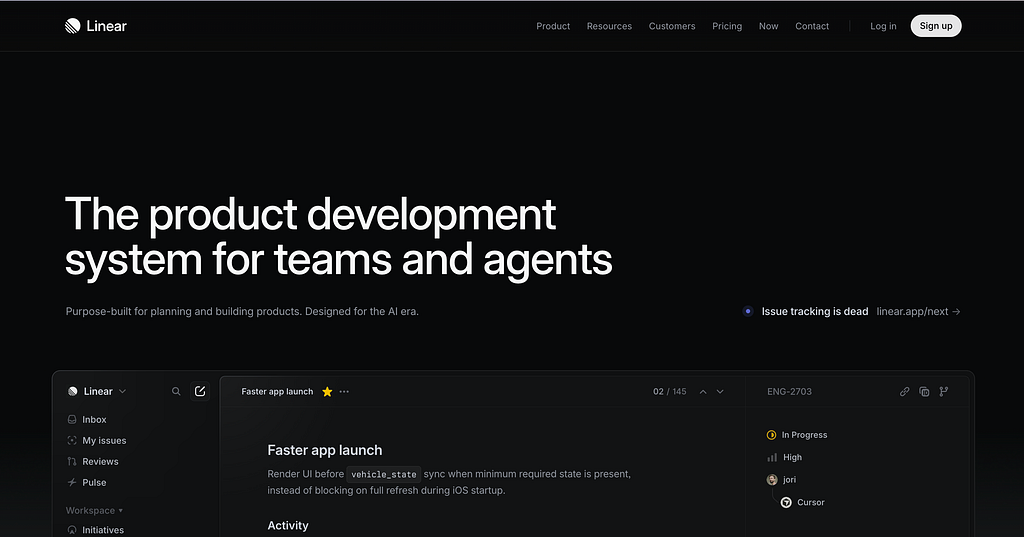
Using The Linear Create Context Graph Data Connector
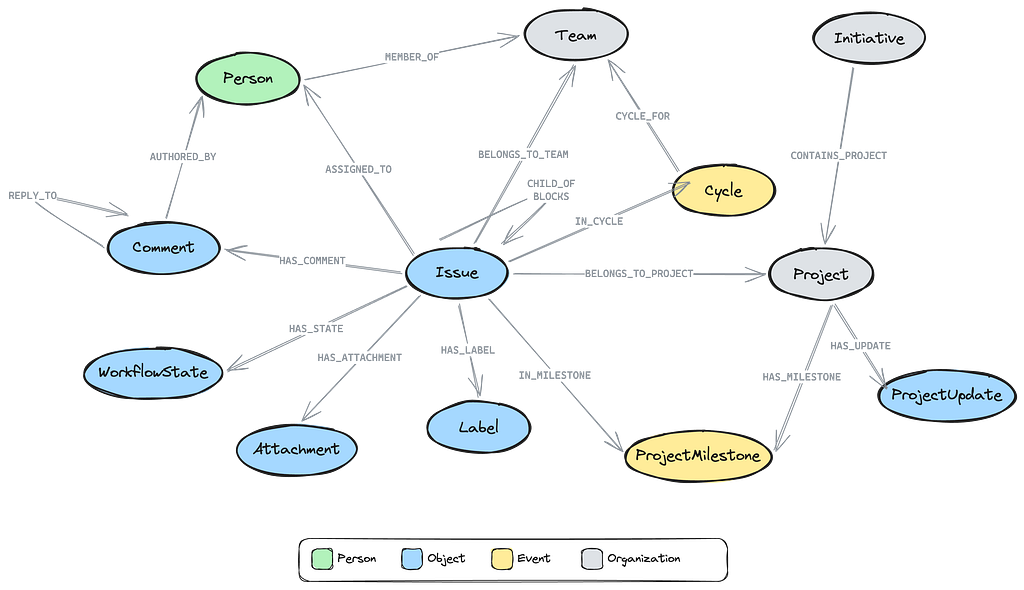
The issue tracking tool Linear is the kind of tool that has a graph hiding inside it. Issues block other issues. Sub-issues roll up to their parents. Cycles contain issues. Projects roll up to initiatives. Comments thread under issues and resolve into decisions. The Linear UI shows you slices of that graph at a time. The Linear connector structures the complete dataset into a Neo4j graph so you can ask questions across all of it in any way, shape or form.

Generate a Linear API key at Settings → Security & Access → API, then run:
uvx create-context-graph my-linear-app \
--domain software-engineering \
--framework pydanticai \
--connector linear \
--linear-api-key lin_api_xxxxx
If your workspace has multiple teams, scope to one with –linear-team ENG.
The connector validates the API key, paginates through teams, users, labels, projects, cycles, issues, comments, milestones, initiatives, and attachments, and writes everything to the graph.
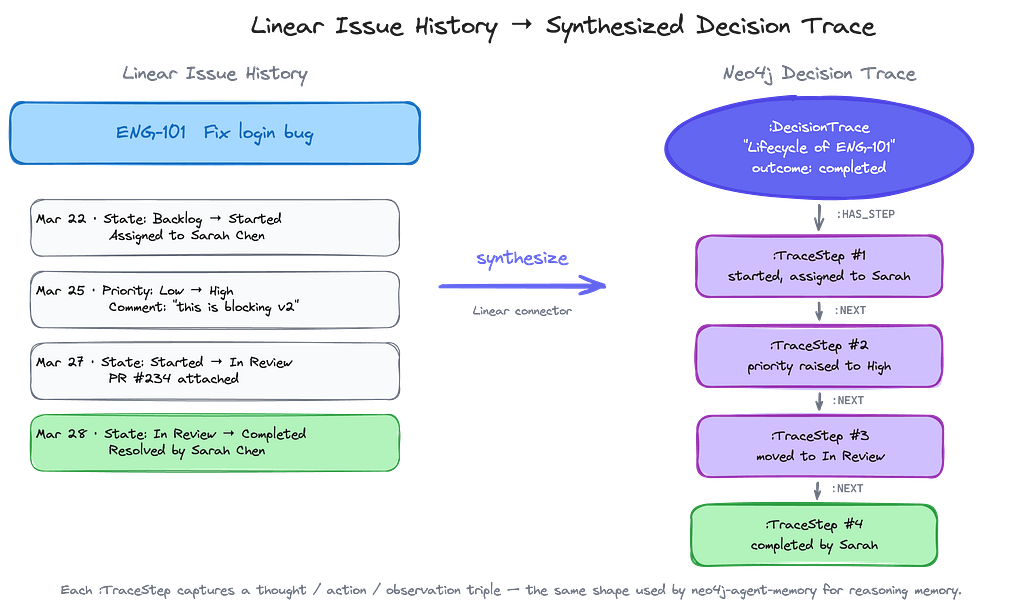
The Linear connector doesn’t just import the current state of your workspace — it walks each issue’s history and synthesizes decision traces from state transitions, assignment changes, and priority bumps.
Every issue with two or more history entries becomes a :DecisionTrace, with each transition becoming a :TraceStep (thought / action / observation triple), and the issue’s current state becoming the trace outcome.
So when you ask the agent “What decisions were made about ENG-101?” it doesn’t need to invent an answer from a chat log. It traverses the trace.
Once it’s running, drop these into the chat panel and watch the graph view light up:
- “What’s blocking ENG-101?” — multi-hop traversal of :BLOCKS / :BLOCKED_BY
- “Who has the most open issues right now?” — aggregation across :ASSIGNED_TO
- “Show me all blockers for the v2 Launch project.” — joins issue dependencies with project membership
- “Are there resolved comment threads on ENG-101?” — finds :Comment nodes with :RESOLVED_BY
- “How did ENG-101 get to its current state?” — traverses the decision traceThese are queries that would require clicking through three or four different Linear views. In the graph, they’re a single Cypher pattern.

A Claude Code Session History Context Graph
The Linear connector taps into a remote SaaS API. The Claude Code connector does something more personal: it reads the JSONL session files Claude Code writes to ~/.claude/projects/ every time you use it, and turns your own development history into a queryable graph.
No API keys. No external services. All local. And surprisingly revealing.

uvx create-context-graph my-dev-graph \
--domain software-engineering \
--framework claude-agent-sdk \
--connector claude-code
By default, this imports sessions for the project matching your current working directory. Want everything across every project you’ve ever used Claude Code on? Use –claude-code-scope all
There are several useful filters: –claude-code-since 2026-03-01 to limit by date, –claude-code-max-sessions 50 for the most recent N, –claude-code-content none to import metadata only without message text. Pick what makes sense for your privacy posture and how big your session history is.
Every session JSONL becomes a connected subgraph:

Plus two synthesized entity types that are the real payoff:
:Decision nodes are extracted from four signals in your sessions:
- User corrections — when you redirect the agent (“No, use OAuth2 instead of JWT”), the original approach becomes a :REJECTED :Alternative and your correction becomes the :CHOSE one.
- Deliberation markers — when the agent discusses trade-offs explicitly, the alternatives and reasoning are captured.
- Error-resolution cycles — failed tool calls that the agent then fixes get linked as decisions about how to fix the problem.
- Dependency changes — every pip install, npm install, etc. is captured as a dependency decision.
Each decision gets a confidence score from 0.0 to 1.0.
:Preference nodes are extracted from explicit statements (“always use single quotes”, “prefer FastAPI over Flask”) and from behavioral patterns (you keep installing pytest and ruff across projects, so those become inferred tool preferences). Confidence increases the more sessions a preference appears in.

The generated agent ships with a tailored toolset for this kind of data:
- “What are my coding preferences?” — surfaces your inferred style with confidence scores
- “Show me the history of config.py” – every session that touched a file
- “What errors have I encountered most often?” — a personal pattern map of your debugging life
- “What decisions have I made about authentication?” — traverses :Decision nodes by topic
- “Trace the reasoning for yesterday’s session” — replays the tool call chain
- “What tools do I use most?” — your personal usage analytics
Data Privacy
Worth being explicit because the data is sensitive: the connector reads only your local ~/.claude/projects/ directory, never modifies the original files, and automatically redacts secrets (API keys, tokens, passwords, connection strings) before storage. By default, message content is truncated to 2000 characters; –claude-code-content none stores metadata only. For the most sensitive work, point Neo4j at a local instance (e.g. Docker or Neo4j Desktop).
Composing Data From Multiple Sources With Create Context Graph Data Connectors
The Create Context Graph data connectors are composable. For example, to combine data from Claude Code session history, GitHub, and Linear:
uvx create-context-graph my-full-dev-graph \
--domain software-engineering \
--framework pydanticai \
--connector claude-code \
--connector github \
--connector linear
Now the same agent can correlate:
- The why (decisions extracted from your Claude Code sessions)
- The what (commits and PRs from GitHub)
- The work (issues, projects, and cycles from Linear)
All as a single connected graph. “Which issues did I make architectural decisions about, and which PRs implemented them?” becomes a real question with a real answer.
By using the POLE+O data model as a base we can implement a cross-domain type system. Once you’ve imported a :Person from Linear and a :Person from Claude Code’s git history with the same email, they’re the same node. The graph stitches your tools together at the entity level – without you writing a single line of integration code.
For the curious, here’s the stack that gets generated:
- Backend: FastAPI + Python, agent framework of your choice
- Frontend: Next.js 15 (App Router) + Chakra UI v3 + TypeScript
- Visualization: NVL (Neo4j Visualization Library) for the live graph view
- Streaming: Framer Motion + SSE for token-by-token streaming and tool event animations
- Storage: Neo4j (Aura, Docker, or neo4j-local)
- Memory: neo4j-agent-memory – the underlying graph memory package
The generated project is a real, idiomatic codebase. Edit the agent file. Add custom Cypher tools. Swap the LLM. Customize data/ontology.yaml to add domain-specific entity types. It’s yours.
The fastest way to feel the difference between a flat-memory agent and a context-graph agent is to run one. The website has a sandbox tour at the top of the homepage, but the real moment is when you scaffold an app against your own Linear workspace or your own Claude Code history and ask it a question that you couldn’t have answered without the graph.
uvx create-context-graph my-app --domain software-engineering \
--framework pydanticai --demo-data
A few suggested entry points based on what you’re into:
- You build agents and want to see what graph memory feels like: scaffold the personal-knowledge or software-engineering domain with –demo-data, then ask the agent multi-hop questions and watch the graph viz.
- You want to put your own work data into a graph: use –connector linear against your real workspace, or –connector claude-code against your local session history.
- You’re evaluating frameworks: scaffold the same domain with two different –framework values and compare the agent file. Same tools, different ergonomics.
- You want to understand decision traces: the Decision Traces from Google Workspace tutorial walks through reasoning memory end to end.
Everything is open source on GitHub at neo4j-labs/create-context-graph, Apache 2.0. Issues and PRs welcome — this is a Labs project, which means it’s actively maintained and community-supported, but APIs may evolve as we learn what people are building.
If you build something interesting, I want to see it. Find me in the Neo4j Community or open a discussion on the repo.
The agent isn’t the hard part anymore. Memory is. Let’s give the agents a graph to think in.
📌 About: Create Context Graph is a Neo4j Labs project. Built on top of neo4j-agent-memory. Docs at create-context-graph.dev.
If you like it, please 🌟 on GitHub
Introducing Create Context Graph was originally published in Neo4j Developer Blog on Medium, where people are continuing the conversation by highlighting and responding to this story.
Share Article


Explore
Related Articles


1 of 3: The difference between a graph, a knowledge graph, and a context graph

2 of 3: Why graphs, knowledge graphs, and context graphs matter to customers