Thinking in Paths to Stop Lateral Movement
1. The Problem Domain: The "Sideways" Threat
Most security strategies are built on a "perimeter" mindset. However, modern breaches rarely involve an attacker landing directly on their target. Instead, they find a weak point and move "sideways" through the network.
-
Siloed Visibility: Vulnerability scanners see bugs, and firewalls see rules, but neither sees the connection between a public-facing vulnerability and a private "Crown Jewel" database.
-
The Kill Chain Blindspot: Traditional tools fail to account for "chained exploitation"—where a series of low-risk issues are combined to achieve a high-impact breach.
-
Alert Overload: Without understanding the path to a critical asset, security teams treat every server breach with the same level of panic, leading to inefficient incident response.
2. The Solution: Attack Path Analysis (APA)
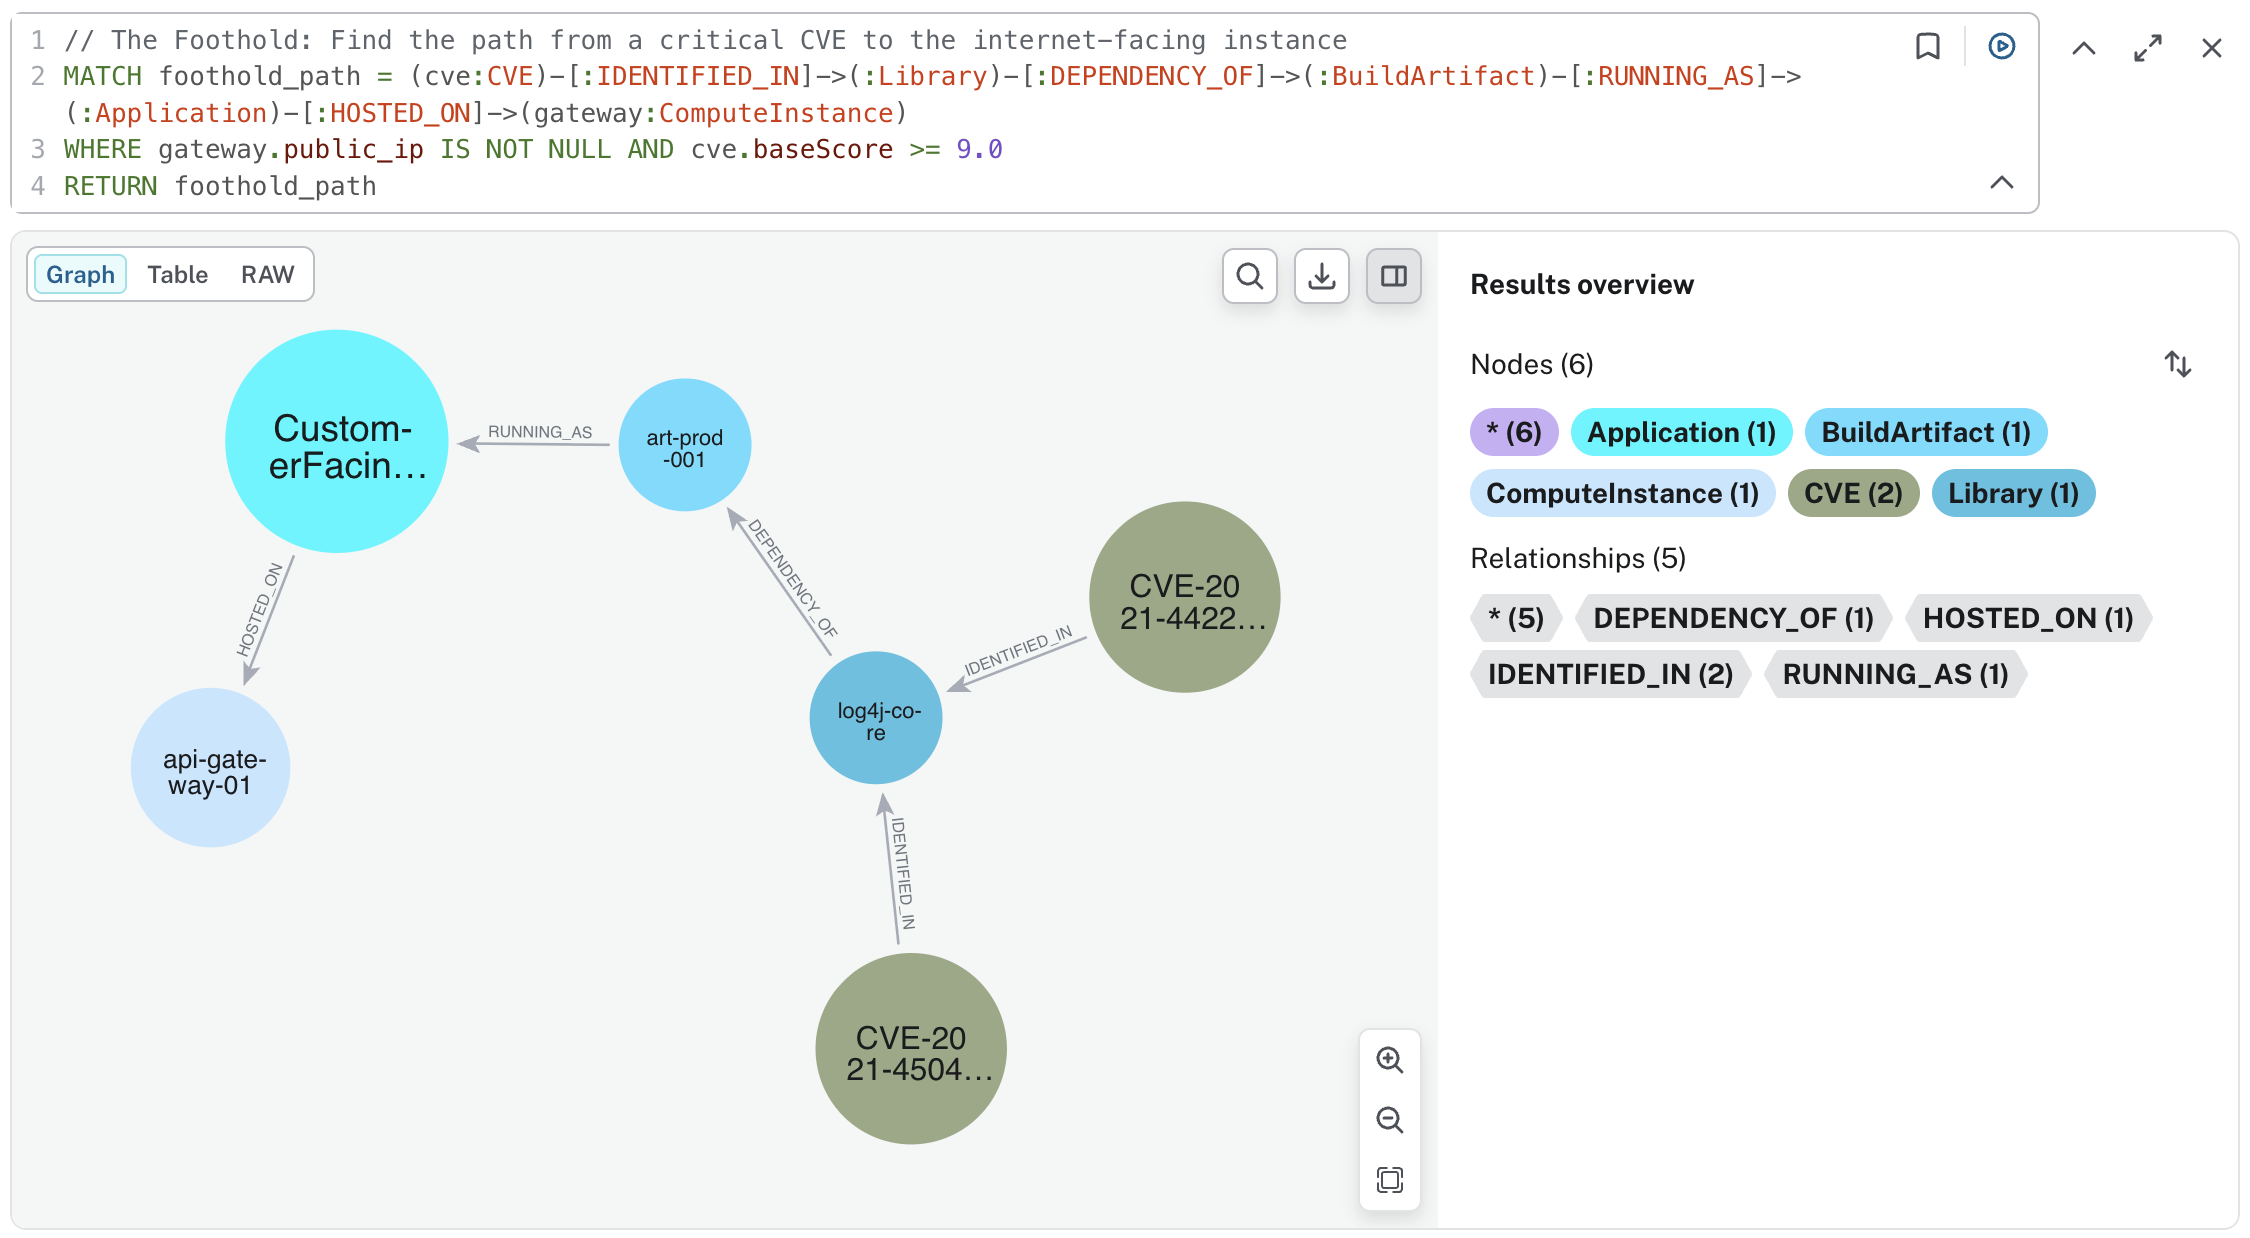
The Cyber APA framework uses Neo4j to build a "Security Blueprint." By mapping how an attacker travels from an initial foothold to your organization’s most valuable data, you can move from reactive patching to active disruption.
This solution enables:
1. Kill Chain Visualization: Seeing the exact sequence of hops an intruder would take.
2. Lateral Movement Simulation: Mapping internal network accessibility (CAN_REACH) between compute instances.
3. Crown Jewel Protection: Explicitly identifying the paths that terminate at Tier-0 (P0) applications or sensitive S3 buckets.
3. The Graph Advantage: Identifying Choke Points
In a graph, security is no longer a list of points; it is a web of relationships. This provides three strategic advantages for CTOs and Architects:
3.1. 1. Multi-Hop Path Traversal
Neo4j can traverse 5, 10, or 20 hops in milliseconds to answer: "Can an attacker on this web server eventually reach my PII database?" Relational databases and spreadsheets cannot perform this type of deep "reachability" analysis.
4. The APA Schema: Mapping the Journey
The Cyber APA schema extends the standard VPEM model by adding the critical CAN_REACH relationship between compute instances.
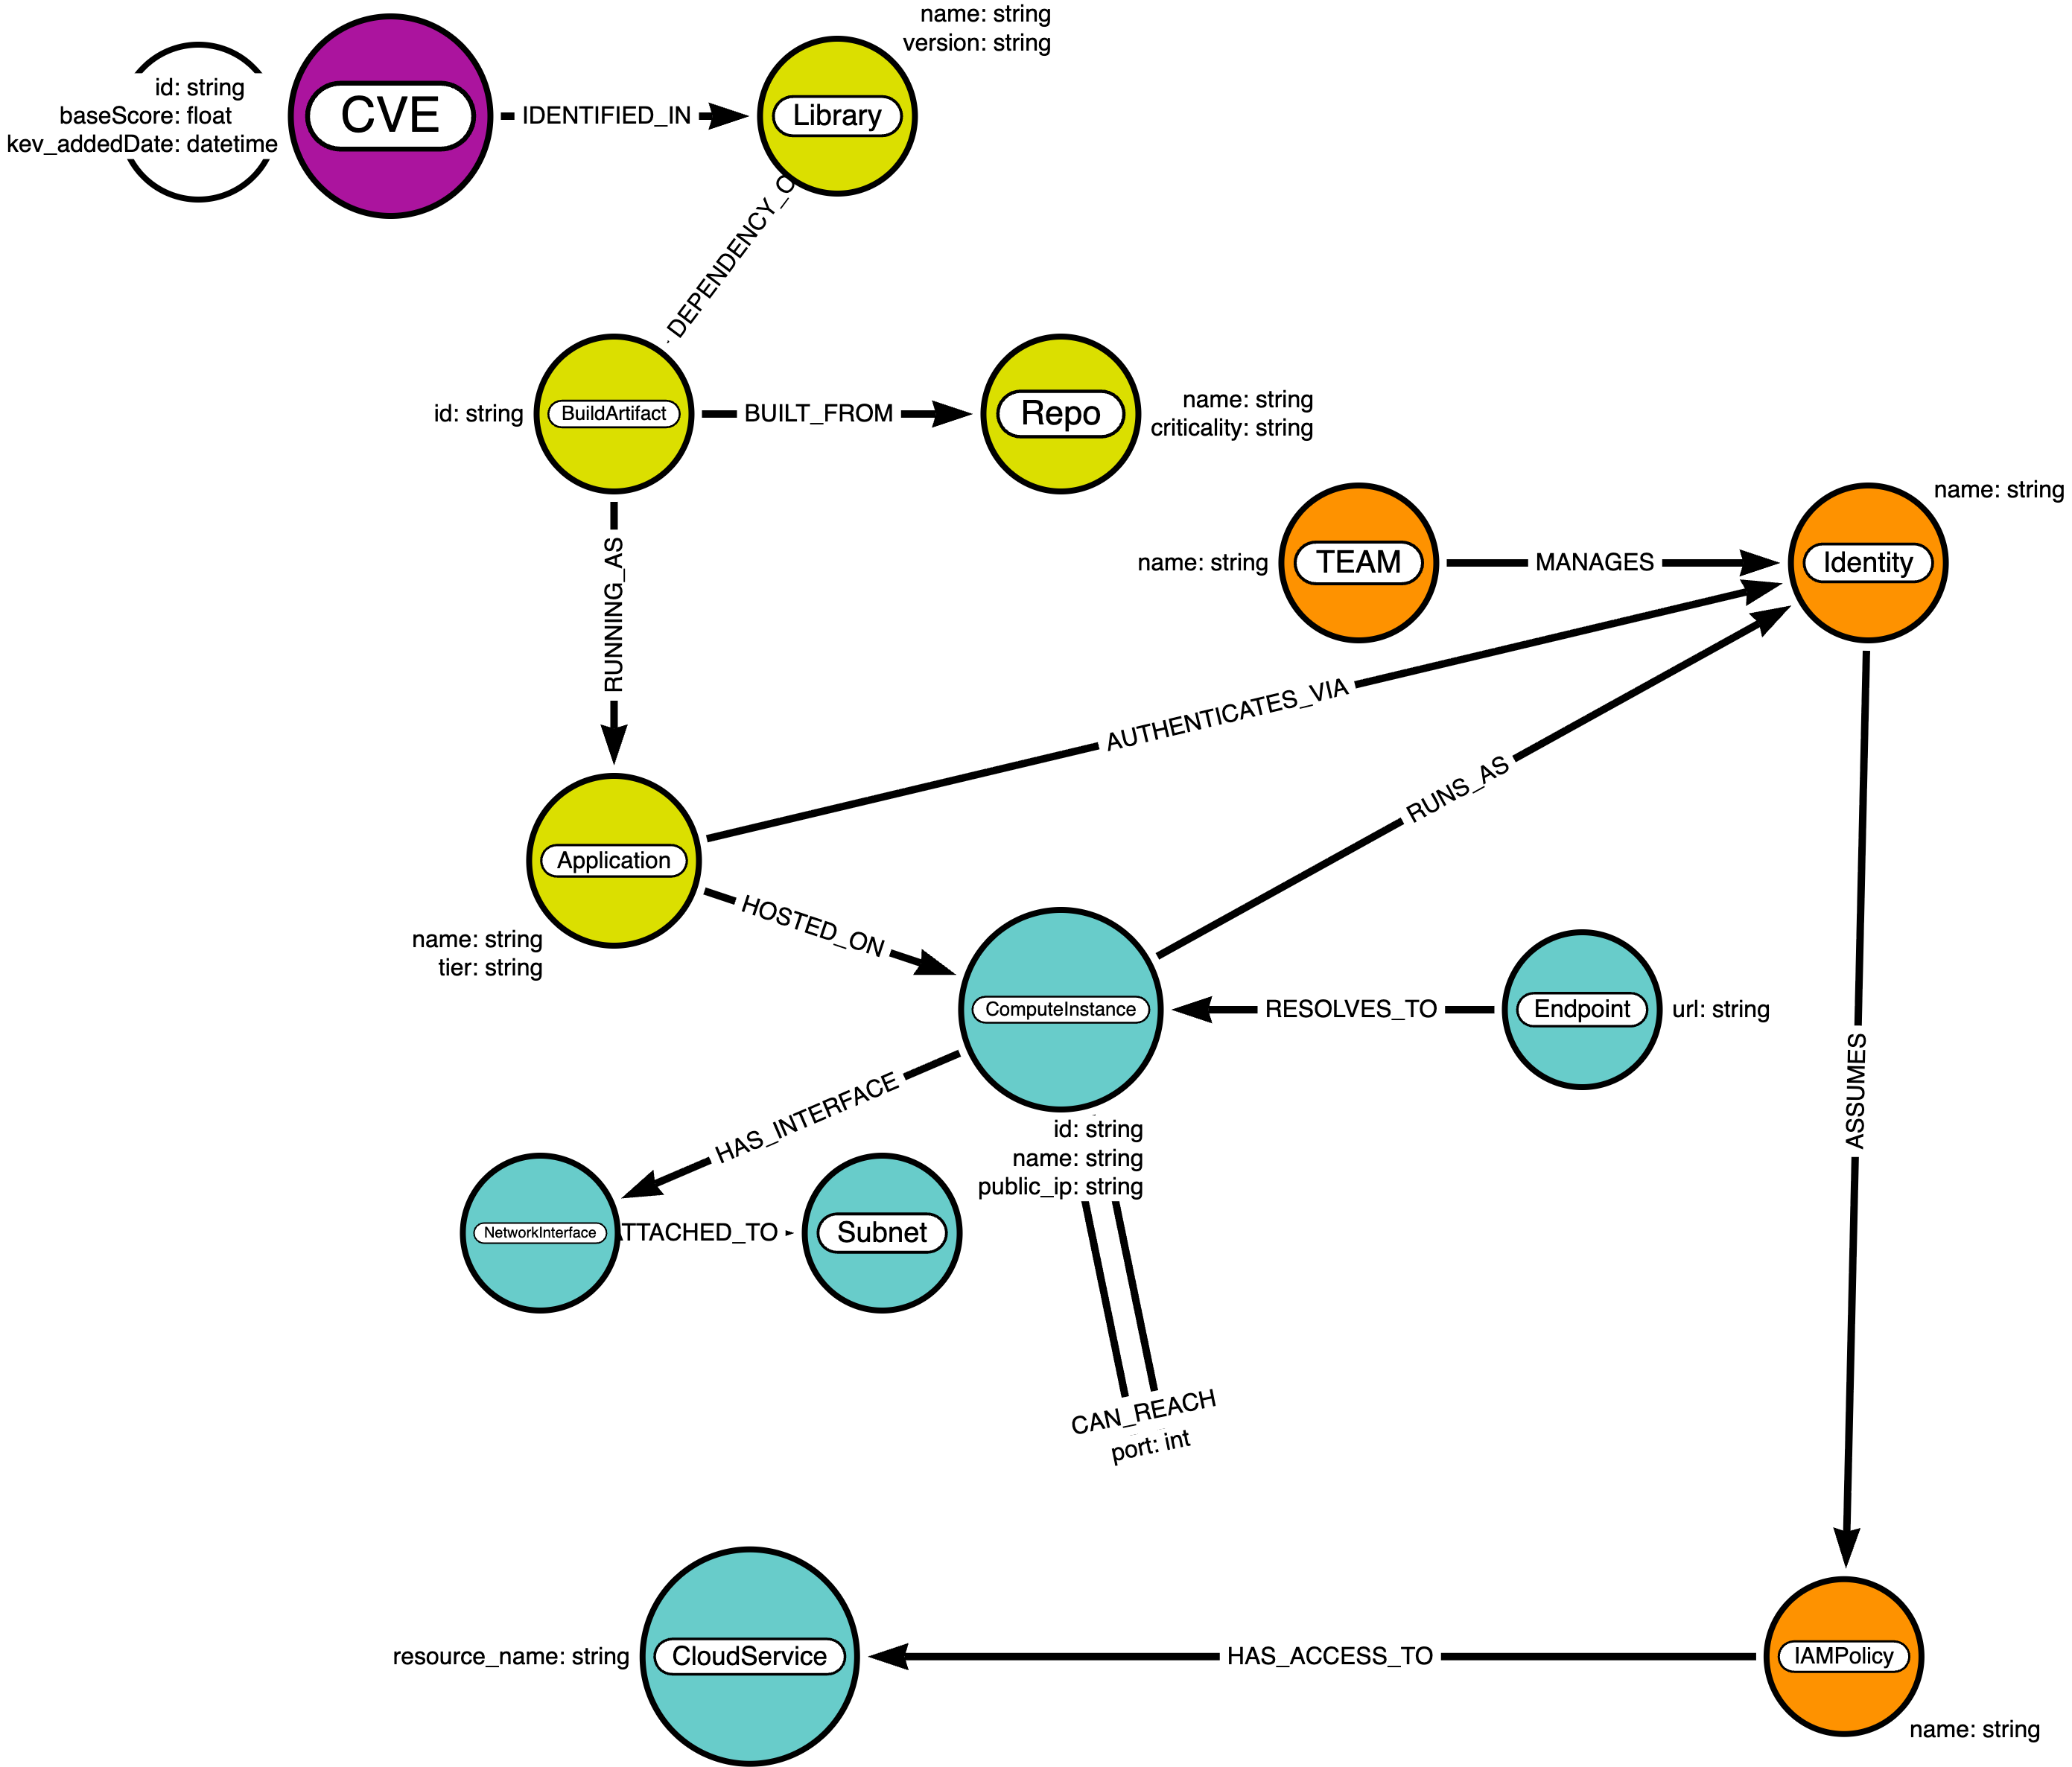
| Relationship | Security Context |
|---|---|
|
Represents lateral movement potential between internal network segments. |
|
Links a server to its Identity, showing what permissions a hacker inherits. |
|
The final hop in the kill chain—connecting a compromised identity to a Cloud Service. |
5. Next Steps: Disrupting the Attacker
To evolve your security posture from "Vulnerability Management" to "Exposure Management," consider these steps:
-
Ingest Network Topology: Import VPC and subnet reachability data into your Neo4j Security Knowledge Graph.
-
Run Pathfinding Queries: Use Cypher to find the shortest paths between
[:Endpoint]and[:Application {tier: 'P0'}]. -
Prioritize Micro-segmentation: Use graph insights to identify where a single
DENYrule would break the most dangerous attack paths.
Explore the technical implementation and Cypher queries in the Cyber-APA Repository.