Mastering the Software Supply Chain with SBOM Graphs
1. The Problem Domain: The "Hidden Ingredient" Crisis
Modern software is rarely built from scratch. It is assembled from hundreds of third-party libraries, which in turn rely on other libraries. This creates a deep, invisible chain of transitive dependencies.
-
The Transitive Blindspot: Traditional security tools often only scan "top-level" dependencies. If a vulnerability exists four layers deep in a utility library, most systems won’t see it.
-
Zero-Day Panic: When a high-profile vulnerability (like Log4j) is announced, organizations spend weeks manually searching codebases to find where that specific "ingredient" is used.
-
Broken Lineage: There is a massive gap between the code a developer writes and the server where it actually runs. Without Code-to-Cloud visibility, you cannot prioritize patches based on actual deployment exposure.
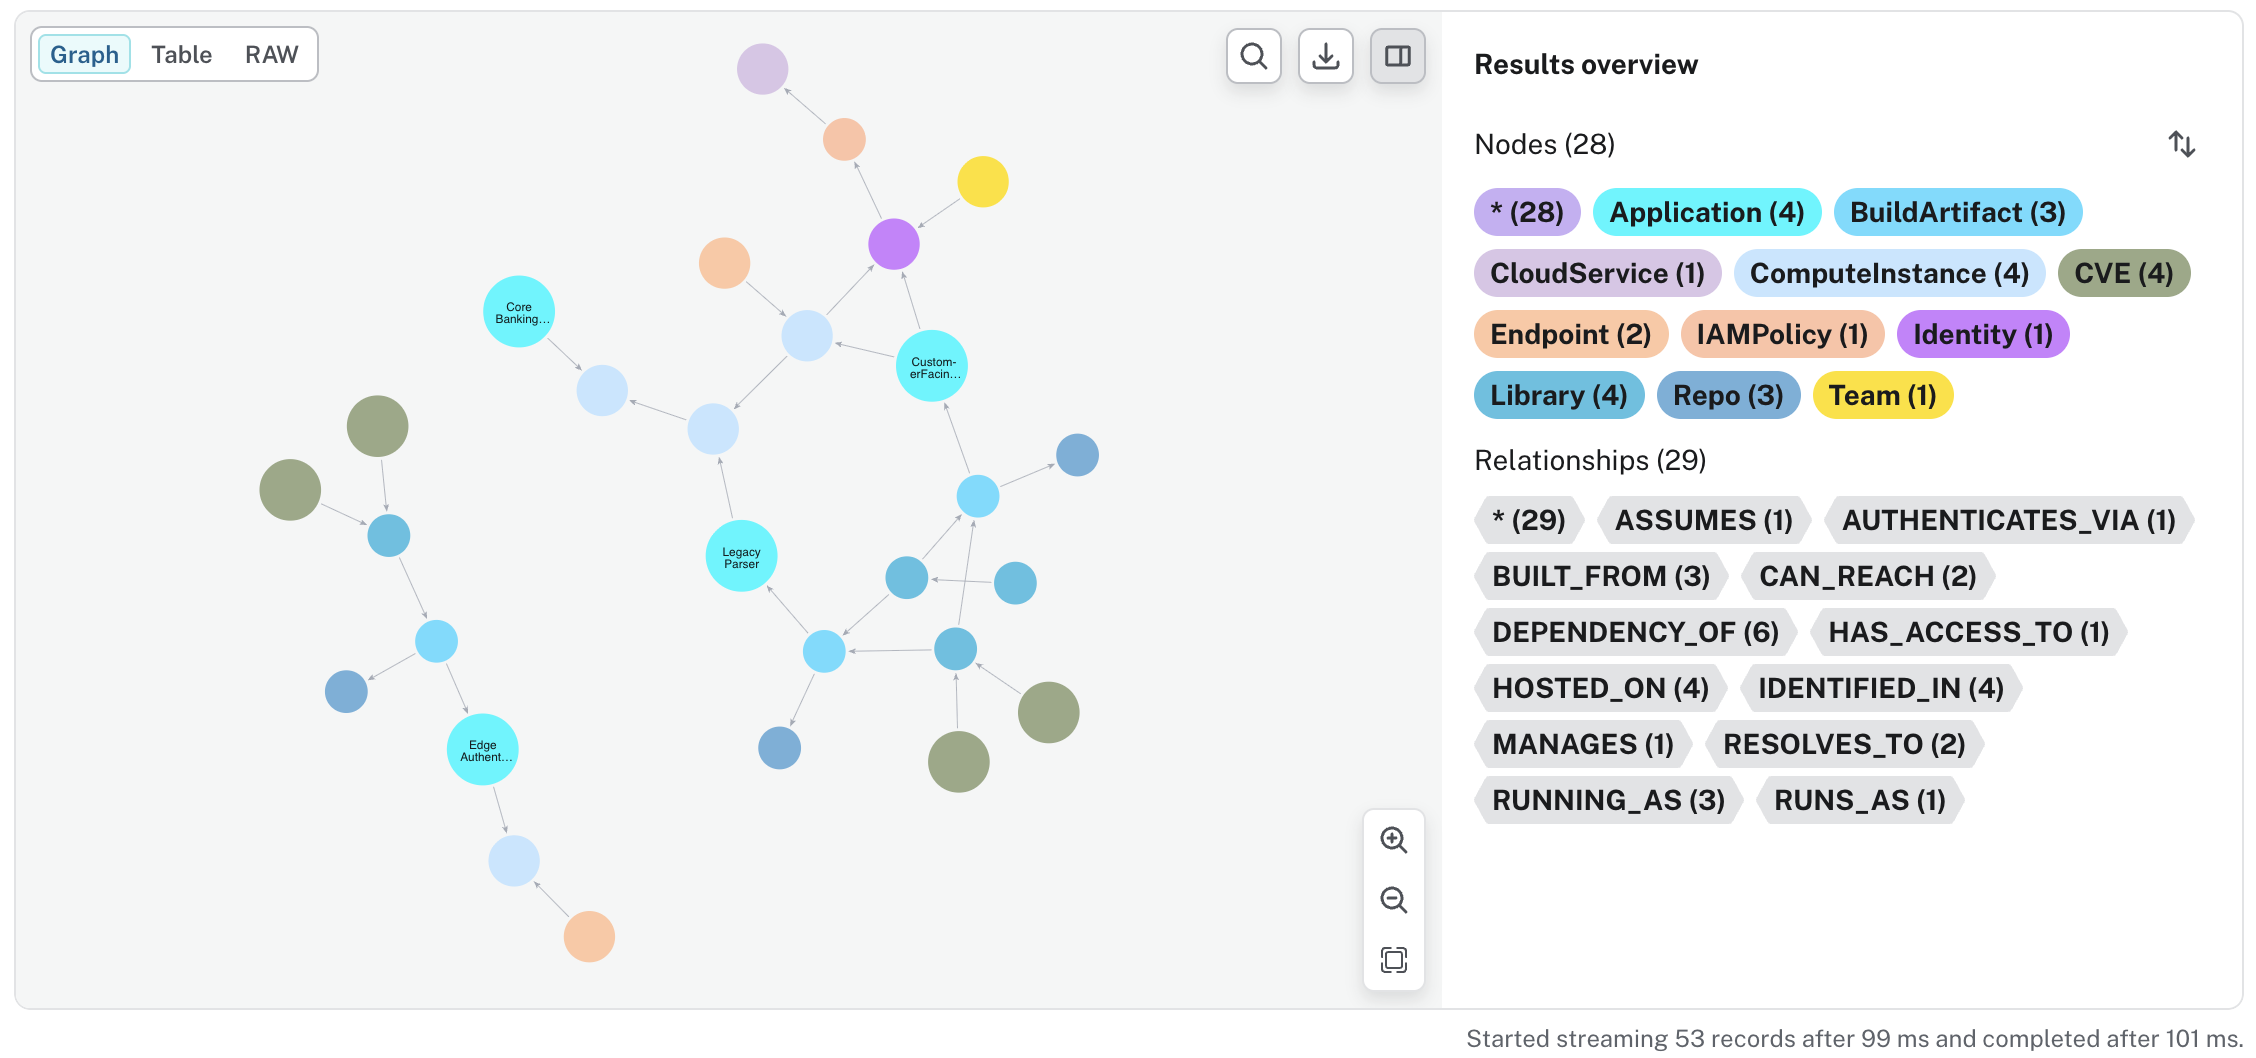
2. The Solution: A Graph-Based Software Bill of Materials (SBOM)
An SBOM is a comprehensive, nested list of every component in your software. By modeling this in Neo4j, organizations move from static spreadsheets to a dynamic Software Supply Chain Graph.
The SBOM Graph provides:
1. Full Ingredient Traceability: Every library, version, and license mapped recursively.
2. Vulnerability Enrichment: Automatic correlation of components with CVE data and CISA KEV status.
3. Code-to-Cloud Mapping: Linking specific code artifacts directly to the ComputeInstances where they are running in production.
3. The Graph Advantage: Total Code-to-Cloud Traceability
Software supply chains are inherently recursive. Neo4j’s graph engine is uniquely suited to navigate these many-to-many relationships that flat databases simply cannot handle.
3.1. 1. Transitive Dependency Traversal
Neo4j can instantly trace a path from a low-level vulnerability up through shared internal utilities to every affected business application. This reveals the "hidden" risk that traditional scanners miss.
3.2. 2. Zero-Day Impact Analysis
In the event of a new "in-the-wild" exploit, a single Cypher query can identify every internet-facing server running the compromised code. This reduces response time from weeks to seconds.
3.3. 3. Remediation Efficiency: Finding Chokepoints
Instead of asking teams to patch 500 different apps, the graph can identify a single "Chokepoint Library"—a shared internal component that, if updated, resolves the risk for the entire enterprise.
| Relationship | Strategic Value |
|---|---|
|
Models the recursive "ingredients" list, enabling multi-layer transitive analysis. |
|
Connects compiled artifacts back to the original source code repository for developer accountability. |
|
Bridges the gap between the build pipeline and the live production environment. |
4. Next Steps: Securing Your Digital Supply Chain
Transitioning to a graph-based SBOM allows organizations to meet regulatory requirements (like Executive Order 14028) while drastically reducing cyber risk.
-
Generate and Ingest SBOMs: Standardize on formats like CycloneDX or SPDX and load them into Neo4j.
-
Correlate with Infrastructure: Link your SBOM data to your cloud asset inventory to see where vulnerable code is "live."
-
Automate Guardrails: Integrate the graph into your CI/CD pipeline to block the deployment of any artifact containing a "Critical" transitive vulnerability.
For implementation details and pre-built Cypher queries, visit the Cyber-SBOM Repository.