Trophic Cascade: A Wolf's Role in the Ecosystem of Yellowstone
This interactive Neo4j graph tutorial uncovers a recent ecological phenomenon that has infiltrated the northern half of Yellowstone.
Introduction
A trophic cascade is an ecological process which starts at the top of the food chain and tumbles all the way down to the bottom. A classic example is what happened in the Yellowstone National Park in the United States, when wolves were reintroduced in 1995 after a 70-year hiatus. This triggered a massive trophic cascade, involving different predators, prey, plants and even physical landscape. Wolf re-introduction may represent an effective approach for passively restoring ecosystems.
Problem
Yellowstone’s northern trophic cascade involves huge ecosystems spanning multiple trophic levels. It may prove a challenge in studying these inter-dependencies and their effect on biomass levels across the entire system.
Solution
Graphs provide an apt and intuitive representation of the ecological phenomenon above. To effectively understand and study how one changed factor can effect a particular system behavior/response, it’d be most helpful to be able to visualize the flow of causal relationships from one actor to its reactor(s). How does re-introducing wolves improve the stability of rivers? How are the landscape features dependent on the density and behaviour of the mammals? Will the Yellowstone ecosystem be disrupted or return to equilibrium if bear-hunting increases? Let’s find out!
Data Model: A Causal Loop Implementation
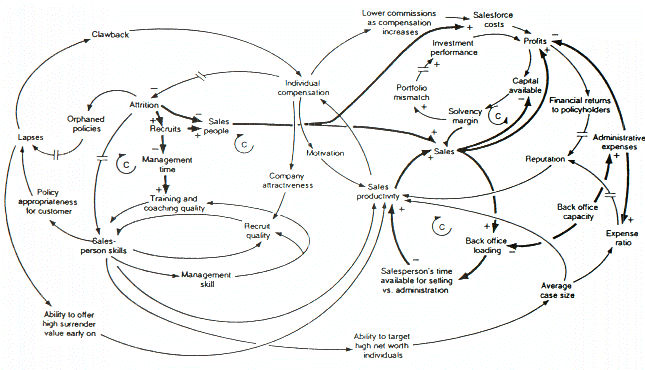
A causal loop diagram (CLD) explains the behavior of a system by visualizing a collection of connected nodes, and the feedback loops created by these connections.

The simplest entity in a CLD depicts the relationship between a cause and its direct effect, which can then double as a cause to other effects, and the list goes on…
A cause-and-effect tuple is said to be directly (positively) related if a change in the cause leads to a change in its effect in the same direction, and inversely (negatively) related if otherwise.
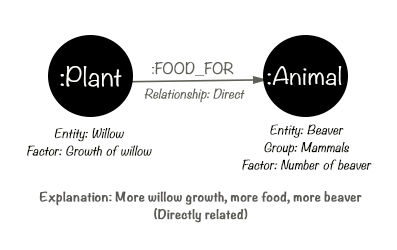
'NOTE - For visualization simplicity in this GraphGist (see query (a) and (b)), the actual casual occurrence of each entity in Yellowstone’s trophic cascade is included in its respective node (independent of the CLD model).'
Closed cycles, defined as either a reinforcing or a balancing loop, are very important features of CLDs. A reinforcing loop is a cycle of nodes in which an increase (decrease) in any variable propagates through the cycle and returns as an increase (decrease) to the same variable. If a variable varies in a reinforcing loop, its effect of the change reinforces the initial variation. Without breaking the loop, the system will be caught in a vicious cycles of circular chain reactions. Conversely, in a balancing loop, a change in any variable propagates through and returns as an opposite deviation to the same variable. Balancing loops are thus usually associated with system stability and equilibrium.
(Reinforcing loops: Even number of 'inverse' links, Balancing loops: Odd number of 'inverse' links)
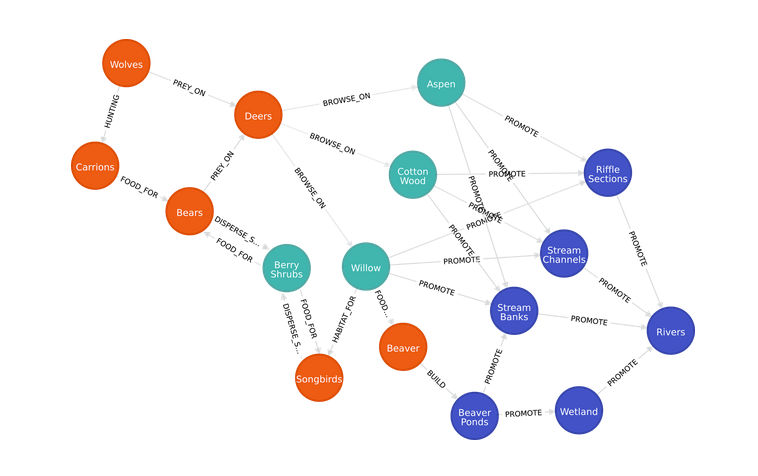
Graph databases have the potential to effectively model the features of huge complex systems, which are gaining prevalence in today’s 'Big Data' scene. The simplified graph data model below represents how part of the Yellowstone ecosystem co-relates in the aforementioned phenomenon, and the subsequent Cypher queries illustrate some valuable insights attainable.
How exactly can the number of wolves affect the stability of rivers in Yellowstone?
The beauty of this trophic cascade lies in how the addition of mere 98 wolves could effect such an extensive ecological change that propagated through to the behavior of the rivers. A simple Cypher query below models the complex interdependencies beneath.
MATCH path = (:Animal {Entity:"Wolves"})-[*]->(:Landscape {Entity:"Rivers"})
WITH [x IN nodes(path) | x.Yellowstone] AS factor, rand() AS number
RETURN factor AS How_Wolves_Affect_RiverStability
ORDER BY number
LIMIT 5
How exactly can the number of wolves affect the stability of rivers in Yellowstone?
Note that the table output above is limited to 5 entries. To obtain details of all possible causal relationships/paths from "Wolves" to "Rivers" (for a CLD model), run the Cypher query:
MATCH path = ({Entity:"Wolves"})-[*]->({Entity:"Rivers"}) RETURN pathHow are landscape features affected by mammals in Yellowstone?
Or more broadly, the interdependencies between different entity groups (e.g. specific animal classes) may also be modeled in a similar (simple yet effective) fashion.
MATCH path = (:Animal {Group:"Mammal"})-[*]->(:Landscape)
WITH [x IN nodes(path) | x.Yellowstone] AS factor, rand() AS number
RETURN factor AS How_Mammals_Affect_LandscapeFeatures
ORDER BY number
LIMIT 5
Note that the table output above is limited to 5 entries. To obtain details of all possible causal relationships/paths from all "Mammals" to all "Landscape" (for a CLD model), run the Cypher query:
MATCH path = (:Animal {Group:"Mammal"})-[*]->(:Landscape) RETURN pathIf bear-hunting increases and more bears are killed, will the Yellowstone ecosystem be disrupted exponentially (until bears go extinct!) or return to equilibrium (somewhat status quo)?
In many causal loop implementations, valuable insights are attainable from identifying closed loops, and then determining if they are reinforcing (even number of inverse links within the loop) or balancing (odd number). This helps to reveal 'Reference Behaviour Patterns', i.e. possible dynamic behaviours of a system. Coupled with an initial assumption, e.g. Node 1 of the loop increases, we can predict the corresponding system outcome - reinforcing loops are associated with exponential increases/decreases, while balancing loops tend to reach a plateau.
MATCH path = (n)-[*]->(n)
WITH [x IN nodes(path) | x.Yellowstone] AS factor, [r IN relationships(path) | r.Relationship] AS rel
RETURN factor AS Causal_Loop, rel AS Links
ORDER BY size(factor) DESC
LIMIT 1
In the causal loop identified above, we have an even number of inverse links, signifying a reinforcing loop. Thus, if the number of bears drops autonomously, it is likely to disrupt the system and lead to an exponential decrease in the bear population.
Assumption: Berries have a greater impact on bears' diet than deers.
References
Ripple, W. J., & Beschta, R. L. Trophic cascades in Yellowstone: The first 15 years after wolf reintroduction. Biological Conservation. Retrieved June 9, 2014, from https://web.archive.org/web/20171101203229/http://www.cof.orst.edu/leopold/papers/RippleBeschtaYellowstone_BioConserv.pdf
Monbiot, G. (Director). (2013). For more wonder, rewild the world. United States: TED Talks. Retrieved June 9, 2014, from https://www.ted.com/talks/george_monbiot_for_more_wonder_rewild_the_world
Causal Loop Diagram. (n.d.). Retrieved June 10, 2014, from https://en.wikipedia.org/wiki/Causal_loop_diagram
Is this page helpful?