Comparing the Eating Habits of Two Generations in the US
Comparing the Eating Habits of Two Generations in the US
Alicia Powers <[email protected]>
twitter: @apowers411
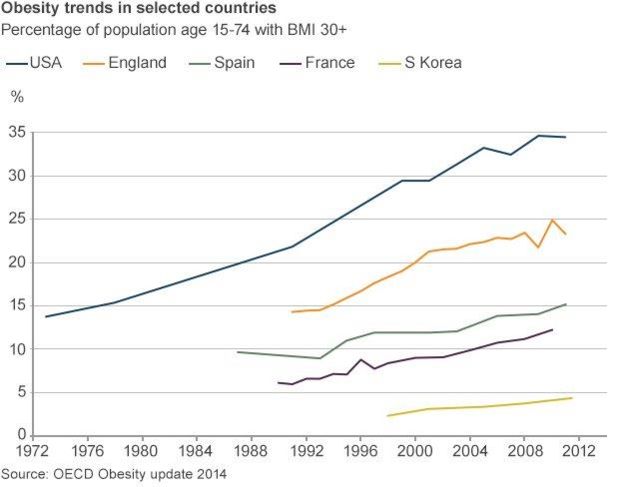
As an introduction to Neo4j, I used open source data from the Center for Disease Control and Prevention’s National Health and Nutrition Examination Survey to look at the eating habits of Americans. I was inspired to look at this problem when I saw the graph below on Twitter. The graph shows that in recent years the obesity rate in many countries has increased. I wondered if the increase in obesity rate is due to poorer eating habits and higher BMI among the youth or if older people are also seeing an increase in BMI and poor eating habits. One way to understand the differences between generations is to look at how people of different ages are eating.
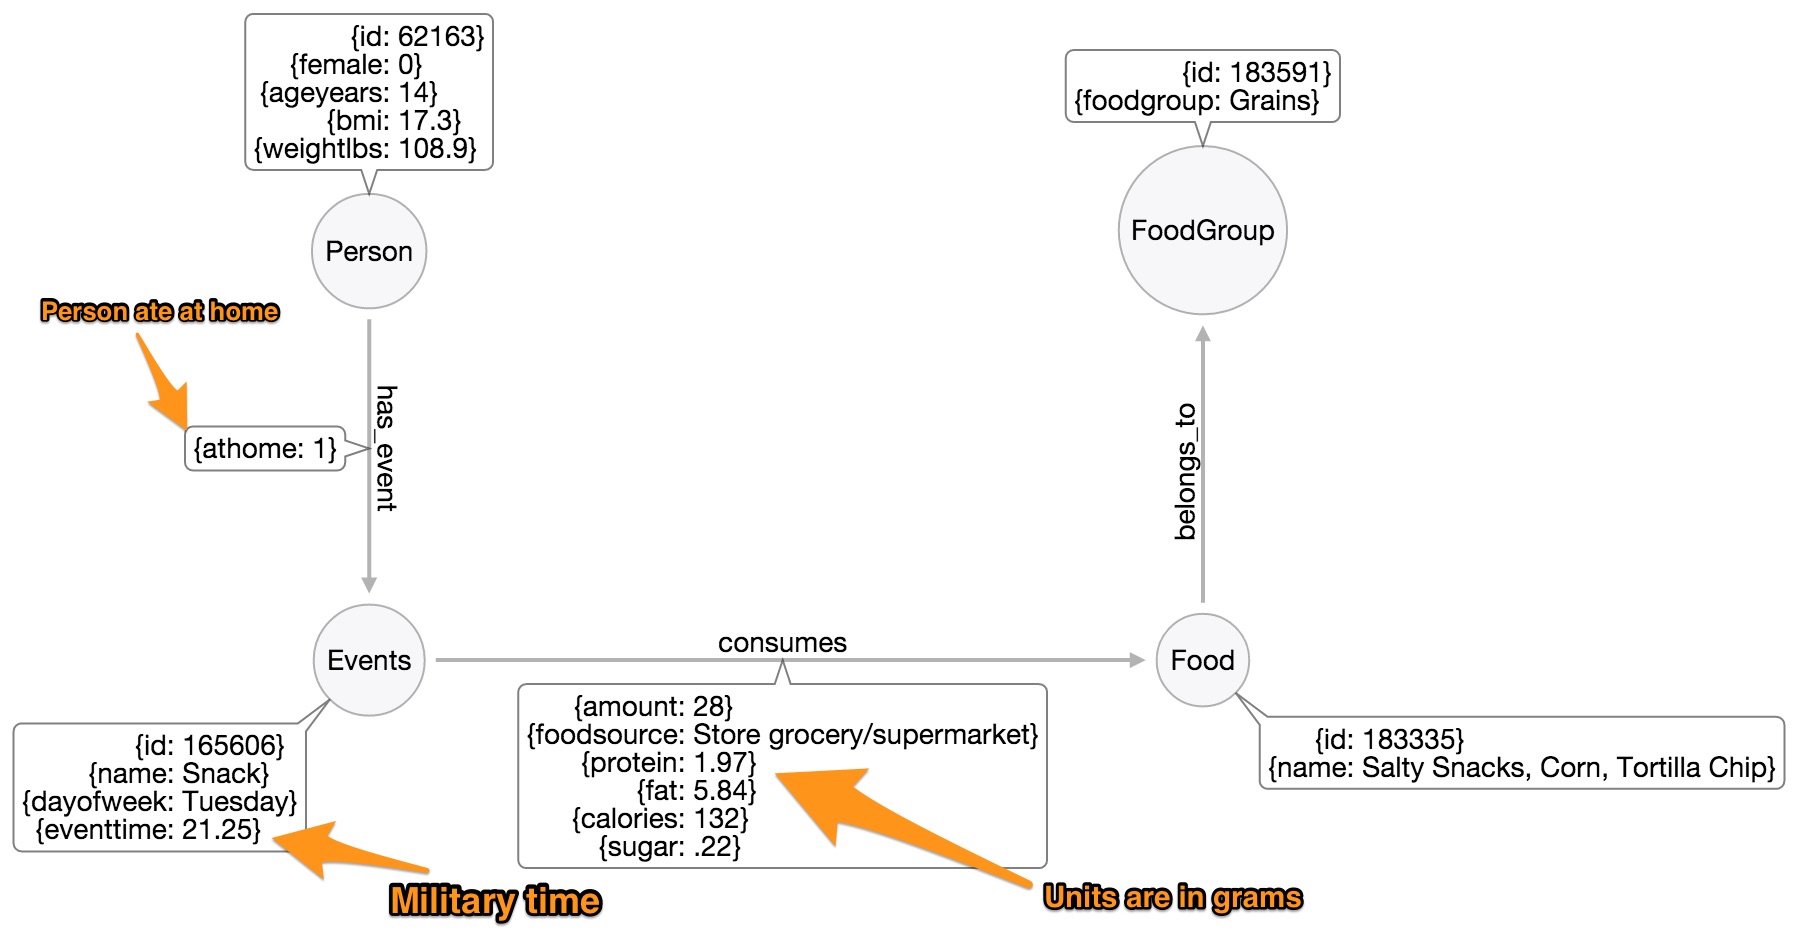
Using the available data, I created the model outlined below. Each person is represented by a node. The label on the node is the person’s age in years. This example only includes people between the ages of 14 and 22 and over the age of 65 so I could look at two different generations. Additional demographic information is included on each person node (e.g gender, BMI, and weight in pounds). The survey tracked people’s eating for two days.
Each person node is connected to at least one eating event node by the relationship 'has_event.' These eating event nodes represent things like snacks, meals and drinks. Eating events have properties like the time and day of the eating event. The 'has_event' relationship has the property of whether the event took place at home or away.
Events (i.e. meals) are linked to Food nodes by the relationship 'consume.' The consume relationship properties detail the amount of food the person ate and its nutritional information. Finally, each food is connected to a food group using a 'belong_to' relationship.
This query sets up the constraints and imports the person level data. The node labels are the ages of each person. Only 19 people were imported for this Gist. The data also includes each person’s BMI. A BMI below 25 is normal. A BMI between 25 and 29.9 is considered overweight and a BMI over 30 is obese.
CREATE CONSTRAINT ON (c:Person) ASSERT c.id is UNIQUE;
CREATE CONSTRAINT ON (e:Events) ASSERT e.id is UNIQUE;
CREATE CONSTRAINT ON (f:Food) ASSERT f.id is UNIQUE;
CREATE CONSTRAINT ON (fg:Food) ASSERT fg.foodgroup is UNIQUE;

USING PERIODIC COMMIT
LOAD CSV WITH HEADERS FROM "https://raw.githubusercontent.com/drpowpow/GraphGist/master/peoplegist.csv" AS line
CREATE (person:Person {id: line.id, ageyears: toFloat(line.ageyears), female: toInt(line.female),bmi:toFloat(line.bmi),  weightlbs:toFloat(line.weightlbs)})

RETURN person
Now the additional food, event and food group nodes are added to the people nodes.
USING PERIODIC COMMIT
LOAD CSV WITH HEADERS FROM "https://raw.githubusercontent.com/drpowpow/GraphGist/master/eventswithfoodgist.csv" AS line
MERGE (event:Events  {id: line.mealid,name:line.eventname, dayofweek: line.dayofweek, eventtime:toFloat(line.eventtime)})
MERGE (food:Food {id:line.foodid, name:line.name})
MERGE (foodgroup:FoodGroup {foodgroup:line.FoodGroup})
This section adds the events. The graph is readable.
USING PERIODIC COMMIT
LOAD CSV WITH HEADERS FROM "https://raw.githubusercontent.com/drpowpow/GraphGist/master/eventswithfoodgist.csv" AS line
MATCH (person:Person {id:line.personid}),(event:Events {id:line.mealid})
MERGE (person)-[:has_event {athome:line.eathome}]->(event);
This section adds the foods. The graph gets more complex.
USING PERIODIC COMMIT
LOAD CSV WITH HEADERS FROM "https://raw.githubusercontent.com/drpowpow/GraphGist/master/eventswithfoodgist.csv" AS line
MATCH (event:Events {id:line.mealid}),(food:Food {id:line.foodid})
MERGE (event)-[:consumes {fat:line.fat,sugar:line.sugar,protein:line.protein,fiber:line.fiber,amount:line.amount,calories:line.calories,foodsource:line.foodsource}]->(food)
This section adds the food groups. The graph gets difficult to read.
USING PERIODIC COMMIT
LOAD CSV WITH HEADERS FROM "https://raw.githubusercontent.com/drpowpow/GraphGist/master/eventswithfoodgist.csv" AS line
MATCH (food:Food {id:line.foodid}),(foodgroup:FoodGroup {foodgroup:line.FoodGroup})
MERGE (food)-[:belongs_to]->(foodgroup)
The complete graph is here.
Now, I use queries to explore the data a bit. Keep in mind this is not a scientific analysis. These queries are designed to understand the data so that we can ask detailed and meaningful questions when querying the entire graph. First, I look at the graphs for two people, one older and one younger.
Here is the older person
You can see this person drinks a lot of water, snacks rarely, and does not appear to like vegetables. Can you guess their BMI? (Hint: It is in the table above)
MATCH (me:Person)-[:has_event]-(meal)-[:consumes]->(food)-[:belongs_to]->(fg)
WHERE me.ageyears=75
RETURN me,meal,food,fg
limit 50
Here is the younger person
This person eats often and a wide variety of foods, especially at breakfast time. This person drinks a lot of water and eats most food groups. Can you guess their BMI? (Hint: It is in the table above)
MATCH (me:Person)-[:has_event]-(meal)-[:consumes]->(food)-[:belongs_to]->(fg)
WHERE me.ageyears=18
RETURN me,meal,food,fg
limit 50
Let’s look at where people’s food comes from. Younger people tend to eat in restaurants, at food trucks, and from vending machines more often. I was personally surprised to see that only older people ate food that they had grown or caught.
MATCH (p:Person)-[v:has_event]->(e:Events)-[r:consumes]->(f:Food)
WITH r.foodsource as Foodsource, count(*) as Total,avg(p.ageyears) as Average_Age, avg(p.bmi) as Average_BMI
Return Foodsource, Total, Average_Age, Average_BMI
ORDER BY Foodsource,Total DESC
Let’s look at who is eating what food groups on average. The food groups are loosely defined. I know Alcohol is not a FoodGroup but it is an easy way to categorize the data. It appears older people are drinking a lot more than younger people. Also sugar substitute is used mostly by older individuals. Younger people are having sports drinks almost exclusively as well as fish and seafood. I’m sure some of these findings are due to querying as small part of the graph but there are some trends here that may be seen when querying the complete graph.
MATCH (n:FoodGroup)-[:belongs_to]-(f)-[]-()-[]-(p)
RETURN n, count(f) as Foods,avg(p.ageyears) as Average_Age ,avg(p.bmi) as Average_BMI
LIMIT 25
Let’s look at who is eating what foods on average. This is a long table but it is pretty informative. I put a collect here so I can see how many people of each age where eating a particular food. The BMI was added just for reference.
MATCH (p:Person)-[v:has_event]->(e:Events)-[r:consumes]->(f:Food)
WITH f.name as Foods, count(*) as Total,collect(p.ageyears) as Ages,collect(p.bmi) as BMI
Return Foods, Total, Ages,BMI
ORDER BY Foods,Total DESC
Conclusion:
Again, this is not a scientific examination but more of a way to discover what questions I should try to answer with the full dataset. It is easy to see some patterns that I would like to explore further. The first would be the role of alcohol use in the health of older people. I would also like to identify people who do not eat a particular food group(s), like the 75-year-old person who ate no vegetables for two days. Does their health suffer as a result? This gist represents a small number of patterns one can look for within these data.
Is this page helpful?