Eurovision Votes
For people who doesn’t know, Eurovision is a song contest amongs European countries. The particularity is that countries must vote to each other to determine the winner.
But, it’s always the same impression each year : Sounds like there is countries that works in gang. Can we somehow reveal this feeling with a little help of Graph ? Let’s see :
The model is very simple
Here is the harvest of data that represents all the Eurovision votes in the 2012, 2013, 2014 and 2015 final session.
Comment : a Voting Country can also be a Candidate Country.
CREATE (Belarus:Country {name:"Belarus", winner:"No"}),
(Romania:Country {name:"Romania", winner:"No"}),
(Malta:Country {name:"Malta", winner:"No"}),
(Switzerland:Country {name:"Switzerland", winner:"No"}),
(Estonia:Country {name:"Estonia", winner:"No"}),
(SanMarino:Country {name:"San Marino", winner:"No"}),
(Armenia:Country {name:"Armenia", winner:"No"}),
(Portugal:Country {name:"Portugal", winner:"No"}),
(Finland:Country {name:"Finland", winner:"No"}),
(Greece:Country {name:"Greece", winner:"No"}),
(UnitedKingdom:Country {name:"United Kingdom", winner:"No"}),
(Georgia:Country {name:"Georgia", winner:"No"}),
(Cyprus:Country {name:"Cyprus", winner:"No"}),
(Serbia:Country {name:"Serbia", winner:"No"}),
(Hungary:Country {name:"Hungary", winner:"No"}),
(Belgium:Country {name:"Belgium", winner:"No"}),
(Denmark:Country {name:"Denmark", winner:"Yes"}),
(Moldova:Country {name:"Moldova", winner:"No"}),
(Lithuania:Country {name:"Lithuania", winner:"No"}),
(Albania:Country {name:"Albania", winner:"No"}),
(Latvia:Country {name:"Latvia", winner:"No"}),
(CzechRepublic:Country {name:"CzechRepublic", winner:"No"}),
(BosniaHerzegovina:Country {name:"Bosnia Herzegovina", winner:"No"}),
(Russia:Country {name:"Russia", winner:"No"}),
(Sweden:Country {name:"Sweden", winner:"Yes"}),
(Ireland:Country {name:"Ireland", winner:"No"}),
(Turkey:Country {name:"Turkey", winner:"No"}),
(Azerbaijan:Country {name:"Azerbaijan", winner:"Yes"}),
(Israel:Country {name:"Israel", winner:"No"}),
(Slovenia:Country {name:"Slovenia", winner:"No"}),
(Austria:Country {name:"Austria", winner:"Yes"}),
(Poland:Country {name:"Poland", winner:"No"}),
(Australia:Country {name:"Australia", winner:"No"}),
(Macedonia:Country {name:"Macedonia", winner:"No"}),
(Iceland:Country {name:"Iceland", winner:"No"}),
(France:Country {name:"France", winner:"No"}),
(Italy:Country {name:"Italy", winner:"No"}),
(Spain:Country {name:"Spain", winner:"No"}),
(Montenegro:Country {name:"Montenegro", winner:"No"}),
(Germany:Country {name:"Germany", winner:"No"}),
(Ukraine:Country {name:"Ukraine", winner:"No"}),
(Bulgaria:Country {name:"Bulgaria", winner:"No"}),
(Croatia:Country {name:"Croatia", winner:"No"}),
(Netherlands:Country {name:"Netherlands", winner:"No"}),
(Slovakia:Country {name:"Slovakia", winner:"No"}),
(Norway:Country {name:"Norway", winner:"No"})

CREATE (Lithuania)-[:VOTE {year:2012,score:5 }]->(Serbia),
(Lithuania)-[:VOTE {year:2012,score:4 }]->(Italy),
(Lithuania)-[:VOTE {year:2012,score:2 }]->(Ukraine),
(Lithuania)-[:VOTE {year:2012,score:12 }]->(Azerbaijan),
(Lithuania)-[:VOTE {year:2012,score:3 }]->(Germany),
(Lithuania)-[:VOTE {year:2012,score:6 }]->(Russia),
(Lithuania)-[:VOTE {year:2012,score:1 }]->(Turkey),
(Lithuania)-[:VOTE {year:2012,score:10 }]->(Sweden),
(Lithuania)-[:VOTE {year:2012,score:7 }]->(Malta),
(Lithuania)-[:VOTE {year:2012,score:8 }]->(Estonia),
(Turkey)-[:VOTE {year:2012,score:3 }]->(Greece),
(Turkey)-[:VOTE {year:2012,score:4 }]->(Romania),
(Turkey)-[:VOTE {year:2012,score:12 }]->(Azerbaijan),
(Turkey)-[:VOTE {year:2012,score:8 }]->(Macedonia),
(Turkey)-[:VOTE {year:2012,score:7 }]->(Russia),
(Turkey)-[:VOTE {year:2012,score:6 }]->(Sweden),
(Turkey)-[:VOTE {year:2012,score:2 }]->(Malta),
(Turkey)-[:VOTE {year:2012,score:1 }]->(Hungary),
(Turkey)-[:VOTE {year:2012,score:10 }]->(BosniaHerzegovina),
(Turkey)-[:VOTE {year:2012,score:5 }]->(Albania),
(Denmark)-[:VOTE {year:2012,score:3 }]->(Italy),
(Denmark)-[:VOTE {year:2012,score:4 }]->(Ireland),
(Denmark)-[:VOTE {year:2012,score:5 }]->(Albania),
(Denmark)-[:VOTE {year:2012,score:6 }]->(Iceland),
(Denmark)-[:VOTE {year:2012,score:1 }]->(Romania),
(Denmark)-[:VOTE {year:2012,score:8 }]->(Russia),
(Denmark)-[:VOTE {year:2012,score:2 }]->(Turkey),
(Denmark)-[:VOTE {year:2012,score:12 }]->(Sweden),
(Denmark)-[:VOTE {year:2012,score:10 }]->(Germany),
(Denmark)-[:VOTE {year:2012,score:7 }]->(Moldova),
(Albania)-[:VOTE {year:2012,score:1 }]->(Serbia),
(Albania)-[:VOTE {year:2012,score:8 }]->(Macedonia),
(Albania)-[:VOTE {year:2012,score:7 }]->(Italy),
(Albania)-[:VOTE {year:2012,score:4 }]->(Azerbaijan),
(Albania)-[:VOTE {year:2012,score:12 }]->(Greece),
(Albania)-[:VOTE {year:2012,score:3 }]->(Russia),
(Albania)-[:VOTE {year:2012,score:10 }]->(Turkey),
(Albania)-[:VOTE {year:2012,score:5 }]->(Sweden),
(Albania)-[:VOTE {year:2012,score:2 }]->(Germany),
(Albania)-[:VOTE {year:2012,score:6 }]->(Cyprus),
(Sweden)-[:VOTE {year:2012,score:10 }]->(Serbia),
(Sweden)-[:VOTE {year:2012,score:4 }]->(Spain),
(Sweden)-[:VOTE {year:2012,score:5 }]->(Ireland),
(Sweden)-[:VOTE {year:2012,score:1 }]->(Albania),
(Sweden)-[:VOTE {year:2012,score:3 }]->(Norway),
(Sweden)-[:VOTE {year:2012,score:7 }]->(Russia),
(Sweden)-[:VOTE {year:2012,score:6 }]->(Turkey),
(Sweden)-[:VOTE {year:2012,score:2 }]->(France),
(Sweden)-[:VOTE {year:2012,score:12 }]->(Cyprus),
(Sweden)-[:VOTE {year:2012,score:8 }]->(Estonia),
(Slovenia)-[:VOTE {year:2012,score:12 }]->(Serbia),
(Slovenia)-[:VOTE {year:2012,score:5 }]->(Italy),
(Slovenia)-[:VOTE {year:2012,score:3 }]->(Albania),
(Slovenia)-[:VOTE {year:2012,score:4 }]->(Iceland),
(Slovenia)-[:VOTE {year:2012,score:6 }]->(Macedonia),
(Slovenia)-[:VOTE {year:2012,score:8 }]->(Russia),
(Slovenia)-[:VOTE {year:2012,score:10 }]->(Sweden),
(Slovenia)-[:VOTE {year:2012,score:2 }]->(Germany),
(Slovenia)-[:VOTE {year:2012,score:7 }]->(BosniaHerzegovina),
(Slovenia)-[:VOTE {year:2012,score:1 }]->(Moldova),
(Netherlands)-[:VOTE {year:2012,score:10 }]->(Serbia),
(Netherlands)-[:VOTE {year:2012,score:6 }]->(Spain),
(Netherlands)-[:VOTE {year:2012,score:1 }]->(Lithuania),
(Netherlands)-[:VOTE {year:2012,score:5 }]->(Ireland),
(Netherlands)-[:VOTE {year:2012,score:3 }]->(Norway),
(Netherlands)-[:VOTE {year:2012,score:4 }]->(Russia),
(Netherlands)-[:VOTE {year:2012,score:8 }]->(Turkey),
(Netherlands)-[:VOTE {year:2012,score:12 }]->(Sweden),
(Netherlands)-[:VOTE {year:2012,score:2 }]->(Germany),
(Netherlands)-[:VOTE {year:2012,score:7 }]->(Estonia),
(Switzerland)-[:VOTE {year:2012,score:10 }]->(Serbia),
(Switzerland)-[:VOTE {year:2012,score:3 }]->(Turkey),
(Switzerland)-[:VOTE {year:2012,score:8 }]->(Spain),
(Switzerland)-[:VOTE {year:2012,score:12 }]->(Albania),
(Switzerland)-[:VOTE {year:2012,score:6 }]->(France),
(Switzerland)-[:VOTE {year:2012,score:7 }]->(Sweden),
(Switzerland)-[:VOTE {year:2012,score:4 }]->(Germany),
(Switzerland)-[:VOTE {year:2012,score:5 }]->(Italy),
(Switzerland)-[:VOTE {year:2012,score:1 }]->(BosniaHerzegovina),
(Switzerland)-[:VOTE {year:2012,score:2 }]->(Moldova),
(SanMarino)-[:VOTE {year:2012,score:6 }]->(Serbia),
(SanMarino)-[:VOTE {year:2012,score:7 }]->(Italy),
(SanMarino)-[:VOTE {year:2012,score:3 }]->(Sweden),
(SanMarino)-[:VOTE {year:2012,score:12 }]->(Albania),
(SanMarino)-[:VOTE {year:2012,score:10 }]->(Russia),
(SanMarino)-[:VOTE {year:2012,score:5 }]->(Turkey),
(SanMarino)-[:VOTE {year:2012,score:4 }]->(Azerbaijan),
(SanMarino)-[:VOTE {year:2012,score:2 }]->(Malta),
(SanMarino)-[:VOTE {year:2012,score:1 }]->(Spain),
(SanMarino)-[:VOTE {year:2012,score:8 }]->(Moldova),
(Estonia)-[:VOTE {year:2012,score:2 }]->(Denmark),
(Estonia)-[:VOTE {year:2012,score:7 }]->(Italy),
(Estonia)-[:VOTE {year:2012,score:3 }]->(Lithuania),
(Estonia)-[:VOTE {year:2012,score:6 }]->(Iceland),
(Estonia)-[:VOTE {year:2012,score:5 }]->(UnitedKingdom),
(Estonia)-[:VOTE {year:2012,score:8 }]->(Russia),
(Estonia)-[:VOTE {year:2012,score:12 }]->(Sweden),
(Estonia)-[:VOTE {year:2012,score:10 }]->(Germany),
(Estonia)-[:VOTE {year:2012,score:4 }]->(Spain),
(Estonia)-[:VOTE {year:2012,score:1 }]->(Ukraine),
(Slovakia)-[:VOTE {year:2012,score:8 }]->(Hungary),
(Slovakia)-[:VOTE {year:2012,score:7 }]->(Serbia),
(Slovakia)-[:VOTE {year:2012,score:5 }]->(Italy),
(Slovakia)-[:VOTE {year:2012,score:6 }]->(Azerbaijan),
(Slovakia)-[:VOTE {year:2012,score:3 }]->(Russia),
(Slovakia)-[:VOTE {year:2012,score:1 }]->(Macedonia),
(Slovakia)-[:VOTE {year:2012,score:4 }]->(Iceland),
(Slovakia)-[:VOTE {year:2012,score:12 }]->(Sweden),
(Slovakia)-[:VOTE {year:2012,score:2 }]->(BosniaHerzegovina),
(Slovakia)-[:VOTE {year:2012,score:10 }]->(Estonia),
(Finland)-[:VOTE {year:2012,score:2 }]->(Serbia),
(Finland)-[:VOTE {year:2012,score:3 }]->(Spain),
(Finland)-[:VOTE {year:2012,score:5 }]->(Denmark),
(Finland)-[:VOTE {year:2012,score:4 }]->(Ireland),
(Finland)-[:VOTE {year:2012,score:6 }]->(Albania),
(Finland)-[:VOTE {year:2012,score:7 }]->(Iceland),
(Finland)-[:VOTE {year:2012,score:8 }]->(Russia),
(Finland)-[:VOTE {year:2012,score:12 }]->(Sweden),
(Finland)-[:VOTE {year:2012,score:1 }]->(Germany),
(Finland)-[:VOTE {year:2012,score:10 }]->(Estonia),
(Romania)-[:VOTE {year:2012,score:7 }]->(Hungary),
(Romania)-[:VOTE {year:2012,score:5 }]->(Serbia),
(Romania)-[:VOTE {year:2012,score:6 }]->(Spain),
(Romania)-[:VOTE {year:2012,score:1 }]->(Albania),
(Romania)-[:VOTE {year:2012,score:8 }]->(Greece),
(Romania)-[:VOTE {year:2012,score:4 }]->(Russia),
(Romania)-[:VOTE {year:2012,score:3 }]->(Turkey),
(Romania)-[:VOTE {year:2012,score:10 }]->(Sweden),
(Romania)-[:VOTE {year:2012,score:2 }]->(Cyprus),
(Romania)-[:VOTE {year:2012,score:12 }]->(Moldova),
(Ireland)-[:VOTE {year:2012,score:2 }]->(Italy),
(Ireland)-[:VOTE {year:2012,score:12 }]->(Sweden),
(Ireland)-[:VOTE {year:2012,score:1 }]->(Azerbaijan),
(Ireland)-[:VOTE {year:2012,score:4 }]->(UnitedKingdom),
(Ireland)-[:VOTE {year:2012,score:5 }]->(Romania),
(Ireland)-[:VOTE {year:2012,score:6 }]->(Russia),
(Ireland)-[:VOTE {year:2012,score:7 }]->(Lithuania),
(Ireland)-[:VOTE {year:2012,score:10 }]->(Germany),
(Ireland)-[:VOTE {year:2012,score:3 }]->(Ukraine),
(Ireland)-[:VOTE {year:2012,score:8 }]->(Estonia),
(Portugal)-[:VOTE {year:2012,score:5 }]->(Serbia),
(Portugal)-[:VOTE {year:2012,score:12 }]->(Spain),
(Portugal)-[:VOTE {year:2012,score:3 }]->(Sweden),
(Portugal)-[:VOTE {year:2012,score:4 }]->(Romania),
(Portugal)-[:VOTE {year:2012,score:8 }]->(Russia),
(Portugal)-[:VOTE {year:2012,score:7 }]->(Estonia),
(Portugal)-[:VOTE {year:2012,score:10 }]->(Germany),
(Portugal)-[:VOTE {year:2012,score:2 }]->(Italy),
(Portugal)-[:VOTE {year:2012,score:1 }]->(Ukraine),
(Portugal)-[:VOTE {year:2012,score:6 }]->(Moldova),
(Belarus)-[:VOTE {year:2012,score:4 }]->(Estonia),
(Belarus)-[:VOTE {year:2012,score:8 }]->(Lithuania),
(Belarus)-[:VOTE {year:2012,score:1 }]->(Ireland),
(Belarus)-[:VOTE {year:2012,score:7 }]->(Azerbaijan),
(Belarus)-[:VOTE {year:2012,score:6 }]->(Sweden),
(Belarus)-[:VOTE {year:2012,score:2 }]->(Macedonia),
(Belarus)-[:VOTE {year:2012,score:12 }]->(Russia),
(Belarus)-[:VOTE {year:2012,score:10 }]->(Ukraine),
(Belarus)-[:VOTE {year:2012,score:3 }]->(Malta),
(Belarus)-[:VOTE {year:2012,score:5 }]->(Moldova),
(Cyprus)-[:VOTE {year:2012,score:7 }]->(Serbia),
(Cyprus)-[:VOTE {year:2012,score:3 }]->(Romania),
(Cyprus)-[:VOTE {year:2012,score:6 }]->(Spain),
(Cyprus)-[:VOTE {year:2012,score:8 }]->(Azerbaijan),
(Cyprus)-[:VOTE {year:2012,score:1 }]->(Iceland),
(Cyprus)-[:VOTE {year:2012,score:12 }]->(Greece),
(Cyprus)-[:VOTE {year:2012,score:5 }]->(Russia),
(Cyprus)-[:VOTE {year:2012,score:10 }]->(Sweden),
(Cyprus)-[:VOTE {year:2012,score:2 }]->(Italy),
(Cyprus)-[:VOTE {year:2012,score:4 }]->(Albania),
(Moldova)-[:VOTE {year:2012,score:3 }]->(Serbia),
(Moldova)-[:VOTE {year:2012,score:4 }]->(Greece),
(Moldova)-[:VOTE {year:2012,score:5 }]->(Italy),
(Moldova)-[:VOTE {year:2012,score:7 }]->(Sweden),
(Moldova)-[:VOTE {year:2012,score:10 }]->(Azerbaijan),
(Moldova)-[:VOTE {year:2012,score:12 }]->(Romania),
(Moldova)-[:VOTE {year:2012,score:6 }]->(Russia),
(Moldova)-[:VOTE {year:2012,score:8 }]->(Ukraine),
(Moldova)-[:VOTE {year:2012,score:1 }]->(Hungary),
(Moldova)-[:VOTE {year:2012,score:2 }]->(Estonia),
(Serbia)-[:VOTE {year:2012,score:2 }]->(Hungary),
(Serbia)-[:VOTE {year:2012,score:4 }]->(Greece),
(Serbia)-[:VOTE {year:2012,score:3 }]->(Azerbaijan),
(Serbia)-[:VOTE {year:2012,score:12 }]->(Macedonia),
(Serbia)-[:VOTE {year:2012,score:7 }]->(Russia),
(Serbia)-[:VOTE {year:2012,score:10 }]->(Sweden),
(Serbia)-[:VOTE {year:2012,score:6 }]->(Malta),
(Serbia)-[:VOTE {year:2012,score:8 }]->(Cyprus),
(Serbia)-[:VOTE {year:2012,score:5 }]->(BosniaHerzegovina),
(Serbia)-[:VOTE {year:2012,score:1 }]->(Albania),
(Montenegro)-[:VOTE {year:2012,score:12 }]->(Serbia),
(Montenegro)-[:VOTE {year:2012,score:2 }]->(Italy),
(Montenegro)-[:VOTE {year:2012,score:1 }]->(Lithuania),
(Montenegro)-[:VOTE {year:2012,score:10 }]->(Albania),
(Montenegro)-[:VOTE {year:2012,score:8 }]->(Macedonia),
(Montenegro)-[:VOTE {year:2012,score:4 }]->(Russia),
(Montenegro)-[:VOTE {year:2012,score:7 }]->(Sweden),
(Montenegro)-[:VOTE {year:2012,score:3 }]->(Moldova),
(Montenegro)-[:VOTE {year:2012,score:6 }]->(BosniaHerzegovina),
(Montenegro)-[:VOTE {year:2012,score:5 }]->(Azerbaijan),
(Bulgaria)-[:VOTE {year:2012,score:12 }]->(Serbia),
(Bulgaria)-[:VOTE {year:2012,score:1 }]->(Greece),
(Bulgaria)-[:VOTE {year:2012,score:3 }]->(Spain),
(Bulgaria)-[:VOTE {year:2012,score:5 }]->(Lithuania),
(Bulgaria)-[:VOTE {year:2012,score:10 }]->(Azerbaijan),
(Bulgaria)-[:VOTE {year:2012,score:2 }]->(Macedonia),
(Bulgaria)-[:VOTE {year:2012,score:6 }]->(Russia),
(Bulgaria)-[:VOTE {year:2012,score:7 }]->(Turkey),
(Bulgaria)-[:VOTE {year:2012,score:8 }]->(Sweden),
(Bulgaria)-[:VOTE {year:2012,score:4 }]->(Albania),
(Azerbaijan)-[:VOTE {year:2012,score:5 }]->(Greece),
(Azerbaijan)-[:VOTE {year:2012,score:4 }]->(Lithuania),
(Azerbaijan)-[:VOTE {year:2012,score:1 }]->(Ireland),
(Azerbaijan)-[:VOTE {year:2012,score:6 }]->(Romania),
(Azerbaijan)-[:VOTE {year:2012,score:10 }]->(Russia),
(Azerbaijan)-[:VOTE {year:2012,score:12 }]->(Turkey),
(Azerbaijan)-[:VOTE {year:2012,score:7 }]->(Sweden),
(Azerbaijan)-[:VOTE {year:2012,score:8 }]->(Malta),
(Azerbaijan)-[:VOTE {year:2012,score:3 }]->(Ukraine),
(Azerbaijan)-[:VOTE {year:2012,score:2 }]->(Cyprus),
(Norway)-[:VOTE {year:2012,score:10 }]->(Serbia),
(Norway)-[:VOTE {year:2012,score:2 }]->(Denmark),
(Norway)-[:VOTE {year:2012,score:4 }]->(Italy),
(Norway)-[:VOTE {year:2012,score:6 }]->(Lithuania),
(Norway)-[:VOTE {year:2012,score:5 }]->(Iceland),
(Norway)-[:VOTE {year:2012,score:8 }]->(Russia),
(Norway)-[:VOTE {year:2012,score:12 }]->(Sweden),
(Norway)-[:VOTE {year:2012,score:3 }]->(Germany),
(Norway)-[:VOTE {year:2012,score:1 }]->(Ukraine),
(Norway)-[:VOTE {year:2012,score:7 }]->(Estonia),
(UnitedKingdom)-[:VOTE {year:2012,score:8 }]->(Spain),
(UnitedKingdom)-[:VOTE {year:2012,score:12 }]->(Sweden),
(UnitedKingdom)-[:VOTE {year:2012,score:10 }]->(Ireland),
(UnitedKingdom)-[:VOTE {year:2012,score:2 }]->(Azerbaijan),
(UnitedKingdom)-[:VOTE {year:2012,score:3 }]->(Russia),
(UnitedKingdom)-[:VOTE {year:2012,score:5 }]->(Malta),
(UnitedKingdom)-[:VOTE {year:2012,score:1 }]->(Turkey),
(UnitedKingdom)-[:VOTE {year:2012,score:7 }]->(Lithuania),
(UnitedKingdom)-[:VOTE {year:2012,score:6 }]->(Germany),
(UnitedKingdom)-[:VOTE {year:2012,score:4 }]->(Estonia),
(Macedonia)-[:VOTE {year:2012,score:10 }]->(Serbia),
(Macedonia)-[:VOTE {year:2012,score:5 }]->(Italy),
(Macedonia)-[:VOTE {year:2012,score:3 }]->(Ukraine),
(Macedonia)-[:VOTE {year:2012,score:12 }]->(Albania),
(Macedonia)-[:VOTE {year:2012,score:4 }]->(Russia),
(Macedonia)-[:VOTE {year:2012,score:8 }]->(Turkey),
(Macedonia)-[:VOTE {year:2012,score:6 }]->(Sweden),
(Macedonia)-[:VOTE {year:2012,score:1 }]->(Malta),
(Macedonia)-[:VOTE {year:2012,score:7 }]->(BosniaHerzegovina),
(Macedonia)-[:VOTE {year:2012,score:2 }]->(Azerbaijan),
(Iceland)-[:VOTE {year:2012,score:3 }]->(Serbia),
(Iceland)-[:VOTE {year:2012,score:2 }]->(Spain),
(Iceland)-[:VOTE {year:2012,score:5 }]->(Denmark),
(Iceland)-[:VOTE {year:2012,score:4 }]->(Ireland),
(Iceland)-[:VOTE {year:2012,score:1 }]->(Norway),
(Iceland)-[:VOTE {year:2012,score:7 }]->(Russia),
(Iceland)-[:VOTE {year:2012,score:6 }]->(France),
(Iceland)-[:VOTE {year:2012,score:12 }]->(Sweden),
(Iceland)-[:VOTE {year:2012,score:8 }]->(Cyprus),
(Iceland)-[:VOTE {year:2012,score:10 }]->(Estonia),
(Israel)-[:VOTE {year:2012,score:2 }]->(Greece),
(Israel)-[:VOTE {year:2012,score:10 }]->(Spain),
(Israel)-[:VOTE {year:2012,score:3 }]->(Cyprus),
(Israel)-[:VOTE {year:2012,score:8 }]->(Azerbaijan),
(Israel)-[:VOTE {year:2012,score:6 }]->(Romania),
(Israel)-[:VOTE {year:2012,score:7 }]->(Russia),
(Israel)-[:VOTE {year:2012,score:1 }]->(Turkey),
(Israel)-[:VOTE {year:2012,score:12 }]->(Sweden),
(Israel)-[:VOTE {year:2012,score:4 }]->(Italy),
(Israel)-[:VOTE {year:2012,score:5 }]->(Moldova),
(Belgium)-[:VOTE {year:2012,score:5 }]->(Serbia),
(Belgium)-[:VOTE {year:2012,score:2 }]->(Greece),
(Belgium)-[:VOTE {year:2012,score:6 }]->(Spain),
(Belgium)-[:VOTE {year:2012,score:4 }]->(Ireland),
(Belgium)-[:VOTE {year:2012,score:10 }]->(Albania),
(Belgium)-[:VOTE {year:2012,score:1 }]->(UnitedKingdom),
(Belgium)-[:VOTE {year:2012,score:3 }]->(Romania),
(Belgium)-[:VOTE {year:2012,score:8 }]->(Russia),
(Belgium)-[:VOTE {year:2012,score:7 }]->(Turkey),
(Belgium)-[:VOTE {year:2012,score:12 }]->(Sweden),
(Germany)-[:VOTE {year:2012,score:10 }]->(Serbia),
(Germany)-[:VOTE {year:2012,score:2 }]->(Italy),
(Germany)-[:VOTE {year:2012,score:5 }]->(Denmark),
(Germany)-[:VOTE {year:2012,score:6 }]->(Albania),
(Germany)-[:VOTE {year:2012,score:3 }]->(Iceland),
(Germany)-[:VOTE {year:2012,score:1 }]->(Greece),
(Germany)-[:VOTE {year:2012,score:7 }]->(Russia),
(Germany)-[:VOTE {year:2012,score:8 }]->(Turkey),
(Germany)-[:VOTE {year:2012,score:12 }]->(Sweden),
(Germany)-[:VOTE {year:2012,score:4 }]->(Estonia),
(Croatia)-[:VOTE {year:2012,score:12 }]->(Serbia),
(Croatia)-[:VOTE {year:2012,score:2 }]->(Italy),
(Croatia)-[:VOTE {year:2012,score:3 }]->(Ireland),
(Croatia)-[:VOTE {year:2012,score:5 }]->(Albania),
(Croatia)-[:VOTE {year:2012,score:8 }]->(Macedonia),
(Croatia)-[:VOTE {year:2012,score:6 }]->(Russia),
(Croatia)-[:VOTE {year:2012,score:7 }]->(Sweden),
(Croatia)-[:VOTE {year:2012,score:4 }]->(Germany),
(Croatia)-[:VOTE {year:2012,score:10 }]->(BosniaHerzegovina),
(Croatia)-[:VOTE {year:2012,score:1 }]->(Moldova),
(Hungary)-[:VOTE {year:2012,score:4 }]->(Serbia),
(Hungary)-[:VOTE {year:2012,score:5 }]->(Italy),
(Hungary)-[:VOTE {year:2012,score:8 }]->(Albania),
(Hungary)-[:VOTE {year:2012,score:6 }]->(Iceland),
(Hungary)-[:VOTE {year:2012,score:2 }]->(Macedonia),
(Hungary)-[:VOTE {year:2012,score:7 }]->(Russia),
(Hungary)-[:VOTE {year:2012,score:3 }]->(Turkey),
(Hungary)-[:VOTE {year:2012,score:12 }]->(Sweden),
(Hungary)-[:VOTE {year:2012,score:10 }]->(Germany),
(Hungary)-[:VOTE {year:2012,score:1 }]->(Spain),
(Georgia)-[:VOTE {year:2012,score:4 }]->(Italy),
(Georgia)-[:VOTE {year:2012,score:6 }]->(Ukraine),
(Georgia)-[:VOTE {year:2012,score:10 }]->(Azerbaijan),
(Georgia)-[:VOTE {year:2012,score:8 }]->(Sweden),
(Georgia)-[:VOTE {year:2012,score:1 }]->(Greece),
(Georgia)-[:VOTE {year:2012,score:5 }]->(Russia),
(Georgia)-[:VOTE {year:2012,score:7 }]->(Turkey),
(Georgia)-[:VOTE {year:2012,score:12 }]->(Lithuania),
(Georgia)-[:VOTE {year:2012,score:2 }]->(Germany),
(Georgia)-[:VOTE {year:2012,score:3 }]->(Albania),
(Italy)-[:VOTE {year:2012,score:6 }]->(Serbia),
(Italy)-[:VOTE {year:2012,score:1 }]->(Macedonia),
(Italy)-[:VOTE {year:2012,score:2 }]->(Denmark),
(Italy)-[:VOTE {year:2012,score:12 }]->(Albania),
(Italy)-[:VOTE {year:2012,score:7 }]->(Romania),
(Italy)-[:VOTE {year:2012,score:10 }]->(Russia),
(Italy)-[:VOTE {year:2012,score:3 }]->(Ukraine),
(Italy)-[:VOTE {year:2012,score:8 }]->(Germany),
(Italy)-[:VOTE {year:2012,score:5 }]->(Cyprus),
(Italy)-[:VOTE {year:2012,score:4 }]->(Moldova),
(Spain)-[:VOTE {year:2012,score:1 }]->(Italy),
(Spain)-[:VOTE {year:2012,score:2 }]->(Ukraine),
(Spain)-[:VOTE {year:2012,score:4 }]->(Iceland),
(Spain)-[:VOTE {year:2012,score:10 }]->(Romania),
(Spain)-[:VOTE {year:2012,score:8 }]->(Russia),
(Spain)-[:VOTE {year:2012,score:12 }]->(Sweden),
(Spain)-[:VOTE {year:2012,score:3 }]->(Germany),
(Spain)-[:VOTE {year:2012,score:5 }]->(Cyprus),
(Spain)-[:VOTE {year:2012,score:7 }]->(Moldova),
(Spain)-[:VOTE {year:2012,score:6 }]->(Estonia),
(Latvia)-[:VOTE {year:2012,score:4 }]->(Lithuania),
(Latvia)-[:VOTE {year:2012,score:6 }]->(Ukraine),
(Latvia)-[:VOTE {year:2012,score:5 }]->(Ireland),
(Latvia)-[:VOTE {year:2012,score:1 }]->(Albania),
(Latvia)-[:VOTE {year:2012,score:2 }]->(UnitedKingdom),
(Latvia)-[:VOTE {year:2012,score:10 }]->(Russia),
(Latvia)-[:VOTE {year:2012,score:3 }]->(France),
(Latvia)-[:VOTE {year:2012,score:12 }]->(Sweden),
(Latvia)-[:VOTE {year:2012,score:7 }]->(Germany),
(Latvia)-[:VOTE {year:2012,score:8 }]->(Estonia),
(Greece)-[:VOTE {year:2012,score:8 }]->(Serbia),
(Greece)-[:VOTE {year:2012,score:3 }]->(Italy),
(Greece)-[:VOTE {year:2012,score:1 }]->(Ukraine),
(Greece)-[:VOTE {year:2012,score:10 }]->(Albania),
(Greece)-[:VOTE {year:2012,score:7 }]->(Romania),
(Greece)-[:VOTE {year:2012,score:4 }]->(Russia),
(Greece)-[:VOTE {year:2012,score:6 }]->(Sweden),
(Greece)-[:VOTE {year:2012,score:12 }]->(Cyprus),
(Greece)-[:VOTE {year:2012,score:2 }]->(Moldova),
(Greece)-[:VOTE {year:2012,score:5 }]->(Azerbaijan),
(Russia)-[:VOTE {year:2012,score:4 }]->(Serbia),
(Russia)-[:VOTE {year:2012,score:5 }]->(Lithuania),
(Russia)-[:VOTE {year:2012,score:1 }]->(Romania),
(Russia)-[:VOTE {year:2012,score:12 }]->(Sweden),
(Russia)-[:VOTE {year:2012,score:10 }]->(Azerbaijan),
(Russia)-[:VOTE {year:2012,score:3 }]->(Greece),
(Russia)-[:VOTE {year:2012,score:8 }]->(Ukraine),
(Russia)-[:VOTE {year:2012,score:2 }]->(Cyprus),
(Russia)-[:VOTE {year:2012,score:7 }]->(Moldova),
(Russia)-[:VOTE {year:2012,score:6 }]->(Estonia),
(France)-[:VOTE {year:2012,score:8 }]->(Serbia),
(France)-[:VOTE {year:2012,score:6 }]->(Spain),
(France)-[:VOTE {year:2012,score:3 }]->(Lithuania),
(France)-[:VOTE {year:2012,score:2 }]->(Romania),
(France)-[:VOTE {year:2012,score:4 }]->(Russia),
(France)-[:VOTE {year:2012,score:5 }]->(Turkey),
(France)-[:VOTE {year:2012,score:12 }]->(Sweden),
(France)-[:VOTE {year:2012,score:7 }]->(Germany),
(France)-[:VOTE {year:2012,score:1 }]->(Italy),
(France)-[:VOTE {year:2012,score:10 }]->(Estonia),
(Austria)-[:VOTE {year:2012,score:10 }]->(Serbia),
(Austria)-[:VOTE {year:2012,score:6 }]->(Spain),
(Austria)-[:VOTE {year:2012,score:8 }]->(Albania),
(Austria)-[:VOTE {year:2012,score:5 }]->(Russia),
(Austria)-[:VOTE {year:2012,score:3 }]->(Turkey),
(Austria)-[:VOTE {year:2012,score:12 }]->(Sweden),
(Austria)-[:VOTE {year:2012,score:4 }]->(Germany),
(Austria)-[:VOTE {year:2012,score:2 }]->(France),
(Austria)-[:VOTE {year:2012,score:7 }]->(BosniaHerzegovina),
(Austria)-[:VOTE {year:2012,score:1 }]->(Moldova),
(Malta)-[:VOTE {year:2012,score:5 }]->(Serbia),
(Malta)-[:VOTE {year:2012,score:4 }]->(Lithuania),
(Malta)-[:VOTE {year:2012,score:10 }]->(Italy),
(Malta)-[:VOTE {year:2012,score:6 }]->(Sweden),
(Malta)-[:VOTE {year:2012,score:12 }]->(Azerbaijan),
(Malta)-[:VOTE {year:2012,score:3 }]->(Russia),
(Malta)-[:VOTE {year:2012,score:8 }]->(Turkey),
(Malta)-[:VOTE {year:2012,score:7 }]->(Ukraine),
(Malta)-[:VOTE {year:2012,score:2 }]->(Germany),
(Malta)-[:VOTE {year:2012,score:1 }]->(Albania),
(Ukraine)-[:VOTE {year:2012,score:2 }]->(Serbia),
(Ukraine)-[:VOTE {year:2012,score:3 }]->(Macedonia),
(Ukraine)-[:VOTE {year:2012,score:4 }]->(Italy),
(Ukraine)-[:VOTE {year:2012,score:12 }]->(Azerbaijan),
(Ukraine)-[:VOTE {year:2012,score:5 }]->(Greece),
(Ukraine)-[:VOTE {year:2012,score:10 }]->(Russia),
(Ukraine)-[:VOTE {year:2012,score:6 }]->(Sweden),
(Ukraine)-[:VOTE {year:2012,score:7 }]->(Malta),
(Ukraine)-[:VOTE {year:2012,score:1 }]->(Estonia),
(Ukraine)-[:VOTE {year:2012,score:8 }]->(Moldova),
(BosniaHerzegovina)-[:VOTE {year:2012,score:10 }]->(Serbia),
(BosniaHerzegovina)-[:VOTE {year:2012,score:1 }]->(Greece),
(BosniaHerzegovina)-[:VOTE {year:2012,score:5 }]->(Spain),
(BosniaHerzegovina)-[:VOTE {year:2012,score:7 }]->(Azerbaijan),
(BosniaHerzegovina)-[:VOTE {year:2012,score:12 }]->(Macedonia),
(BosniaHerzegovina)-[:VOTE {year:2012,score:3 }]->(Russia),
(BosniaHerzegovina)-[:VOTE {year:2012,score:4 }]->(Turkey),
(BosniaHerzegovina)-[:VOTE {year:2012,score:8 }]->(Sweden),
(BosniaHerzegovina)-[:VOTE {year:2012,score:2 }]->(France),
(BosniaHerzegovina)-[:VOTE {year:2012,score:6 }]->(Albania),
(Lithuania)-[:VOTE {year:2013,score:5 }]->(Hungary),
(Lithuania)-[:VOTE {year:2013,score:8 }]->(Georgia),
(Lithuania)-[:VOTE {year:2013,score:1 }]->(Belarus),
(Lithuania)-[:VOTE {year:2013,score:12 }]->(Azerbaijan),
(Lithuania)-[:VOTE {year:2013,score:6 }]->(Norway),
(Lithuania)-[:VOTE {year:2013,score:7 }]->(Russia),
(Lithuania)-[:VOTE {year:2013,score:2 }]->(Denmark),
(Lithuania)-[:VOTE {year:2013,score:4 }]->(Netherlands),
(Lithuania)-[:VOTE {year:2013,score:10 }]->(Ukraine),
(Lithuania)-[:VOTE {year:2013,score:3 }]->(Estonia),
(Belgium)-[:VOTE {year:2013,score:6 }]->(Italy),
(Belgium)-[:VOTE {year:2013,score:8 }]->(Ukraine),
(Belgium)-[:VOTE {year:2013,score:5 }]->(Azerbaijan),
(Belgium)-[:VOTE {year:2013,score:7 }]->(Norway),
(Belgium)-[:VOTE {year:2013,score:1 }]->(UnitedKingdom),
(Belgium)-[:VOTE {year:2013,score:2 }]->(Greece),
(Belgium)-[:VOTE {year:2013,score:4 }]->(Russia),
(Belgium)-[:VOTE {year:2013,score:10 }]->(Denmark),
(Belgium)-[:VOTE {year:2013,score:12 }]->(Netherlands),
(Belgium)-[:VOTE {year:2013,score:3 }]->(Moldova),
(Bulgaria)-[:VOTE {year:2013,score:6 }]->(Hungary),
(Bulgaria)-[:VOTE {year:2013,score:4 }]->(Sweden),
(Bulgaria)-[:VOTE {year:2013,score:8 }]->(Armenia),
(Bulgaria)-[:VOTE {year:2013,score:12 }]->(Azerbaijan),
(Bulgaria)-[:VOTE {year:2013,score:1 }]->(Norway),
(Bulgaria)-[:VOTE {year:2013,score:7 }]->(Greece),
(Bulgaria)-[:VOTE {year:2013,score:5 }]->(Russia),
(Bulgaria)-[:VOTE {year:2013,score:2 }]->(Denmark),
(Bulgaria)-[:VOTE {year:2013,score:10 }]->(Ukraine),
(Bulgaria)-[:VOTE {year:2013,score:3 }]->(Moldova),
(Albania)-[:VOTE {year:2013,score:8 }]->(Hungary),
(Albania)-[:VOTE {year:2013,score:5 }]->(Romania),
(Albania)-[:VOTE {year:2013,score:12 }]->(Italy),
(Albania)-[:VOTE {year:2013,score:7 }]->(Azerbaijan),
(Albania)-[:VOTE {year:2013,score:2 }]->(Norway),
(Albania)-[:VOTE {year:2013,score:10 }]->(Greece),
(Albania)-[:VOTE {year:2013,score:4 }]->(Netherlands),
(Albania)-[:VOTE {year:2013,score:1 }]->(Denmark),
(Albania)-[:VOTE {year:2013,score:3 }]->(Germany),
(Albania)-[:VOTE {year:2013,score:6 }]->(Spain),
(Sweden)-[:VOTE {year:2013,score:3 }]->(Hungary),
(Sweden)-[:VOTE {year:2013,score:7 }]->(Belgium),
(Sweden)-[:VOTE {year:2013,score:2 }]->(Ireland),
(Sweden)-[:VOTE {year:2013,score:1 }]->(UnitedKingdom),
(Sweden)-[:VOTE {year:2013,score:12 }]->(Norway),
(Sweden)-[:VOTE {year:2013,score:5 }]->(Russia),
(Sweden)-[:VOTE {year:2013,score:4 }]->(Romania),
(Sweden)-[:VOTE {year:2013,score:6 }]->(Iceland),
(Sweden)-[:VOTE {year:2013,score:10 }]->(Denmark),
(Sweden)-[:VOTE {year:2013,score:8 }]->(Netherlands),
(Slovenia)-[:VOTE {year:2013,score:8 }]->(Italy),
(Slovenia)-[:VOTE {year:2013,score:2 }]->(Belgium),
(Slovenia)-[:VOTE {year:2013,score:3 }]->(Azerbaijan),
(Slovenia)-[:VOTE {year:2013,score:5 }]->(Norway),
(Slovenia)-[:VOTE {year:2013,score:10 }]->(Russia),
(Slovenia)-[:VOTE {year:2013,score:1 }]->(UnitedKingdom),
(Slovenia)-[:VOTE {year:2013,score:4 }]->(Iceland),
(Slovenia)-[:VOTE {year:2013,score:12 }]->(Denmark),
(Slovenia)-[:VOTE {year:2013,score:7 }]->(Netherlands),
(Slovenia)-[:VOTE {year:2013,score:6 }]->(Sweden),
(Netherlands)-[:VOTE {year:2013,score:7 }]->(Hungary),
(Netherlands)-[:VOTE {year:2013,score:12 }]->(Belgium),
(Netherlands)-[:VOTE {year:2013,score:2 }]->(Azerbaijan),
(Netherlands)-[:VOTE {year:2013,score:6 }]->(Norway),
(Netherlands)-[:VOTE {year:2013,score:3 }]->(Sweden),
(Netherlands)-[:VOTE {year:2013,score:1 }]->(Greece),
(Netherlands)-[:VOTE {year:2013,score:8 }]->(Russia),
(Netherlands)-[:VOTE {year:2013,score:10 }]->(Denmark),
(Netherlands)-[:VOTE {year:2013,score:8 }]->(Malta),
(Netherlands)-[:VOTE {year:2013,score:5 }]->(Ukraine),
(SanMarino)-[:VOTE {year:2013,score:6 }]->(Hungary),
(SanMarino)-[:VOTE {year:2013,score:4 }]->(Italy),
(SanMarino)-[:VOTE {year:2013,score:1 }]->(Armenia),
(SanMarino)-[:VOTE {year:2013,score:2 }]->(Azerbaijan),
(SanMarino)-[:VOTE {year:2013,score:7 }]->(Norway),
(SanMarino)-[:VOTE {year:2013,score:3 }]->(Finland),
(SanMarino)-[:VOTE {year:2013,score:12 }]->(Greece),
(SanMarino)-[:VOTE {year:2013,score:8 }]->(France),
(SanMarino)-[:VOTE {year:2013,score:5 }]->(Belgium),
(SanMarino)-[:VOTE {year:2013,score:10 }]->(Malta),
(Estonia)-[:VOTE {year:2013,score:4 }]->(Hungary),
(Estonia)-[:VOTE {year:2013,score:7 }]->(Netherlands),
(Estonia)-[:VOTE {year:2013,score:3 }]->(Italy),
(Estonia)-[:VOTE {year:2013,score:2 }]->(Belgium),
(Estonia)-[:VOTE {year:2013,score:1 }]->(Sweden),
(Estonia)-[:VOTE {year:2013,score:12 }]->(Russia),
(Estonia)-[:VOTE {year:2013,score:6 }]->(Iceland),
(Estonia)-[:VOTE {year:2013,score:8 }]->(Denmark),
(Estonia)-[:VOTE {year:2013,score:5 }]->(Malta),
(Estonia)-[:VOTE {year:2013,score:10 }]->(Ukraine),
(Spain)-[:VOTE {year:2013,score:12 }]->(Italy),
(Spain)-[:VOTE {year:2013,score:10 }]->(Ukraine),
(Spain)-[:VOTE {year:2013,score:7 }]->(Azerbaijan),
(Spain)-[:VOTE {year:2013,score:5 }]->(Norway),
(Spain)-[:VOTE {year:2013,score:6 }]->(Russia),
(Spain)-[:VOTE {year:2013,score:4 }]->(UnitedKingdom),
(Spain)-[:VOTE {year:2013,score:3 }]->(Germany),
(Spain)-[:VOTE {year:2013,score:8 }]->(Denmark),
(Spain)-[:VOTE {year:2013,score:1 }]->(Malta),
(Spain)-[:VOTE {year:2013,score:2 }]->(Moldova),
(Finland)-[:VOTE {year:2013,score:10 }]->(Hungary),
(Finland)-[:VOTE {year:2013,score:3 }]->(Belgium),
(Finland)-[:VOTE {year:2013,score:4 }]->(Sweden),
(Finland)-[:VOTE {year:2013,score:12 }]->(Norway),
(Finland)-[:VOTE {year:2013,score:2 }]->(Russia),
(Finland)-[:VOTE {year:2013,score:1 }]->(Greece),
(Finland)-[:VOTE {year:2013,score:5 }]->(Iceland),
(Finland)-[:VOTE {year:2013,score:7 }]->(Denmark),
(Finland)-[:VOTE {year:2013,score:8 }]->(Netherlands),
(Finland)-[:VOTE {year:2013,score:6 }]->(Estonia),
(Romania)-[:VOTE {year:2013,score:1 }]->(Italy),
(Romania)-[:VOTE {year:2013,score:4 }]->(Ukraine),
(Romania)-[:VOTE {year:2013,score:10 }]->(Azerbaijan),
(Romania)-[:VOTE {year:2013,score:8 }]->(Norway),
(Romania)-[:VOTE {year:2013,score:3 }]->(UnitedKingdom),
(Romania)-[:VOTE {year:2013,score:7 }]->(Greece),
(Romania)-[:VOTE {year:2013,score:2 }]->(Netherlands),
(Romania)-[:VOTE {year:2013,score:6 }]->(Denmark),
(Romania)-[:VOTE {year:2013,score:5 }]->(Malta),
(Romania)-[:VOTE {year:2013,score:12 }]->(Moldova),
(Ireland)-[:VOTE {year:2013,score:8 }]->(Ukraine),
(Ireland)-[:VOTE {year:2013,score:1 }]->(Lithuania),
(Ireland)-[:VOTE {year:2013,score:2 }]->(Azerbaijan),
(Ireland)-[:VOTE {year:2013,score:5 }]->(Sweden),
(Ireland)-[:VOTE {year:2013,score:7 }]->(UnitedKingdom),
(Ireland)-[:VOTE {year:2013,score:10 }]->(Russia),
(Ireland)-[:VOTE {year:2013,score:12 }]->(Denmark),
(Ireland)-[:VOTE {year:2013,score:6 }]->(Netherlands),
(Ireland)-[:VOTE {year:2013,score:4 }]->(Belgium),
(Ireland)-[:VOTE {year:2013,score:3 }]->(Moldova),
(Belarus)-[:VOTE {year:2013,score:1 }]->(Denmark),
(Belarus)-[:VOTE {year:2013,score:2 }]->(Armenia),
(Belarus)-[:VOTE {year:2013,score:10 }]->(Azerbaijan),
(Belarus)-[:VOTE {year:2013,score:3 }]->(Norway),
(Belarus)-[:VOTE {year:2013,score:6 }]->(Greece),
(Belarus)-[:VOTE {year:2013,score:8 }]->(Russia),
(Belarus)-[:VOTE {year:2013,score:5 }]->(Lithuania),
(Belarus)-[:VOTE {year:2013,score:7 }]->(Malta),
(Belarus)-[:VOTE {year:2013,score:12 }]->(Ukraine),
(Belarus)-[:VOTE {year:2013,score:4 }]->(Moldova),
(Cyprus)-[:VOTE {year:2013,score:6 }]->(Italy),
(Cyprus)-[:VOTE {year:2013,score:10 }]->(Ukraine),
(Cyprus)-[:VOTE {year:2013,score:2 }]->(Ireland),
(Cyprus)-[:VOTE {year:2013,score:8 }]->(Azerbaijan),
(Cyprus)-[:VOTE {year:2013,score:4 }]->(Norway),
(Cyprus)-[:VOTE {year:2013,score:12 }]->(Greece),
(Cyprus)-[:VOTE {year:2013,score:5 }]->(Russia),
(Cyprus)-[:VOTE {year:2013,score:1 }]->(France),
(Cyprus)-[:VOTE {year:2013,score:7 }]->(Denmark),
(Cyprus)-[:VOTE {year:2013,score:3 }]->(Malta),
(Moldova)-[:VOTE {year:2013,score:3 }]->(Georgia),
(Moldova)-[:VOTE {year:2013,score:4 }]->(Belarus),
(Moldova)-[:VOTE {year:2013,score:1 }]->(Armenia),
(Moldova)-[:VOTE {year:2013,score:8 }]->(Azerbaijan),
(Moldova)-[:VOTE {year:2013,score:2 }]->(Norway),
(Moldova)-[:VOTE {year:2013,score:5 }]->(Sweden),
(Moldova)-[:VOTE {year:2013,score:10 }]->(Romania),
(Moldova)-[:VOTE {year:2013,score:7 }]->(Russia),
(Moldova)-[:VOTE {year:2013,score:6 }]->(Denmark),
(Moldova)-[:VOTE {year:2013,score:12 }]->(Ukraine),
(Serbia)-[:VOTE {year:2013,score:2 }]->(Hungary),
(Serbia)-[:VOTE {year:2013,score:4 }]->(Italy),
(Serbia)-[:VOTE {year:2013,score:3 }]->(Belgium),
(Serbia)-[:VOTE {year:2013,score:5 }]->(Azerbaijan),
(Serbia)-[:VOTE {year:2013,score:7 }]->(Norway),
(Serbia)-[:VOTE {year:2013,score:1 }]->(Sweden),
(Serbia)-[:VOTE {year:2013,score:8 }]->(Russia),
(Serbia)-[:VOTE {year:2013,score:12 }]->(Denmark),
(Serbia)-[:VOTE {year:2013,score:10 }]->(Ukraine),
(Serbia)-[:VOTE {year:2013,score:6 }]->(Moldova),
(Montenegro)-[:VOTE {year:2013,score:2 }]->(Georgia),
(Montenegro)-[:VOTE {year:2013,score:6 }]->(Italy),
(Montenegro)-[:VOTE {year:2013,score:3 }]->(Belarus),
(Montenegro)-[:VOTE {year:2013,score:1 }]->(Romania),
(Montenegro)-[:VOTE {year:2013,score:12 }]->(Azerbaijan),
(Montenegro)-[:VOTE {year:2013,score:4 }]->(Norway),
(Montenegro)-[:VOTE {year:2013,score:8 }]->(Greece),
(Montenegro)-[:VOTE {year:2013,score:7 }]->(Russia),
(Montenegro)-[:VOTE {year:2013,score:10 }]->(Denmark),
(Montenegro)-[:VOTE {year:2013,score:5 }]->(Moldova),
(Armenia)-[:VOTE {year:2013,score:10 }]->(Georgia),
(Armenia)-[:VOTE {year:2013,score:1 }]->(Italy),
(Armenia)-[:VOTE {year:2013,score:5 }]->(Belarus),
(Armenia)-[:VOTE {year:2013,score:3 }]->(Norway),
(Armenia)-[:VOTE {year:2013,score:8 }]->(Greece),
(Armenia)-[:VOTE {year:2013,score:7 }]->(Russia),
(Armenia)-[:VOTE {year:2013,score:2 }]->(France),
(Armenia)-[:VOTE {year:2013,score:4 }]->(Denmark),
(Armenia)-[:VOTE {year:2013,score:6 }]->(Malta),
(Armenia)-[:VOTE {year:2013,score:12 }]->(Ukraine),
(Azerbaijan)-[:VOTE {year:2013,score:3 }]->(Lithuania),
(Azerbaijan)-[:VOTE {year:2013,score:6 }]->(Romania),
(Azerbaijan)-[:VOTE {year:2013,score:7 }]->(Belarus),
(Azerbaijan)-[:VOTE {year:2013,score:2 }]->(Norway),
(Azerbaijan)-[:VOTE {year:2013,score:10 }]->(Georgia),
(Azerbaijan)-[:VOTE {year:2013,score:4 }]->(Greece),
(Azerbaijan)-[:VOTE {year:2013,score:5 }]->(Denmark),
(Azerbaijan)-[:VOTE {year:2013,score:8 }]->(Malta),
(Azerbaijan)-[:VOTE {year:2013,score:12 }]->(Ukraine),
(Azerbaijan)-[:VOTE {year:2013,score:1 }]->(Moldova),
(Norway)-[:VOTE {year:2013,score:2 }]->(Hungary),
(Norway)-[:VOTE {year:2013,score:6 }]->(Romania),
(Norway)-[:VOTE {year:2013,score:3 }]->(Belgium),
(Norway)-[:VOTE {year:2013,score:12 }]->(Sweden),
(Norway)-[:VOTE {year:2013,score:5 }]->(Greece),
(Norway)-[:VOTE {year:2013,score:4 }]->(Iceland),
(Norway)-[:VOTE {year:2013,score:8 }]->(Netherlands),
(Norway)-[:VOTE {year:2013,score:7 }]->(Denmark),
(Norway)-[:VOTE {year:2013,score:10 }]->(Malta),
(Norway)-[:VOTE {year:2013,score:1 }]->(Ukraine),
(UnitedKingdom)-[:VOTE {year:2013,score:4 }]->(Romania),
(UnitedKingdom)-[:VOTE {year:2013,score:3 }]->(Belgium),
(UnitedKingdom)-[:VOTE {year:2013,score:1 }]->(Ireland),
(UnitedKingdom)-[:VOTE {year:2013,score:10 }]->(Russia),
(UnitedKingdom)-[:VOTE {year:2013,score:8 }]->(Greece),
(UnitedKingdom)-[:VOTE {year:2013,score:2 }]->(Iceland),
(UnitedKingdom)-[:VOTE {year:2013,score:6 }]->(Netherlands),
(UnitedKingdom)-[:VOTE {year:2013,score:12 }]->(Denmark),
(UnitedKingdom)-[:VOTE {year:2013,score:7 }]->(Malta),
(UnitedKingdom)-[:VOTE {year:2013,score:5 }]->(Ukraine),
(Macedonia)-[:VOTE {year:2013,score:2 }]->(Netherlands),
(Macedonia)-[:VOTE {year:2013,score:10 }]->(Italy),
(Macedonia)-[:VOTE {year:2013,score:5 }]->(Belarus),
(Macedonia)-[:VOTE {year:2013,score:8 }]->(Norway),
(Macedonia)-[:VOTE {year:2013,score:4 }]->(Greece),
(Macedonia)-[:VOTE {year:2013,score:6 }]->(Russia),
(Macedonia)-[:VOTE {year:2013,score:1 }]->(France),
(Macedonia)-[:VOTE {year:2013,score:12 }]->(Denmark),
(Macedonia)-[:VOTE {year:2013,score:3 }]->(Malta),
(Macedonia)-[:VOTE {year:2013,score:7 }]->(Moldova),
(Iceland)-[:VOTE {year:2013,score:8 }]->(Netherlands),
(Iceland)-[:VOTE {year:2013,score:4 }]->(Sweden),
(Iceland)-[:VOTE {year:2013,score:7 }]->(Azerbaijan),
(Iceland)-[:VOTE {year:2013,score:10 }]->(Norway),
(Iceland)-[:VOTE {year:2013,score:6 }]->(Romania),
(Iceland)-[:VOTE {year:2013,score:1 }]->(Russia),
(Iceland)-[:VOTE {year:2013,score:2 }]->(France),
(Iceland)-[:VOTE {year:2013,score:12 }]->(Denmark),
(Iceland)-[:VOTE {year:2013,score:5 }]->(Malta),
(Iceland)-[:VOTE {year:2013,score:3 }]->(Ukraine),
(Israel)-[:VOTE {year:2013,score:3 }]->(Belarus),
(Israel)-[:VOTE {year:2013,score:12 }]->(Azerbaijan),
(Israel)-[:VOTE {year:2013,score:6 }]->(Norway),
(Israel)-[:VOTE {year:2013,score:4 }]->(Finland),
(Israel)-[:VOTE {year:2013,score:2 }]->(Greece),
(Israel)-[:VOTE {year:2013,score:7 }]->(Russia),
(Israel)-[:VOTE {year:2013,score:8 }]->(Denmark),
(Israel)-[:VOTE {year:2013,score:5 }]->(Germany),
(Israel)-[:VOTE {year:2013,score:10 }]->(Ukraine),
(Israel)-[:VOTE {year:2013,score:1 }]->(Moldova),
(Denmark)-[:VOTE {year:2013,score:10 }]->(Netherlands),
(Denmark)-[:VOTE {year:2013,score:7 }]->(Russia),
(Denmark)-[:VOTE {year:2013,score:8 }]->(Sweden),
(Denmark)-[:VOTE {year:2013,score:12 }]->(Norway),
(Denmark)-[:VOTE {year:2013,score:2 }]->(Finland),
(Denmark)-[:VOTE {year:2013,score:6 }]->(Greece),
(Denmark)-[:VOTE {year:2013,score:1 }]->(Iceland),
(Denmark)-[:VOTE {year:2013,score:5 }]->(Belgium),
(Denmark)-[:VOTE {year:2013,score:4 }]->(Malta),
(Denmark)-[:VOTE {year:2013,score:3 }]->(Ukraine),
(Germany)-[:VOTE {year:2013,score:12 }]->(Hungary),
(Germany)-[:VOTE {year:2013,score:2 }]->(Russia),
(Germany)-[:VOTE {year:2013,score:4 }]->(Azerbaijan),
(Germany)-[:VOTE {year:2013,score:7 }]->(Norway),
(Germany)-[:VOTE {year:2013,score:1 }]->(Finland),
(Germany)-[:VOTE {year:2013,score:6 }]->(Greece),
(Germany)-[:VOTE {year:2013,score:8 }]->(Iceland),
(Germany)-[:VOTE {year:2013,score:10 }]->(Denmark),
(Germany)-[:VOTE {year:2013,score:5 }]->(Malta),
(Germany)-[:VOTE {year:2013,score:3 }]->(Sweden),
(Croatia)-[:VOTE {year:2013,score:4 }]->(Hungary),
(Croatia)-[:VOTE {year:2013,score:8 }]->(Italy),
(Croatia)-[:VOTE {year:2013,score:1 }]->(Sweden),
(Croatia)-[:VOTE {year:2013,score:7 }]->(Azerbaijan),
(Croatia)-[:VOTE {year:2013,score:3 }]->(Norway),
(Croatia)-[:VOTE {year:2013,score:5 }]->(Greece),
(Croatia)-[:VOTE {year:2013,score:6 }]->(Russia),
(Croatia)-[:VOTE {year:2013,score:10 }]->(Denmark),
(Croatia)-[:VOTE {year:2013,score:2 }]->(Netherlands),
(Croatia)-[:VOTE {year:2013,score:12 }]->(Ukraine),
(Hungary)-[:VOTE {year:2013,score:5 }]->(Netherlands),
(Hungary)-[:VOTE {year:2013,score:4 }]->(Belgium),
(Hungary)-[:VOTE {year:2013,score:3 }]->(Armenia),
(Hungary)-[:VOTE {year:2013,score:12 }]->(Azerbaijan),
(Hungary)-[:VOTE {year:2013,score:2 }]->(Norway),
(Hungary)-[:VOTE {year:2013,score:1 }]->(Greece),
(Hungary)-[:VOTE {year:2013,score:6 }]->(Iceland),
(Hungary)-[:VOTE {year:2013,score:10 }]->(Denmark),
(Hungary)-[:VOTE {year:2013,score:8 }]->(Malta),
(Hungary)-[:VOTE {year:2013,score:7 }]->(Ukraine),
(Georgia)-[:VOTE {year:2013,score:1 }]->(Lithuania),
(Georgia)-[:VOTE {year:2013,score:2 }]->(Italy),
(Georgia)-[:VOTE {year:2013,score:5 }]->(Belarus),
(Georgia)-[:VOTE {year:2013,score:10 }]->(Armenia),
(Georgia)-[:VOTE {year:2013,score:12 }]->(Azerbaijan),
(Georgia)-[:VOTE {year:2013,score:4 }]->(Norway),
(Georgia)-[:VOTE {year:2013,score:6 }]->(Russia),
(Georgia)-[:VOTE {year:2013,score:7 }]->(Denmark),
(Georgia)-[:VOTE {year:2013,score:3 }]->(Malta),
(Georgia)-[:VOTE {year:2013,score:8 }]->(Ukraine),
(Italy)-[:VOTE {year:2013,score:3 }]->(Hungary),
(Italy)-[:VOTE {year:2013,score:1 }]->(Romania),
(Italy)-[:VOTE {year:2013,score:2 }]->(Spain),
(Italy)-[:VOTE {year:2013,score:6 }]->(Lithuania),
(Italy)-[:VOTE {year:2013,score:8 }]->(Norway),
(Italy)-[:VOTE {year:2013,score:7 }]->(Greece),
(Italy)-[:VOTE {year:2013,score:12 }]->(Denmark),
(Italy)-[:VOTE {year:2013,score:10 }]->(Malta),
(Italy)-[:VOTE {year:2013,score:5 }]->(Ukraine),
(Italy)-[:VOTE {year:2013,score:4 }]->(Moldova),
(Switzerland)-[:VOTE {year:2013,score:10 }]->(Hungary),
(Switzerland)-[:VOTE {year:2013,score:4 }]->(Netherlands),
(Switzerland)-[:VOTE {year:2013,score:12 }]->(Italy),
(Switzerland)-[:VOTE {year:2013,score:6 }]->(Azerbaijan),
(Switzerland)-[:VOTE {year:2013,score:7 }]->(Norway),
(Switzerland)-[:VOTE {year:2013,score:2 }]->(UnitedKingdom),
(Switzerland)-[:VOTE {year:2013,score:8 }]->(Greece),
(Switzerland)-[:VOTE {year:2013,score:5 }]->(Iceland),
(Switzerland)-[:VOTE {year:2013,score:3 }]->(Denmark),
(Switzerland)-[:VOTE {year:2013,score:1 }]->(Germany),
(Greece)-[:VOTE {year:2013,score:2 }]->(Hungary),
(Greece)-[:VOTE {year:2013,score:5 }]->(Georgia),
(Greece)-[:VOTE {year:2013,score:6 }]->(Italy),
(Greece)-[:VOTE {year:2013,score:1 }]->(Belarus),
(Greece)-[:VOTE {year:2013,score:12 }]->(Azerbaijan),
(Greece)-[:VOTE {year:2013,score:4 }]->(Norway),
(Greece)-[:VOTE {year:2013,score:10 }]->(Romania),
(Greece)-[:VOTE {year:2013,score:7 }]->(Denmark),
(Greece)-[:VOTE {year:2013,score:3 }]->(Malta),
(Greece)-[:VOTE {year:2013,score:8 }]->(Ukraine),
(Russia)-[:VOTE {year:2013,score:5 }]->(Georgia),
(Russia)-[:VOTE {year:2013,score:8 }]->(Belgium),
(Russia)-[:VOTE {year:2013,score:2 }]->(Armenia),
(Russia)-[:VOTE {year:2013,score:12 }]->(Azerbaijan),
(Russia)-[:VOTE {year:2013,score:7 }]->(Norway),
(Russia)-[:VOTE {year:2013,score:10 }]->(Greece),
(Russia)-[:VOTE {year:2013,score:4 }]->(Denmark),
(Russia)-[:VOTE {year:2013,score:3 }]->(Netherlands),
(Russia)-[:VOTE {year:2013,score:1 }]->(Ukraine),
(Russia)-[:VOTE {year:2013,score:6 }]->(Moldova),
(France)-[:VOTE {year:2013,score:10 }]->(Italy),
(France)-[:VOTE {year:2013,score:5 }]->(Belgium),
(France)-[:VOTE {year:2013,score:7 }]->(Armenia),
(France)-[:VOTE {year:2013,score:8 }]->(Azerbaijan),
(France)-[:VOTE {year:2013,score:3 }]->(Finland),
(France)-[:VOTE {year:2013,score:1 }]->(Romania),
(France)-[:VOTE {year:2013,score:6 }]->(Russia),
(France)-[:VOTE {year:2013,score:12 }]->(Denmark),
(France)-[:VOTE {year:2013,score:2 }]->(Malta),
(France)-[:VOTE {year:2013,score:4 }]->(Moldova),
(Austria)-[:VOTE {year:2013,score:4 }]->(Romania),
(Austria)-[:VOTE {year:2013,score:10 }]->(Italy),
(Austria)-[:VOTE {year:2013,score:3 }]->(Belgium),
(Austria)-[:VOTE {year:2013,score:12 }]->(Azerbaijan),
(Austria)-[:VOTE {year:2013,score:7 }]->(Greece),
(Austria)-[:VOTE {year:2013,score:8 }]->(Netherlands),
(Austria)-[:VOTE {year:2013,score:5 }]->(Denmark),
(Austria)-[:VOTE {year:2013,score:6 }]->(Germany),
(Austria)-[:VOTE {year:2013,score:1 }]->(Ukraine),
(Austria)-[:VOTE {year:2013,score:2 }]->(Moldova),
(Malta)-[:VOTE {year:2013,score:7 }]->(Romania),
(Malta)-[:VOTE {year:2013,score:8 }]->(Italy),
(Malta)-[:VOTE {year:2013,score:2 }]->(Belarus),
(Malta)-[:VOTE {year:2013,score:1 }]->(Armenia),
(Malta)-[:VOTE {year:2013,score:12 }]->(Azerbaijan),
(Malta)-[:VOTE {year:2013,score:3 }]->(Norway),
(Malta)-[:VOTE {year:2013,score:4 }]->(Greece),
(Malta)-[:VOTE {year:2013,score:5 }]->(UnitedKingdom),
(Malta)-[:VOTE {year:2013,score:6 }]->(Denmark),
(Malta)-[:VOTE {year:2013,score:10 }]->(Ukraine),
(Ukraine)-[:VOTE {year:2013,score:7 }]->(Georgia),
(Ukraine)-[:VOTE {year:2013,score:12 }]->(Belarus),
(Ukraine)-[:VOTE {year:2013,score:6 }]->(Armenia),
(Ukraine)-[:VOTE {year:2013,score:10 }]->(Azerbaijan),
(Ukraine)-[:VOTE {year:2013,score:3 }]->(Norway),
(Ukraine)-[:VOTE {year:2013,score:4 }]->(Russia),
(Ukraine)-[:VOTE {year:2013,score:1 }]->(Lithuania),
(Ukraine)-[:VOTE {year:2013,score:5 }]->(Denmark),
(Ukraine)-[:VOTE {year:2013,score:2 }]->(Malta),
(Ukraine)-[:VOTE {year:2013,score:8 }]->(Moldova),
(Latvia)-[:VOTE {year:2013,score:2 }]->(Belgium),
(Latvia)-[:VOTE {year:2013,score:3 }]->(Azerbaijan),
(Latvia)-[:VOTE {year:2013,score:8 }]->(Norway),
(Latvia)-[:VOTE {year:2013,score:4 }]->(Sweden),
(Latvia)-[:VOTE {year:2013,score:1 }]->(Greece),
(Latvia)-[:VOTE {year:2013,score:12 }]->(Russia),
(Latvia)-[:VOTE {year:2013,score:6 }]->(Denmark),
(Latvia)-[:VOTE {year:2013,score:5 }]->(Malta),
(Latvia)-[:VOTE {year:2013,score:7 }]->(Ukraine),
(Latvia)-[:VOTE {year:2013,score:10 }]->(Estonia),
(Lithuania)-[:VOTE {year:2014,score:1 }]->(Denmark),
(Lithuania)-[:VOTE {year:2014,score:4 }]->(Spain),
(Lithuania)-[:VOTE {year:2014,score:5 }]->(Ukraine),
(Lithuania)-[:VOTE {year:2014,score:2 }]->(Switzerland),
(Lithuania)-[:VOTE {year:2014,score:8 }]->(Norway),
(Lithuania)-[:VOTE {year:2014,score:7 }]->(Sweden),
(Lithuania)-[:VOTE {year:2014,score:6 }]->(Russia),
(Lithuania)-[:VOTE {year:2014,score:10 }]->(Austria),
(Lithuania)-[:VOTE {year:2014,score:12 }]->(Netherlands),
(Lithuania)-[:VOTE {year:2014,score:3 }]->(Belarus),
(Belgium)-[:VOTE {year:2014,score:7 }]->(Hungary),
(Belgium)-[:VOTE {year:2014,score:2 }]->(Spain),
(Belgium)-[:VOTE {year:2014,score:4 }]->(Ukraine),
(Belgium)-[:VOTE {year:2014,score:1 }]->(UnitedKingdom),
(Belgium)-[:VOTE {year:2014,score:10 }]->(Sweden),
(Belgium)-[:VOTE {year:2014,score:3 }]->(Finland),
(Belgium)-[:VOTE {year:2014,score:5 }]->(Romania),
(Belgium)-[:VOTE {year:2014,score:6 }]->(Denmark),
(Belgium)-[:VOTE {year:2014,score:12 }]->(Austria),
(Belgium)-[:VOTE {year:2014,score:8 }]->(Netherlands),
(Albania)-[:VOTE {year:2014,score:8 }]->(Hungary),
(Albania)-[:VOTE {year:2014,score:1 }]->(Malta),
(Albania)-[:VOTE {year:2014,score:6 }]->(Montenegro),
(Albania)-[:VOTE {year:2014,score:7 }]->(Sweden),
(Albania)-[:VOTE {year:2014,score:3 }]->(SanMarino),
(Albania)-[:VOTE {year:2014,score:2 }]->(Greece),
(Albania)-[:VOTE {year:2014,score:12 }]->(Spain),
(Albania)-[:VOTE {year:2014,score:5 }]->(Austria),
(Albania)-[:VOTE {year:2014,score:4 }]->(Germany),
(Albania)-[:VOTE {year:2014,score:10 }]->(Italy),
(Sweden)-[:VOTE {year:2014,score:7 }]->(Hungary),
(Sweden)-[:VOTE {year:2014,score:8 }]->(Denmark),
(Sweden)-[:VOTE {year:2014,score:2 }]->(Poland),
(Sweden)-[:VOTE {year:2014,score:5 }]->(Armenia),
(Sweden)-[:VOTE {year:2014,score:3 }]->(Norway),
(Sweden)-[:VOTE {year:2014,score:6 }]->(Finland),
(Sweden)-[:VOTE {year:2014,score:4 }]->(Iceland),
(Sweden)-[:VOTE {year:2014,score:1 }]->(France),
(Sweden)-[:VOTE {year:2014,score:12 }]->(Austria),
(Sweden)-[:VOTE {year:2014,score:10 }]->(Netherlands),
(Slovenia)-[:VOTE {year:2014,score:3 }]->(Hungary),
(Slovenia)-[:VOTE {year:2014,score:6 }]->(Denmark),
(Slovenia)-[:VOTE {year:2014,score:7 }]->(Montenegro),
(Slovenia)-[:VOTE {year:2014,score:1 }]->(Poland),
(Slovenia)-[:VOTE {year:2014,score:5 }]->(Norway),
(Slovenia)-[:VOTE {year:2014,score:8 }]->(Sweden),
(Slovenia)-[:VOTE {year:2014,score:10 }]->(Netherlands),
(Slovenia)-[:VOTE {year:2014,score:12 }]->(Austria),
(Slovenia)-[:VOTE {year:2014,score:2 }]->(Germany),
(Slovenia)-[:VOTE {year:2014,score:4 }]->(Spain),
(Netherlands)-[:VOTE {year:2014,score:4 }]->(Hungary),
(Netherlands)-[:VOTE {year:2014,score:1 }]->(Denmark),
(Netherlands)-[:VOTE {year:2014,score:8 }]->(Sweden),
(Netherlands)-[:VOTE {year:2014,score:7 }]->(Armenia),
(Netherlands)-[:VOTE {year:2014,score:10 }]->(Norway),
(Netherlands)-[:VOTE {year:2014,score:2 }]->(Finland),
(Netherlands)-[:VOTE {year:2014,score:4 }]->(Iceland),
(Netherlands)-[:VOTE {year:2014,score:12 }]->(Austria),
(Netherlands)-[:VOTE {year:2014,score:5 }]->(Malta),
(Netherlands)-[:VOTE {year:2014,score:3 }]->(Switzerland),
(SanMarino)-[:VOTE {year:2014,score:7 }]->(Hungary),
(SanMarino)-[:VOTE {year:2014,score:2 }]->(Netherlands),
(SanMarino)-[:VOTE {year:2014,score:1 }]->(Denmark),
(SanMarino)-[:VOTE {year:2014,score:6 }]->(Armenia),
(SanMarino)-[:VOTE {year:2014,score:12 }]->(Azerbaijan),
(SanMarino)-[:VOTE {year:2014,score:3 }]->(Finland),
(SanMarino)-[:VOTE {year:2014,score:5 }]->(UnitedKingdom),
(SanMarino)-[:VOTE {year:2014,score:8 }]->(Iceland),
(SanMarino)-[:VOTE {year:2014,score:10 }]->(Sweden),
(SanMarino)-[:VOTE {year:2014,score:4 }]->(Malta),
(Estonia)-[:VOTE {year:2014,score:7 }]->(Hungary),
(Estonia)-[:VOTE {year:2014,score:2 }]->(Spain),
(Estonia)-[:VOTE {year:2014,score:8 }]->(Ukraine),
(Estonia)-[:VOTE {year:2014,score:5 }]->(Armenia),
(Estonia)-[:VOTE {year:2014,score:3 }]->(Norway),
(Estonia)-[:VOTE {year:2014,score:10 }]->(Sweden),
(Estonia)-[:VOTE {year:2014,score:1 }]->(Russia),
(Estonia)-[:VOTE {year:2014,score:6 }]->(Finland),
(Estonia)-[:VOTE {year:2014,score:4 }]->(Austria),
(Estonia)-[:VOTE {year:2014,score:12 }]->(Netherlands),
(Spain)-[:VOTE {year:2014,score:2 }]->(Hungary),
(Spain)-[:VOTE {year:2014,score:3 }]->(Denmark),
(Spain)-[:VOTE {year:2014,score:12 }]->(Austria),
(Spain)-[:VOTE {year:2014,score:4 }]->(Armenia),
(Spain)-[:VOTE {year:2014,score:5 }]->(UnitedKingdom),
(Spain)-[:VOTE {year:2014,score:10 }]->(Sweden),
(Spain)-[:VOTE {year:2014,score:8 }]->(Romania),
(Spain)-[:VOTE {year:2014,score:1 }]->(Iceland),
(Spain)-[:VOTE {year:2014,score:6 }]->(Ukraine),
(Spain)-[:VOTE {year:2014,score:7 }]->(Netherlands),
(Finland)-[:VOTE {year:2014,score:5 }]->(Hungary),
(Finland)-[:VOTE {year:2014,score:6 }]->(Denmark),
(Finland)-[:VOTE {year:2014,score:2 }]->(Ukraine),
(Finland)-[:VOTE {year:2014,score:4 }]->(Armenia),
(Finland)-[:VOTE {year:2014,score:7 }]->(Norway),
(Finland)-[:VOTE {year:2014,score:10 }]->(Sweden),
(Finland)-[:VOTE {year:2014,score:8 }]->(Netherlands),
(Finland)-[:VOTE {year:2014,score:1 }]->(France),
(Finland)-[:VOTE {year:2014,score:12 }]->(Austria),
(Finland)-[:VOTE {year:2014,score:3 }]->(Malta),
(Romania)-[:VOTE {year:2014,score:10 }]->(Hungary),
(Romania)-[:VOTE {year:2014,score:3 }]->(Netherlands),
(Romania)-[:VOTE {year:2014,score:5 }]->(Spain),
(Romania)-[:VOTE {year:2014,score:12 }]->(Sweden),
(Romania)-[:VOTE {year:2014,score:7 }]->(Armenia),
(Romania)-[:VOTE {year:2014,score:1 }]->(Norway),
(Romania)-[:VOTE {year:2014,score:6 }]->(Switzerland),
(Romania)-[:VOTE {year:2014,score:8 }]->(Austria),
(Romania)-[:VOTE {year:2014,score:2 }]->(Germany),
(Romania)-[:VOTE {year:2014,score:4 }]->(Denmark),
(Ireland)-[:VOTE {year:2014,score:1 }]->(Hungary),
(Ireland)-[:VOTE {year:2014,score:6 }]->(Spain),
(Ireland)-[:VOTE {year:2014,score:4 }]->(Sweden),
(Ireland)-[:VOTE {year:2014,score:5 }]->(Switzerland),
(Ireland)-[:VOTE {year:2014,score:7 }]->(Norway),
(Ireland)-[:VOTE {year:2014,score:8 }]->(UnitedKingdom),
(Ireland)-[:VOTE {year:2014,score:2 }]->(Romania),
(Ireland)-[:VOTE {year:2014,score:10 }]->(Netherlands),
(Ireland)-[:VOTE {year:2014,score:12 }]->(Austria),
(Ireland)-[:VOTE {year:2014,score:3 }]->(Malta),
(Belarus)-[:VOTE {year:2014,score:5 }]->(Hungary),
(Belarus)-[:VOTE {year:2014,score:6 }]->(Greece),
(Belarus)-[:VOTE {year:2014,score:7 }]->(Poland),
(Belarus)-[:VOTE {year:2014,score:10 }]->(Armenia),
(Belarus)-[:VOTE {year:2014,score:3 }]->(Azerbaijan),
(Belarus)-[:VOTE {year:2014,score:4 }]->(Norway),
(Belarus)-[:VOTE {year:2014,score:1 }]->(Romania),
(Belarus)-[:VOTE {year:2014,score:12 }]->(Russia),
(Belarus)-[:VOTE {year:2014,score:8 }]->(Ukraine),
(Belarus)-[:VOTE {year:2014,score:2 }]->(Netherlands),
(Moldova)-[:VOTE {year:2014,score:4 }]->(Hungary),
(Moldova)-[:VOTE {year:2014,score:8 }]->(Russia),
(Moldova)-[:VOTE {year:2014,score:5 }]->(Belarus),
(Moldova)-[:VOTE {year:2014,score:3 }]->(Armenia),
(Moldova)-[:VOTE {year:2014,score:6 }]->(Sweden),
(Moldova)-[:VOTE {year:2014,score:12 }]->(Romania),
(Moldova)-[:VOTE {year:2014,score:7 }]->(Austria),
(Moldova)-[:VOTE {year:2014,score:10 }]->(Ukraine),
(Moldova)-[:VOTE {year:2014,score:1 }]->(SanMarino),
(Moldova)-[:VOTE {year:2014,score:2 }]->(Poland),
(Montenegro)-[:VOTE {year:2014,score:12 }]->(Hungary),
(Montenegro)-[:VOTE {year:2014,score:8 }]->(Slovenia),
(Montenegro)-[:VOTE {year:2014,score:6 }]->(Italy),
(Montenegro)-[:VOTE {year:2014,score:7 }]->(Ukraine),
(Montenegro)-[:VOTE {year:2014,score:10 }]->(Armenia),
(Montenegro)-[:VOTE {year:2014,score:3 }]->(Sweden),
(Montenegro)-[:VOTE {year:2014,score:5 }]->(Switzerland),
(Montenegro)-[:VOTE {year:2014,score:2 }]->(Austria),
(Montenegro)-[:VOTE {year:2014,score:1 }]->(Belarus),
(Montenegro)-[:VOTE {year:2014,score:4 }]->(Poland),
(Armenia)-[:VOTE {year:2014,score:4 }]->(Netherlands),
(Armenia)-[:VOTE {year:2014,score:12 }]->(Montenegro),
(Armenia)-[:VOTE {year:2014,score:1 }]->(Denmark),
(Armenia)-[:VOTE {year:2014,score:5 }]->(Switzerland),
(Armenia)-[:VOTE {year:2014,score:3 }]->(SanMarino),
(Armenia)-[:VOTE {year:2014,score:7 }]->(Greece),
(Armenia)-[:VOTE {year:2014,score:10 }]->(Russia),
(Armenia)-[:VOTE {year:2014,score:8 }]->(Belarus),
(Armenia)-[:VOTE {year:2014,score:6 }]->(Germany),
(Armenia)-[:VOTE {year:2014,score:2 }]->(Spain),
(Azerbaijan)-[:VOTE {year:2014,score:8 }]->(Hungary),
(Azerbaijan)-[:VOTE {year:2014,score:4 }]->(Greece),
(Azerbaijan)-[:VOTE {year:2014,score:3 }]->(SanMarino),
(Azerbaijan)-[:VOTE {year:2014,score:7 }]->(Belarus),
(Azerbaijan)-[:VOTE {year:2014,score:12 }]->(Russia),
(Azerbaijan)-[:VOTE {year:2014,score:6 }]->(Romania),
(Azerbaijan)-[:VOTE {year:2014,score:1 }]->(Austria),
(Azerbaijan)-[:VOTE {year:2014,score:10 }]->(Ukraine),
(Azerbaijan)-[:VOTE {year:2014,score:5 }]->(Malta),
(Azerbaijan)-[:VOTE {year:2014,score:2 }]->(Poland),
(Norway)-[:VOTE {year:2014,score:1 }]->(Denmark),
(Norway)-[:VOTE {year:2014,score:5 }]->(Spain),
(Norway)-[:VOTE {year:2014,score:2 }]->(Poland),
(Norway)-[:VOTE {year:2014,score:3 }]->(UnitedKingdom),
(Norway)-[:VOTE {year:2014,score:8 }]->(Sweden),
(Norway)-[:VOTE {year:2014,score:4 }]->(Romania),
(Norway)-[:VOTE {year:2014,score:6 }]->(Iceland),
(Norway)-[:VOTE {year:2014,score:7 }]->(Finland),
(Norway)-[:VOTE {year:2014,score:10 }]->(Austria),
(Norway)-[:VOTE {year:2014,score:12 }]->(Netherlands),
(UnitedKingdom)-[:VOTE {year:2014,score:3 }]->(Denmark),
(UnitedKingdom)-[:VOTE {year:2014,score:8 }]->(Netherlands),
(UnitedKingdom)-[:VOTE {year:2014,score:5 }]->(Spain),
(UnitedKingdom)-[:VOTE {year:2014,score:7 }]->(Sweden),
(UnitedKingdom)-[:VOTE {year:2014,score:1 }]->(Switzerland),
(UnitedKingdom)-[:VOTE {year:2014,score:6 }]->(Finland),
(UnitedKingdom)-[:VOTE {year:2014,score:2 }]->(Greece),
(UnitedKingdom)-[:VOTE {year:2014,score:4 }]->(Iceland),
(UnitedKingdom)-[:VOTE {year:2014,score:12 }]->(Austria),
(UnitedKingdom)-[:VOTE {year:2014,score:10 }]->(Malta),
(Macedonia)-[:VOTE {year:2014,score:10 }]->(Hungary),
(Macedonia)-[:VOTE {year:2014,score:1 }]->(Slovenia),
(Macedonia)-[:VOTE {year:2014,score:12 }]->(Montenegro),
(Macedonia)-[:VOTE {year:2014,score:5 }]->(Poland),
(Macedonia)-[:VOTE {year:2014,score:8 }]->(Armenia),
(Macedonia)-[:VOTE {year:2014,score:4 }]->(Romania),
(Macedonia)-[:VOTE {year:2014,score:6 }]->(Russia),
(Macedonia)-[:VOTE {year:2014,score:3 }]->(Austria),
(Macedonia)-[:VOTE {year:2014,score:7 }]->(Netherlands),
(Macedonia)-[:VOTE {year:2014,score:2 }]->(Italy),
(Iceland)-[:VOTE {year:2014,score:6 }]->(Hungary),
(Iceland)-[:VOTE {year:2014,score:3 }]->(Poland),
(Iceland)-[:VOTE {year:2014,score:2 }]->(Armenia),
(Iceland)-[:VOTE {year:2014,score:1 }]->(Norway),
(Iceland)-[:VOTE {year:2014,score:7 }]->(Sweden),
(Iceland)-[:VOTE {year:2014,score:4 }]->(UnitedKingdom),
(Iceland)-[:VOTE {year:2014,score:8 }]->(Denmark),
(Iceland)-[:VOTE {year:2014,score:5 }]->(Finland),
(Iceland)-[:VOTE {year:2014,score:10 }]->(Austria),
(Iceland)-[:VOTE {year:2014,score:12 }]->(Netherlands),
(Israel)-[:VOTE {year:2014,score:7 }]->(Hungary),
(Israel)-[:VOTE {year:2014,score:2 }]->(Greece),
(Israel)-[:VOTE {year:2014,score:3 }]->(Russia),
(Israel)-[:VOTE {year:2014,score:1 }]->(Belarus),
(Israel)-[:VOTE {year:2014,score:6 }]->(Armenia),
(Israel)-[:VOTE {year:2014,score:10 }]->(Sweden),
(Israel)-[:VOTE {year:2014,score:8 }]->(Romania),
(Israel)-[:VOTE {year:2014,score:12 }]->(Austria),
(Israel)-[:VOTE {year:2014,score:5 }]->(Ukraine),
(Israel)-[:VOTE {year:2014,score:4 }]->(Spain),
(Denmark)-[:VOTE {year:2014,score:3 }]->(Hungary),
(Denmark)-[:VOTE {year:2014,score:1 }]->(Ukraine),
(Denmark)-[:VOTE {year:2014,score:2 }]->(Armenia),
(Denmark)-[:VOTE {year:2014,score:6 }]->(Norway),
(Denmark)-[:VOTE {year:2014,score:12 }]->(Sweden),
(Denmark)-[:VOTE {year:2014,score:7 }]->(UnitedKingdom),
(Denmark)-[:VOTE {year:2014,score:5 }]->(Iceland),
(Denmark)-[:VOTE {year:2014,score:4 }]->(Finland),
(Denmark)-[:VOTE {year:2014,score:8 }]->(Austria),
(Denmark)-[:VOTE {year:2014,score:10 }]->(Netherlands),
(Germany)-[:VOTE {year:2014,score:8 }]->(Denmark),
(Germany)-[:VOTE {year:2014,score:1 }]->(Spain),
(Germany)-[:VOTE {year:2014,score:10 }]->(Poland),
(Germany)-[:VOTE {year:2014,score:6 }]->(Armenia),
(Germany)-[:VOTE {year:2014,score:5 }]->(Norway),
(Germany)-[:VOTE {year:2014,score:4 }]->(Finland),
(Germany)-[:VOTE {year:2014,score:2 }]->(Iceland),
(Germany)-[:VOTE {year:2014,score:7 }]->(Austria),
(Germany)-[:VOTE {year:2014,score:12 }]->(Netherlands),
(Germany)-[:VOTE {year:2014,score:3 }]->(Switzerland),
(Hungary)-[:VOTE {year:2014,score:1 }]->(Switzerland),
(Hungary)-[:VOTE {year:2014,score:10 }]->(Austria),
(Hungary)-[:VOTE {year:2014,score:7 }]->(Armenia),
(Hungary)-[:VOTE {year:2014,score:8 }]->(Sweden),
(Hungary)-[:VOTE {year:2014,score:5 }]->(Iceland),
(Hungary)-[:VOTE {year:2014,score:6 }]->(Finland),
(Hungary)-[:VOTE {year:2014,score:2 }]->(Ukraine),
(Hungary)-[:VOTE {year:2014,score:12 }]->(Netherlands),
(Hungary)-[:VOTE {year:2014,score:4 }]->(SanMarino),
(Hungary)-[:VOTE {year:2014,score:3 }]->(Poland),
(Georgia)-[:VOTE {year:2014,score:6 }]->(Ukraine),
(Georgia)-[:VOTE {year:2014,score:12 }]->(Armenia),
(Georgia)-[:VOTE {year:2014,score:7 }]->(Azerbaijan),
(Georgia)-[:VOTE {year:2014,score:2 }]->(Sweden),
(Georgia)-[:VOTE {year:2014,score:4 }]->(Greece),
(Georgia)-[:VOTE {year:2014,score:8 }]->(Russia),
(Georgia)-[:VOTE {year:2014,score:10 }]->(Austria),
(Georgia)-[:VOTE {year:2014,score:4 }]->(Germany),
(Georgia)-[:VOTE {year:2014,score:3 }]->(UnitedKingdom),
(Georgia)-[:VOTE {year:2014,score:1 }]->(Switzerland),
(Italy)-[:VOTE {year:2014,score:3 }]->(Greece),
(Italy)-[:VOTE {year:2014,score:1 }]->(Malta),
(Italy)-[:VOTE {year:2014,score:8 }]->(Poland),
(Italy)-[:VOTE {year:2014,score:2 }]->(Switzerland),
(Italy)-[:VOTE {year:2014,score:6 }]->(Finland),
(Italy)-[:VOTE {year:2014,score:5 }]->(Romania),
(Italy)-[:VOTE {year:2014,score:7 }]->(Iceland),
(Italy)-[:VOTE {year:2014,score:4 }]->(Netherlands),
(Italy)-[:VOTE {year:2014,score:10 }]->(Ukraine),
(Italy)-[:VOTE {year:2014,score:12 }]->(Austria),
(Poland)-[:VOTE {year:2014,score:6 }]->(Denmark),
(Poland)-[:VOTE {year:2014,score:12 }]->(Netherlands),
(Poland)-[:VOTE {year:2014,score:2 }]->(Spain),
(Poland)-[:VOTE {year:2014,score:4 }]->(Sweden),
(Poland)-[:VOTE {year:2014,score:1 }]->(Armenia),
(Poland)-[:VOTE {year:2014,score:7 }]->(Norway),
(Poland)-[:VOTE {year:2014,score:3 }]->(Finland),
(Poland)-[:VOTE {year:2014,score:10 }]->(Switzerland),
(Poland)-[:VOTE {year:2014,score:5 }]->(Ukraine),
(Poland)-[:VOTE {year:2014,score:8 }]->(Germany),
(Switzerland)-[:VOTE {year:2014,score:1 }]->(Hungary),
(Switzerland)-[:VOTE {year:2014,score:3 }]->(Denmark),
(Switzerland)-[:VOTE {year:2014,score:2 }]->(Italy),
(Switzerland)-[:VOTE {year:2014,score:6 }]->(Sweden),
(Switzerland)-[:VOTE {year:2014,score:5 }]->(Norway),
(Switzerland)-[:VOTE {year:2014,score:4 }]->(Finland),
(Switzerland)-[:VOTE {year:2014,score:10 }]->(Netherlands),
(Switzerland)-[:VOTE {year:2014,score:12 }]->(Austria),
(Switzerland)-[:VOTE {year:2014,score:7 }]->(Germany),
(Switzerland)-[:VOTE {year:2014,score:8 }]->(Spain),
(Greece)-[:VOTE {year:2014,score:6 }]->(Hungary),
(Greece)-[:VOTE {year:2014,score:4 }]->(Switzerland),
(Greece)-[:VOTE {year:2014,score:5 }]->(Ukraine),
(Greece)-[:VOTE {year:2014,score:7 }]->(Armenia),
(Greece)-[:VOTE {year:2014,score:3 }]->(Norway),
(Greece)-[:VOTE {year:2014,score:2 }]->(Sweden),
(Greece)-[:VOTE {year:2014,score:10 }]->(Russia),
(Greece)-[:VOTE {year:2014,score:12 }]->(Austria),
(Greece)-[:VOTE {year:2014,score:8 }]->(Netherlands),
(Greece)-[:VOTE {year:2014,score:1 }]->(Poland),
(Russia)-[:VOTE {year:2014,score:6 }]->(Hungary),
(Russia)-[:VOTE {year:2014,score:3 }]->(Netherlands),
(Russia)-[:VOTE {year:2014,score:12 }]->(Belarus),
(Russia)-[:VOTE {year:2014,score:8 }]->(Armenia),
(Russia)-[:VOTE {year:2014,score:10 }]->(Azerbaijan),
(Russia)-[:VOTE {year:2014,score:2 }]->(Sweden),
(Russia)-[:VOTE {year:2014,score:4 }]->(Greece),
(Russia)-[:VOTE {year:2014,score:1 }]->(Iceland),
(Russia)-[:VOTE {year:2014,score:7 }]->(Ukraine),
(Russia)-[:VOTE {year:2014,score:5 }]->(Austria),
(France)-[:VOTE {year:2014,score:3 }]->(Denmark),
(France)-[:VOTE {year:2014,score:1 }]->(Italy),
(France)-[:VOTE {year:2014,score:5 }]->(Poland),
(France)-[:VOTE {year:2014,score:12 }]->(Armenia),
(France)-[:VOTE {year:2014,score:2 }]->(Norway),
(France)-[:VOTE {year:2014,score:4 }]->(Sweden),
(France)-[:VOTE {year:2014,score:7 }]->(Iceland),
(France)-[:VOTE {year:2014,score:10 }]->(Austria),
(France)-[:VOTE {year:2014,score:8 }]->(Netherlands),
(France)-[:VOTE {year:2014,score:6 }]->(Spain),
(Austria)-[:VOTE {year:2014,score:7 }]->(Hungary),
(Austria)-[:VOTE {year:2014,score:6 }]->(Sweden),
(Austria)-[:VOTE {year:2014,score:12 }]->(Armenia),
(Austria)-[:VOTE {year:2014,score:1 }]->(Norway),
(Austria)-[:VOTE {year:2014,score:4 }]->(Finland),
(Austria)-[:VOTE {year:2014,score:8 }]->(Romania),
(Austria)-[:VOTE {year:2014,score:2 }]->(Iceland),
(Austria)-[:VOTE {year:2014,score:5 }]->(Ukraine),
(Austria)-[:VOTE {year:2014,score:10 }]->(Netherlands),
(Austria)-[:VOTE {year:2014,score:3 }]->(Switzerland),
(Malta)-[:VOTE {year:2014,score:1 }]->(Greece),
(Malta)-[:VOTE {year:2014,score:12 }]->(Italy),
(Malta)-[:VOTE {year:2014,score:7 }]->(Sweden),
(Malta)-[:VOTE {year:2014,score:6 }]->(Armenia),
(Malta)-[:VOTE {year:2014,score:2 }]->(Norway),
(Malta)-[:VOTE {year:2014,score:4 }]->(UnitedKingdom),
(Malta)-[:VOTE {year:2014,score:8 }]->(Romania),
(Malta)-[:VOTE {year:2014,score:5 }]->(Russia),
(Malta)-[:VOTE {year:2014,score:10 }]->(Austria),
(Malta)-[:VOTE {year:2014,score:3 }]->(Switzerland),
(Ukraine)-[:VOTE {year:2014,score:3 }]->(Hungary),
(Ukraine)-[:VOTE {year:2014,score:2 }]->(Spain),
(Ukraine)-[:VOTE {year:2014,score:6 }]->(Belarus),
(Ukraine)-[:VOTE {year:2014,score:10 }]->(Armenia),
(Ukraine)-[:VOTE {year:2014,score:1 }]->(Azerbaijan),
(Ukraine)-[:VOTE {year:2014,score:12 }]->(Sweden),
(Ukraine)-[:VOTE {year:2014,score:4 }]->(Russia),
(Ukraine)-[:VOTE {year:2014,score:8 }]->(Austria),
(Ukraine)-[:VOTE {year:2014,score:5 }]->(Germany),
(Ukraine)-[:VOTE {year:2014,score:7 }]->(Poland),
(Latvia)-[:VOTE {year:2014,score:1 }]->(Hungary),
(Latvia)-[:VOTE {year:2014,score:4 }]->(Spain),
(Latvia)-[:VOTE {year:2014,score:7 }]->(Ukraine),
(Latvia)-[:VOTE {year:2014,score:10 }]->(Armenia),
(Latvia)-[:VOTE {year:2014,score:5 }]->(Norway),
(Latvia)-[:VOTE {year:2014,score:8 }]->(Sweden),
(Latvia)-[:VOTE {year:2014,score:2 }]->(Russia),
(Latvia)-[:VOTE {year:2014,score:3 }]->(Finland),
(Latvia)-[:VOTE {year:2014,score:6 }]->(Austria),
(Latvia)-[:VOTE {year:2014,score:12 }]->(Netherlands),
(Lithuania)-[:VOTE {year:2015,score:6 }]->(Georgia),
(Lithuania)-[:VOTE {year:2015,score:1 }]->(Italy),
(Lithuania)-[:VOTE {year:2015,score:7 }]->(Belgium),
(Lithuania)-[:VOTE {year:2015,score:5 }]->(Norway),
(Lithuania)-[:VOTE {year:2015,score:3 }]->(Australia),
(Lithuania)-[:VOTE {year:2015,score:4 }]->(Slovenia),
(Lithuania)-[:VOTE {year:2015,score:10 }]->(Sweden),
(Lithuania)-[:VOTE {year:2015,score:2 }]->(Azerbaijan),
(Lithuania)-[:VOTE {year:2015,score:12 }]->(Latvia),
(Lithuania)-[:VOTE {year:2015,score:8 }]->(Estonia),
(Belgium)-[:VOTE {year:2015,score:1 }]->(Georgia),
(Belgium)-[:VOTE {year:2015,score:8 }]->(Italy),
(Belgium)-[:VOTE {year:2015,score:3 }]->(Armenia),
(Belgium)-[:VOTE {year:2015,score:6 }]->(Albania),
(Belgium)-[:VOTE {year:2015,score:4 }]->(Australia),
(Belgium)-[:VOTE {year:2015,score:5 }]->(Romania),
(Belgium)-[:VOTE {year:2015,score:10 }]->(Russia),
(Belgium)-[:VOTE {year:2015,score:12 }]->(Sweden),
(Belgium)-[:VOTE {year:2015,score:7 }]->(Latvia),
(Belgium)-[:VOTE {year:2015,score:2 }]->(Estonia),
(Albania)-[:VOTE {year:2015,score:2 }]->(Serbia),
(Albania)-[:VOTE {year:2015,score:12 }]->(Italy),
(Albania)-[:VOTE {year:2015,score:7 }]->(Sweden),
(Albania)-[:VOTE {year:2015,score:3 }]->(Australia),
(Albania)-[:VOTE {year:2015,score:10 }]->(Greece),
(Albania)-[:VOTE {year:2015,score:8 }]->(Russia),
(Albania)-[:VOTE {year:2015,score:5 }]->(Israel),
(Albania)-[:VOTE {year:2015,score:1 }]->(Belgium),
(Albania)-[:VOTE {year:2015,score:6 }]->(Montenegro),
(Albania)-[:VOTE {year:2015,score:4 }]->(Estonia),
(Sweden)-[:VOTE {year:2015,score:1 }]->(Slovenia),
(Sweden)-[:VOTE {year:2015,score:8 }]->(Italy),
(Sweden)-[:VOTE {year:2015,score:7 }]->(Norway),
(Sweden)-[:VOTE {year:2015,score:12 }]->(Australia),
(Sweden)-[:VOTE {year:2015,score:6 }]->(Russia),
(Sweden)-[:VOTE {year:2015,score:4 }]->(Israel),
(Sweden)-[:VOTE {year:2015,score:10 }]->(Belgium),
(Sweden)-[:VOTE {year:2015,score:2 }]->(Montenegro),
(Sweden)-[:VOTE {year:2015,score:5 }]->(Latvia),
(Sweden)-[:VOTE {year:2015,score:3 }]->(Estonia),
(Australia)-[:VOTE {year:2015,score:5 }]->(Serbia),
(Australia)-[:VOTE {year:2015,score:1 }]->(Georgia),
(Australia)-[:VOTE {year:2015,score:8 }]->(Italy),
(Australia)-[:VOTE {year:2015,score:12 }]->(Sweden),
(Australia)-[:VOTE {year:2015,score:4 }]->(Norway),
(Australia)-[:VOTE {year:2015,score:10 }]->(Russia),
(Australia)-[:VOTE {year:2015,score:2 }]->(Israel),
(Australia)-[:VOTE {year:2015,score:6 }]->(Belgium),
(Australia)-[:VOTE {year:2015,score:7 }]->(Latvia),
(Australia)-[:VOTE {year:2015,score:3 }]->(Estonia),
(Slovenia)-[:VOTE {year:2015,score:6 }]->(Serbia),
(Slovenia)-[:VOTE {year:2015,score:8 }]->(Italy),
(Slovenia)-[:VOTE {year:2015,score:12 }]->(Sweden),
(Slovenia)-[:VOTE {year:2015,score:4 }]->(Norway),
(Slovenia)-[:VOTE {year:2015,score:2 }]->(Australia),
(Slovenia)-[:VOTE {year:2015,score:5 }]->(Russia),
(Slovenia)-[:VOTE {year:2015,score:10 }]->(Montenegro),
(Slovenia)-[:VOTE {year:2015,score:3 }]->(Belgium),
(Slovenia)-[:VOTE {year:2015,score:1 }]->(Cyprus),
(Slovenia)-[:VOTE {year:2015,score:7 }]->(Latvia),
(Netherlands)-[:VOTE {year:2015,score:1 }]->(Serbia),
(Netherlands)-[:VOTE {year:2015,score:7 }]->(Italy),
(Netherlands)-[:VOTE {year:2015,score:10 }]->(Sweden),
(Netherlands)-[:VOTE {year:2015,score:3 }]->(Norway),
(Netherlands)-[:VOTE {year:2015,score:8 }]->(Australia),
(Netherlands)-[:VOTE {year:2015,score:6 }]->(Russia),
(Netherlands)-[:VOTE {year:2015,score:5 }]->(Israel),
(Netherlands)-[:VOTE {year:2015,score:12 }]->(Belgium),
(Netherlands)-[:VOTE {year:2015,score:2 }]->(Latvia),
(Netherlands)-[:VOTE {year:2015,score:4 }]->(Estonia),
(SanMarino)-[:VOTE {year:2015,score:4 }]->(Hungary),
(SanMarino)-[:VOTE {year:2015,score:10 }]->(Italy),
(SanMarino)-[:VOTE {year:2015,score:7 }]->(Sweden),
(SanMarino)-[:VOTE {year:2015,score:6 }]->(Norway),
(SanMarino)-[:VOTE {year:2015,score:8 }]->(Australia),
(SanMarino)-[:VOTE {year:2015,score:3 }]->(UnitedKingdom),
(SanMarino)-[:VOTE {year:2015,score:1 }]->(France),
(SanMarino)-[:VOTE {year:2015,score:5 }]->(Belgium),
(SanMarino)-[:VOTE {year:2015,score:2 }]->(Israel),
(SanMarino)-[:VOTE {year:2015,score:12 }]->(Latvia),
(Estonia)-[:VOTE {year:2015,score:8 }]->(Hungary),
(Estonia)-[:VOTE {year:2015,score:1 }]->(Georgia),
(Estonia)-[:VOTE {year:2015,score:3 }]->(Italy),
(Estonia)-[:VOTE {year:2015,score:2 }]->(Lithuania),
(Estonia)-[:VOTE {year:2015,score:10 }]->(Sweden),
(Estonia)-[:VOTE {year:2015,score:4 }]->(Norway),
(Estonia)-[:VOTE {year:2015,score:5 }]->(Australia),
(Estonia)-[:VOTE {year:2015,score:12 }]->(Russia),
(Estonia)-[:VOTE {year:2015,score:7 }]->(Belgium),
(Estonia)-[:VOTE {year:2015,score:6 }]->(Latvia),
(Spain)-[:VOTE {year:2015,score:12 }]->(Italy),
(Spain)-[:VOTE {year:2015,score:8 }]->(Sweden),
(Spain)-[:VOTE {year:2015,score:2 }]->(Norway),
(Spain)-[:VOTE {year:2015,score:7 }]->(Australia),
(Spain)-[:VOTE {year:2015,score:5 }]->(Romania),
(Spain)-[:VOTE {year:2015,score:10 }]->(Russia),
(Spain)-[:VOTE {year:2015,score:1 }]->(Israel),
(Spain)-[:VOTE {year:2015,score:6 }]->(Belgium),
(Spain)-[:VOTE {year:2015,score:4 }]->(Latvia),
(Spain)-[:VOTE {year:2015,score:3 }]->(Estonia),
(Finland)-[:VOTE {year:2015,score:1 }]->(Slovenia),
(Finland)-[:VOTE {year:2015,score:2 }]->(Italy),
(Finland)-[:VOTE {year:2015,score:12 }]->(Sweden),
(Finland)-[:VOTE {year:2015,score:4 }]->(Norway),
(Finland)-[:VOTE {year:2015,score:5 }]->(Australia),
(Finland)-[:VOTE {year:2015,score:8 }]->(Russia),
(Finland)-[:VOTE {year:2015,score:3 }]->(Israel),
(Finland)-[:VOTE {year:2015,score:7 }]->(Belgium),
(Finland)-[:VOTE {year:2015,score:6 }]->(Latvia),
(Finland)-[:VOTE {year:2015,score:10 }]->(Estonia),
(Romania)-[:VOTE {year:2015,score:4 }]->(Hungary),
(Romania)-[:VOTE {year:2015,score:12 }]->(Italy),
(Romania)-[:VOTE {year:2015,score:7 }]->(Belgium),
(Romania)-[:VOTE {year:2015,score:8 }]->(Sweden),
(Romania)-[:VOTE {year:2015,score:6 }]->(Norway),
(Romania)-[:VOTE {year:2015,score:2 }]->(Australia),
(Romania)-[:VOTE {year:2015,score:10 }]->(Russia),
(Romania)-[:VOTE {year:2015,score:1 }]->(Israel),
(Romania)-[:VOTE {year:2015,score:3 }]->(Azerbaijan),
(Romania)-[:VOTE {year:2015,score:5 }]->(Latvia),
(Ireland)-[:VOTE {year:2015,score:6 }]->(Italy),
(Ireland)-[:VOTE {year:2015,score:2 }]->(Belgium),
(Ireland)-[:VOTE {year:2015,score:10 }]->(Sweden),
(Ireland)-[:VOTE {year:2015,score:4 }]->(Norway),
(Ireland)-[:VOTE {year:2015,score:5 }]->(Australia),
(Ireland)-[:VOTE {year:2015,score:1 }]->(UnitedKingdom),
(Ireland)-[:VOTE {year:2015,score:8 }]->(Russia),
(Ireland)-[:VOTE {year:2015,score:7 }]->(Lithuania),
(Ireland)-[:VOTE {year:2015,score:12 }]->(Latvia),
(Ireland)-[:VOTE {year:2015,score:3 }]->(Poland),
(Portugal)-[:VOTE {year:2015,score:12 }]->(Italy),
(Portugal)-[:VOTE {year:2015,score:8 }]->(Sweden),
(Portugal)-[:VOTE {year:2015,score:6 }]->(Norway),
(Portugal)-[:VOTE {year:2015,score:4 }]->(Romania),
(Portugal)-[:VOTE {year:2015,score:10 }]->(Russia),
(Portugal)-[:VOTE {year:2015,score:7 }]->(Israel),
(Portugal)-[:VOTE {year:2015,score:5 }]->(Belgium),
(Portugal)-[:VOTE {year:2015,score:3 }]->(Spain),
(Portugal)-[:VOTE {year:2015,score:2 }]->(Latvia),
(Portugal)-[:VOTE {year:2015,score:1 }]->(Estonia),
(Belarus)-[:VOTE {year:2015,score:3 }]->(Georgia),
(Belarus)-[:VOTE {year:2015,score:1 }]->(Italy),
(Belarus)-[:VOTE {year:2015,score:10 }]->(Sweden),
(Belarus)-[:VOTE {year:2015,score:4 }]->(Armenia),
(Belarus)-[:VOTE {year:2015,score:6 }]->(Australia),
(Belarus)-[:VOTE {year:2015,score:12 }]->(Russia),
(Belarus)-[:VOTE {year:2015,score:2 }]->(Israel),
(Belarus)-[:VOTE {year:2015,score:8 }]->(Belgium),
(Belarus)-[:VOTE {year:2015,score:5 }]->(Latvia),
(Belarus)-[:VOTE {year:2015,score:7 }]->(Estonia),
(Cyprus)-[:VOTE {year:2015,score:1 }]->(Romania),
(Cyprus)-[:VOTE {year:2015,score:12 }]->(Italy),
(Cyprus)-[:VOTE {year:2015,score:10 }]->(Sweden),
(Cyprus)-[:VOTE {year:2015,score:4 }]->(Australia),
(Cyprus)-[:VOTE {year:2015,score:8 }]->(Greece),
(Cyprus)-[:VOTE {year:2015,score:5 }]->(Russia),
(Cyprus)-[:VOTE {year:2015,score:6 }]->(Israel),
(Cyprus)-[:VOTE {year:2015,score:7 }]->(Belgium),
(Cyprus)-[:VOTE {year:2015,score:3 }]->(Latvia),
(Cyprus)-[:VOTE {year:2015,score:2 }]->(Estonia),
(Moldova)-[:VOTE {year:2015,score:5 }]->(Georgia),
(Moldova)-[:VOTE {year:2015,score:7 }]->(Italy),
(Moldova)-[:VOTE {year:2015,score:6 }]->(Belgium),
(Moldova)-[:VOTE {year:2015,score:8 }]->(Sweden),
(Moldova)-[:VOTE {year:2015,score:4 }]->(Australia),
(Moldova)-[:VOTE {year:2015,score:12 }]->(Romania),
(Moldova)-[:VOTE {year:2015,score:10 }]->(Russia),
(Moldova)-[:VOTE {year:2015,score:3 }]->(Azerbaijan),
(Moldova)-[:VOTE {year:2015,score:1 }]->(Spain),
(Moldova)-[:VOTE {year:2015,score:2 }]->(Latvia),
(Serbia)-[:VOTE {year:2015,score:5 }]->(Slovenia),
(Serbia)-[:VOTE {year:2015,score:7 }]->(Italy),
(Serbia)-[:VOTE {year:2015,score:8 }]->(Sweden),
(Serbia)-[:VOTE {year:2015,score:3 }]->(Australia),
(Serbia)-[:VOTE {year:2015,score:10 }]->(Russia),
(Serbia)-[:VOTE {year:2015,score:6 }]->(Israel),
(Serbia)-[:VOTE {year:2015,score:4 }]->(Belgium),
(Serbia)-[:VOTE {year:2015,score:12 }]->(Montenegro),
(Serbia)-[:VOTE {year:2015,score:1 }]->(Latvia),
(Serbia)-[:VOTE {year:2015,score:2 }]->(Estonia),
(Montenegro)-[:VOTE {year:2015,score:12 }]->(Serbia),
(Montenegro)-[:VOTE {year:2015,score:4 }]->(Slovenia),
(Montenegro)-[:VOTE {year:2015,score:6 }]->(Italy),
(Montenegro)-[:VOTE {year:2015,score:5 }]->(Sweden),
(Montenegro)-[:VOTE {year:2015,score:10 }]->(Albania),
(Montenegro)-[:VOTE {year:2015,score:7 }]->(Russia),
(Montenegro)-[:VOTE {year:2015,score:3 }]->(Israel),
(Montenegro)-[:VOTE {year:2015,score:8 }]->(Azerbaijan),
(Montenegro)-[:VOTE {year:2015,score:2 }]->(Spain),
(Montenegro)-[:VOTE {year:2015,score:1 }]->(Estonia),
(Armenia)-[:VOTE {year:2015,score:10 }]->(Georgia),
(Armenia)-[:VOTE {year:2015,score:6 }]->(Italy),
(Armenia)-[:VOTE {year:2015,score:7 }]->(Sweden),
(Armenia)-[:VOTE {year:2015,score:1 }]->(Australia),
(Armenia)-[:VOTE {year:2015,score:5 }]->(Greece),
(Armenia)-[:VOTE {year:2015,score:12 }]->(Russia),
(Armenia)-[:VOTE {year:2015,score:3 }]->(France),
(Armenia)-[:VOTE {year:2015,score:4 }]->(Belgium),
(Armenia)-[:VOTE {year:2015,score:8 }]->(Montenegro),
(Armenia)-[:VOTE {year:2015,score:2 }]->(Latvia),
(Azerbaijan)-[:VOTE {year:2015,score:10 }]->(Georgia),
(Azerbaijan)-[:VOTE {year:2015,score:8 }]->(Italy),
(Azerbaijan)-[:VOTE {year:2015,score:1 }]->(Spain),
(Azerbaijan)-[:VOTE {year:2015,score:3 }]->(Slovenia),
(Azerbaijan)-[:VOTE {year:2015,score:12 }]->(Russia),
(Azerbaijan)-[:VOTE {year:2015,score:7 }]->(Israel),
(Azerbaijan)-[:VOTE {year:2015,score:6 }]->(Sweden),
(Azerbaijan)-[:VOTE {year:2015,score:2 }]->(Montenegro),
(Azerbaijan)-[:VOTE {year:2015,score:5 }]->(Latvia),
(Azerbaijan)-[:VOTE {year:2015,score:4 }]->(Estonia),
(Norway)-[:VOTE {year:2015,score:1 }]->(Slovenia),
(Norway)-[:VOTE {year:2015,score:5 }]->(Italy),
(Norway)-[:VOTE {year:2015,score:6 }]->(Lithuania),
(Norway)-[:VOTE {year:2015,score:12 }]->(Sweden),
(Norway)-[:VOTE {year:2015,score:10 }]->(Australia),
(Norway)-[:VOTE {year:2015,score:2 }]->(Russia),
(Norway)-[:VOTE {year:2015,score:4 }]->(Israel),
(Norway)-[:VOTE {year:2015,score:7 }]->(Belgium),
(Norway)-[:VOTE {year:2015,score:8 }]->(Latvia),
(Norway)-[:VOTE {year:2015,score:3 }]->(Estonia),
(UnitedKingdom)-[:VOTE {year:2015,score:1 }]->(Serbia),
(UnitedKingdom)-[:VOTE {year:2015,score:8 }]->(Italy),
(UnitedKingdom)-[:VOTE {year:2015,score:4 }]->(Lithuania),
(UnitedKingdom)-[:VOTE {year:2015,score:12 }]->(Sweden),
(UnitedKingdom)-[:VOTE {year:2015,score:10 }]->(Australia),
(UnitedKingdom)-[:VOTE {year:2015,score:6 }]->(Russia),
(UnitedKingdom)-[:VOTE {year:2015,score:5 }]->(Israel),
(UnitedKingdom)-[:VOTE {year:2015,score:3 }]->(Belgium),
(UnitedKingdom)-[:VOTE {year:2015,score:7 }]->(Latvia),
(UnitedKingdom)-[:VOTE {year:2015,score:2 }]->(Poland),
(Macedonia)-[:VOTE {year:2015,score:10 }]->(Serbia),
(Macedonia)-[:VOTE {year:2015,score:8 }]->(Slovenia),
(Macedonia)-[:VOTE {year:2015,score:7 }]->(Italy),
(Macedonia)-[:VOTE {year:2015,score:5 }]->(Sweden),
(Macedonia)-[:VOTE {year:2015,score:3 }]->(Armenia),
(Macedonia)-[:VOTE {year:2015,score:12 }]->(Albania),
(Macedonia)-[:VOTE {year:2015,score:6 }]->(Russia),
(Macedonia)-[:VOTE {year:2015,score:1 }]->(Belgium),
(Macedonia)-[:VOTE {year:2015,score:4 }]->(Montenegro),
(Macedonia)-[:VOTE {year:2015,score:2 }]->(Estonia),
(Iceland)-[:VOTE {year:2015,score:2 }]->(Slovenia),
(Iceland)-[:VOTE {year:2015,score:6 }]->(Italy),
(Iceland)-[:VOTE {year:2015,score:12 }]->(Sweden),
(Iceland)-[:VOTE {year:2015,score:10 }]->(Norway),
(Iceland)-[:VOTE {year:2015,score:8 }]->(Australia),
(Iceland)-[:VOTE {year:2015,score:3 }]->(Russia),
(Iceland)-[:VOTE {year:2015,score:5 }]->(Israel),
(Iceland)-[:VOTE {year:2015,score:4 }]->(Belgium),
(Iceland)-[:VOTE {year:2015,score:7 }]->(Latvia),
(Iceland)-[:VOTE {year:2015,score:1 }]->(Estonia),
(Israel)-[:VOTE {year:2015,score:2 }]->(Serbia),
(Israel)-[:VOTE {year:2015,score:6 }]->(Slovenia),
(Israel)-[:VOTE {year:2015,score:12 }]->(Italy),
(Israel)-[:VOTE {year:2015,score:10 }]->(Sweden),
(Israel)-[:VOTE {year:2015,score:7 }]->(Australia),
(Israel)-[:VOTE {year:2015,score:5 }]->(Romania),
(Israel)-[:VOTE {year:2015,score:8 }]->(Russia),
(Israel)-[:VOTE {year:2015,score:4 }]->(Belgium),
(Israel)-[:VOTE {year:2015,score:1 }]->(Spain),
(Israel)-[:VOTE {year:2015,score:3 }]->(Estonia),
(Denmark)-[:VOTE {year:2015,score:5 }]->(Italy),
(Denmark)-[:VOTE {year:2015,score:1 }]->(Lithuania),
(Denmark)-[:VOTE {year:2015,score:12 }]->(Sweden),
(Denmark)-[:VOTE {year:2015,score:3 }]->(Norway),
(Denmark)-[:VOTE {year:2015,score:8 }]->(Australia),
(Denmark)-[:VOTE {year:2015,score:2 }]->(Romania),
(Denmark)-[:VOTE {year:2015,score:10 }]->(Russia),
(Denmark)-[:VOTE {year:2015,score:7 }]->(Belgium),
(Denmark)-[:VOTE {year:2015,score:4 }]->(Latvia),
(Denmark)-[:VOTE {year:2015,score:6 }]->(Estonia),
(Germany)-[:VOTE {year:2015,score:1 }]->(Hungary),
(Germany)-[:VOTE {year:2015,score:3 }]->(Italy),
(Germany)-[:VOTE {year:2015,score:10 }]->(Sweden),
(Germany)-[:VOTE {year:2015,score:4 }]->(Norway),
(Germany)-[:VOTE {year:2015,score:7 }]->(Australia),
(Germany)-[:VOTE {year:2015,score:12 }]->(Russia),
(Germany)-[:VOTE {year:2015,score:5 }]->(Israel),
(Germany)-[:VOTE {year:2015,score:8 }]->(Belgium),
(Germany)-[:VOTE {year:2015,score:6 }]->(Latvia),
(Germany)-[:VOTE {year:2015,score:2 }]->(Estonia),
(Hungary)-[:VOTE {year:2015,score:3 }]->(Georgia),
(Hungary)-[:VOTE {year:2015,score:2 }]->(Italy),
(Hungary)-[:VOTE {year:2015,score:10 }]->(Sweden),
(Hungary)-[:VOTE {year:2015,score:4 }]->(Norway),
(Hungary)-[:VOTE {year:2015,score:8 }]->(Australia),
(Hungary)-[:VOTE {year:2015,score:1 }]->(Romania),
(Hungary)-[:VOTE {year:2015,score:6 }]->(Russia),
(Hungary)-[:VOTE {year:2015,score:12 }]->(Belgium),
(Hungary)-[:VOTE {year:2015,score:5 }]->(Latvia),
(Hungary)-[:VOTE {year:2015,score:7 }]->(Estonia),
(Georgia)-[:VOTE {year:2015,score:3 }]->(Lithuania),
(Georgia)-[:VOTE {year:2015,score:8 }]->(Italy),
(Georgia)-[:VOTE {year:2015,score:6 }]->(Belgium),
(Georgia)-[:VOTE {year:2015,score:12 }]->(Armenia),
(Georgia)-[:VOTE {year:2015,score:7 }]->(Sweden),
(Georgia)-[:VOTE {year:2015,score:5 }]->(Russia),
(Georgia)-[:VOTE {year:2015,score:1 }]->(Israel),
(Georgia)-[:VOTE {year:2015,score:10 }]->(Azerbaijan),
(Georgia)-[:VOTE {year:2015,score:4 }]->(Latvia),
(Georgia)-[:VOTE {year:2015,score:2 }]->(Estonia),
(Italy)-[:VOTE {year:2015,score:3 }]->(Serbia),
(Italy)-[:VOTE {year:2015,score:1 }]->(Poland),
(Italy)-[:VOTE {year:2015,score:12 }]->(Sweden),
(Italy)-[:VOTE {year:2015,score:5 }]->(Norway),
(Italy)-[:VOTE {year:2015,score:6 }]->(Australia),
(Italy)-[:VOTE {year:2015,score:10 }]->(Russia),
(Italy)-[:VOTE {year:2015,score:8 }]->(Israel),
(Italy)-[:VOTE {year:2015,score:7 }]->(Belgium),
(Italy)-[:VOTE {year:2015,score:4 }]->(Latvia),
(Italy)-[:VOTE {year:2015,score:2 }]->(Estonia),
(Poland)-[:VOTE {year:2015,score:1 }]->(Slovenia),
(Poland)-[:VOTE {year:2015,score:7 }]->(Italy),
(Poland)-[:VOTE {year:2015,score:12 }]->(Sweden),
(Poland)-[:VOTE {year:2015,score:3 }]->(Norway),
(Poland)-[:VOTE {year:2015,score:8 }]->(Australia),
(Poland)-[:VOTE {year:2015,score:6 }]->(Russia),
(Poland)-[:VOTE {year:2015,score:4 }]->(Israel),
(Poland)-[:VOTE {year:2015,score:5 }]->(Belgium),
(Poland)-[:VOTE {year:2015,score:10 }]->(Latvia),
(Poland)-[:VOTE {year:2015,score:2 }]->(Estonia),
(Switzerland)-[:VOTE {year:2015,score:5 }]->(Serbia),
(Switzerland)-[:VOTE {year:2015,score:6 }]->(Italy),
(Switzerland)-[:VOTE {year:2015,score:12 }]->(Sweden),
(Switzerland)-[:VOTE {year:2015,score:10 }]->(Norway),
(Switzerland)-[:VOTE {year:2015,score:8 }]->(Australia),
(Switzerland)-[:VOTE {year:2015,score:7 }]->(Russia),
(Switzerland)-[:VOTE {year:2015,score:3 }]->(Israel),
(Switzerland)-[:VOTE {year:2015,score:2 }]->(Belgium),
(Switzerland)-[:VOTE {year:2015,score:1 }]->(Spain),
(Switzerland)-[:VOTE {year:2015,score:4 }]->(Latvia),
(Greece)-[:VOTE {year:2015,score:2 }]->(Georgia),
(Greece)-[:VOTE {year:2015,score:12 }]->(Italy),
(Greece)-[:VOTE {year:2015,score:4 }]->(Sweden),
(Greece)-[:VOTE {year:2015,score:1 }]->(Armenia),
(Greece)-[:VOTE {year:2015,score:6 }]->(Albania),
(Greece)-[:VOTE {year:2015,score:5 }]->(Australia),
(Greece)-[:VOTE {year:2015,score:8 }]->(Russia),
(Greece)-[:VOTE {year:2015,score:7 }]->(Belgium),
(Greece)-[:VOTE {year:2015,score:10 }]->(Cyprus),
(Greece)-[:VOTE {year:2015,score:3 }]->(Latvia),
(Russia)-[:VOTE {year:2015,score:5 }]->(Georgia),
(Russia)-[:VOTE {year:2015,score:12 }]->(Italy),
(Russia)-[:VOTE {year:2015,score:10 }]->(Belgium),
(Russia)-[:VOTE {year:2015,score:6 }]->(Armenia),
(Russia)-[:VOTE {year:2015,score:8 }]->(Sweden),
(Russia)-[:VOTE {year:2015,score:4 }]->(Australia),
(Russia)-[:VOTE {year:2015,score:3 }]->(Azerbaijan),
(Russia)-[:VOTE {year:2015,score:1 }]->(Spain),
(Russia)-[:VOTE {year:2015,score:2 }]->(Latvia),
(Russia)-[:VOTE {year:2015,score:7 }]->(Estonia),
(France)-[:VOTE {year:2015,score:1 }]->(Hungary),
(France)-[:VOTE {year:2015,score:6 }]->(Italy),
(France)-[:VOTE {year:2015,score:4 }]->(Poland),
(France)-[:VOTE {year:2015,score:3 }]->(Armenia),
(France)-[:VOTE {year:2015,score:8 }]->(Sweden),
(France)-[:VOTE {year:2015,score:2 }]->(Australia),
(France)-[:VOTE {year:2015,score:10 }]->(Russia),
(France)-[:VOTE {year:2015,score:12 }]->(Belgium),
(France)-[:VOTE {year:2015,score:5 }]->(Spain),
(France)-[:VOTE {year:2015,score:7 }]->(Latvia),
(Austria)-[:VOTE {year:2015,score:3 }]->(Serbia),
(Austria)-[:VOTE {year:2015,score:10 }]->(Italy),
(Austria)-[:VOTE {year:2015,score:7 }]->(Sweden),
(Austria)-[:VOTE {year:2015,score:4 }]->(Norway),
(Austria)-[:VOTE {year:2015,score:12 }]->(Australia),
(Austria)-[:VOTE {year:2015,score:8 }]->(Russia),
(Austria)-[:VOTE {year:2015,score:2 }]->(Israel),
(Austria)-[:VOTE {year:2015,score:5 }]->(Belgium),
(Austria)-[:VOTE {year:2015,score:1 }]->(Latvia),
(Austria)-[:VOTE {year:2015,score:6 }]->(Estonia),
(Malta)-[:VOTE {year:2015,score:12 }]->(Italy),
(Malta)-[:VOTE {year:2015,score:10 }]->(Sweden),
(Malta)-[:VOTE {year:2015,score:2 }]->(Norway),
(Malta)-[:VOTE {year:2015,score:6 }]->(Australia),
(Malta)-[:VOTE {year:2015,score:1 }]->(UnitedKingdom),
(Malta)-[:VOTE {year:2015,score:7 }]->(Russia),
(Malta)-[:VOTE {year:2015,score:5 }]->(Israel),
(Malta)-[:VOTE {year:2015,score:8 }]->(Azerbaijan),
(Malta)-[:VOTE {year:2015,score:4 }]->(Latvia),
(Malta)-[:VOTE {year:2015,score:3 }]->(Estonia),
(Latvia)-[:VOTE {year:2015,score:3 }]->(Slovenia),
(Latvia)-[:VOTE {year:2015,score:8 }]->(Italy),
(Latvia)-[:VOTE {year:2015,score:7 }]->(Lithuania),
(Latvia)-[:VOTE {year:2015,score:12 }]->(Sweden),
(Latvia)-[:VOTE {year:2015,score:2 }]->(Norway),
(Latvia)-[:VOTE {year:2015,score:5 }]->(Australia),
(Latvia)-[:VOTE {year:2015,score:10 }]->(Russia),
(Latvia)-[:VOTE {year:2015,score:1 }]->(Israel),
(Latvia)-[:VOTE {year:2015,score:4 }]->(Belgium),
(Latvia)-[:VOTE {year:2015,score:6 }]->(Estonia),
(CzechRepublic)-[:VOTE {year:2015,score:1 }]->(Hungary),
(CzechRepublic)-[:VOTE {year:2015,score:4 }]->(Georgia),
(CzechRepublic)-[:VOTE {year:2015,score:7 }]->(Italy),
(CzechRepublic)-[:VOTE {year:2015,score:6 }]->(Belgium),
(CzechRepublic)-[:VOTE {year:2015,score:2 }]->(Armenia),
(CzechRepublic)-[:VOTE {year:2015,score:10 }]->(Sweden),
(CzechRepublic)-[:VOTE {year:2015,score:8 }]->(Russia),
(CzechRepublic)-[:VOTE {year:2015,score:12 }]->(Azerbaijan),
(CzechRepublic)-[:VOTE {year:2015,score:3 }]->(Serbia),
(CzechRepublic)-[:VOTE {year:2015,score:5 }]->(Latvia)
For people that notices "Autralia", it’s not a typo with "Austria", Australia did participate to Eurovision as candidate in 2015.
Who participated, which year was it and as candidate or voter ?
Let’s start simple by checking who participated at which final and who was only voting.
MATCH (country)-[v:VOTE]->()
WITH country, count(DISTINCT v.year) AS nb_voting ,collect(DISTINCT v.year) AS year_voting
MATCH ()-[p:VOTE]->(country)
WITH country, nb_voting,year_voting, count(DISTINCT p.year) AS nb_participation ,collect(DISTINCT p.year) AS year_participation
RETURN country.name,nb_voting,year_voting,nb_participation,year_participation
ORDER BY nb_participation DESC
Vote distribution visualization within a year
Quick graph to represent the vote distribution within a year (here 2015).
MATCH path = (voter:Country)-[v:VOTE]->(candidate:Country)
WHERE v.year = 2015 AND v.score >= 8
RETURN path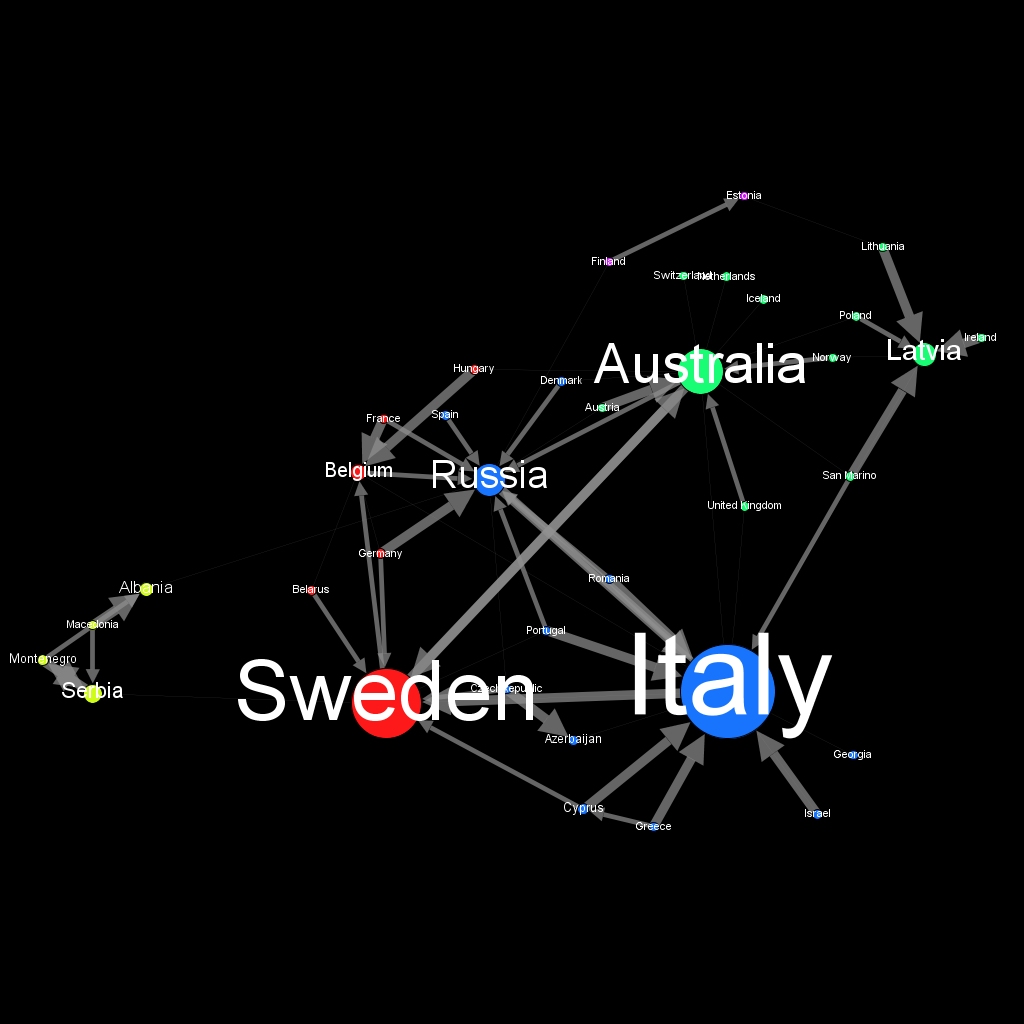
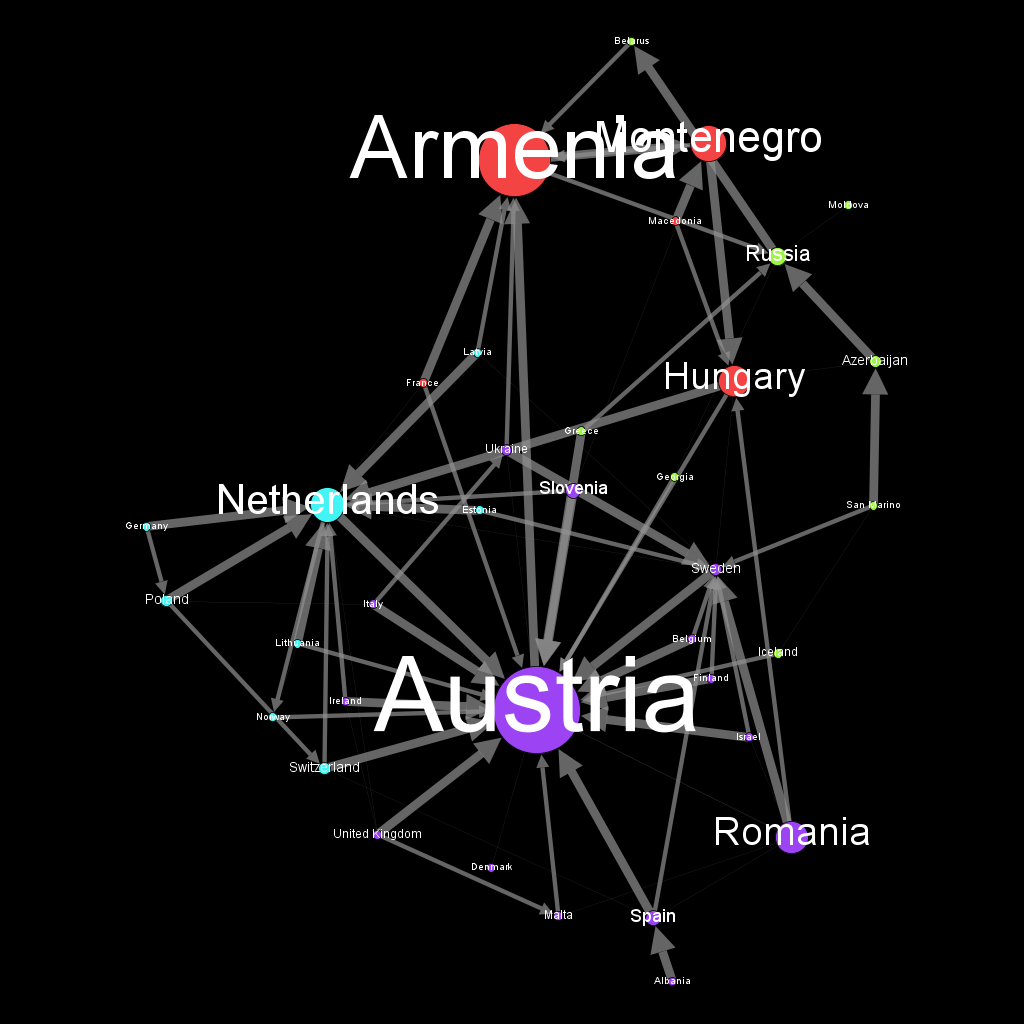
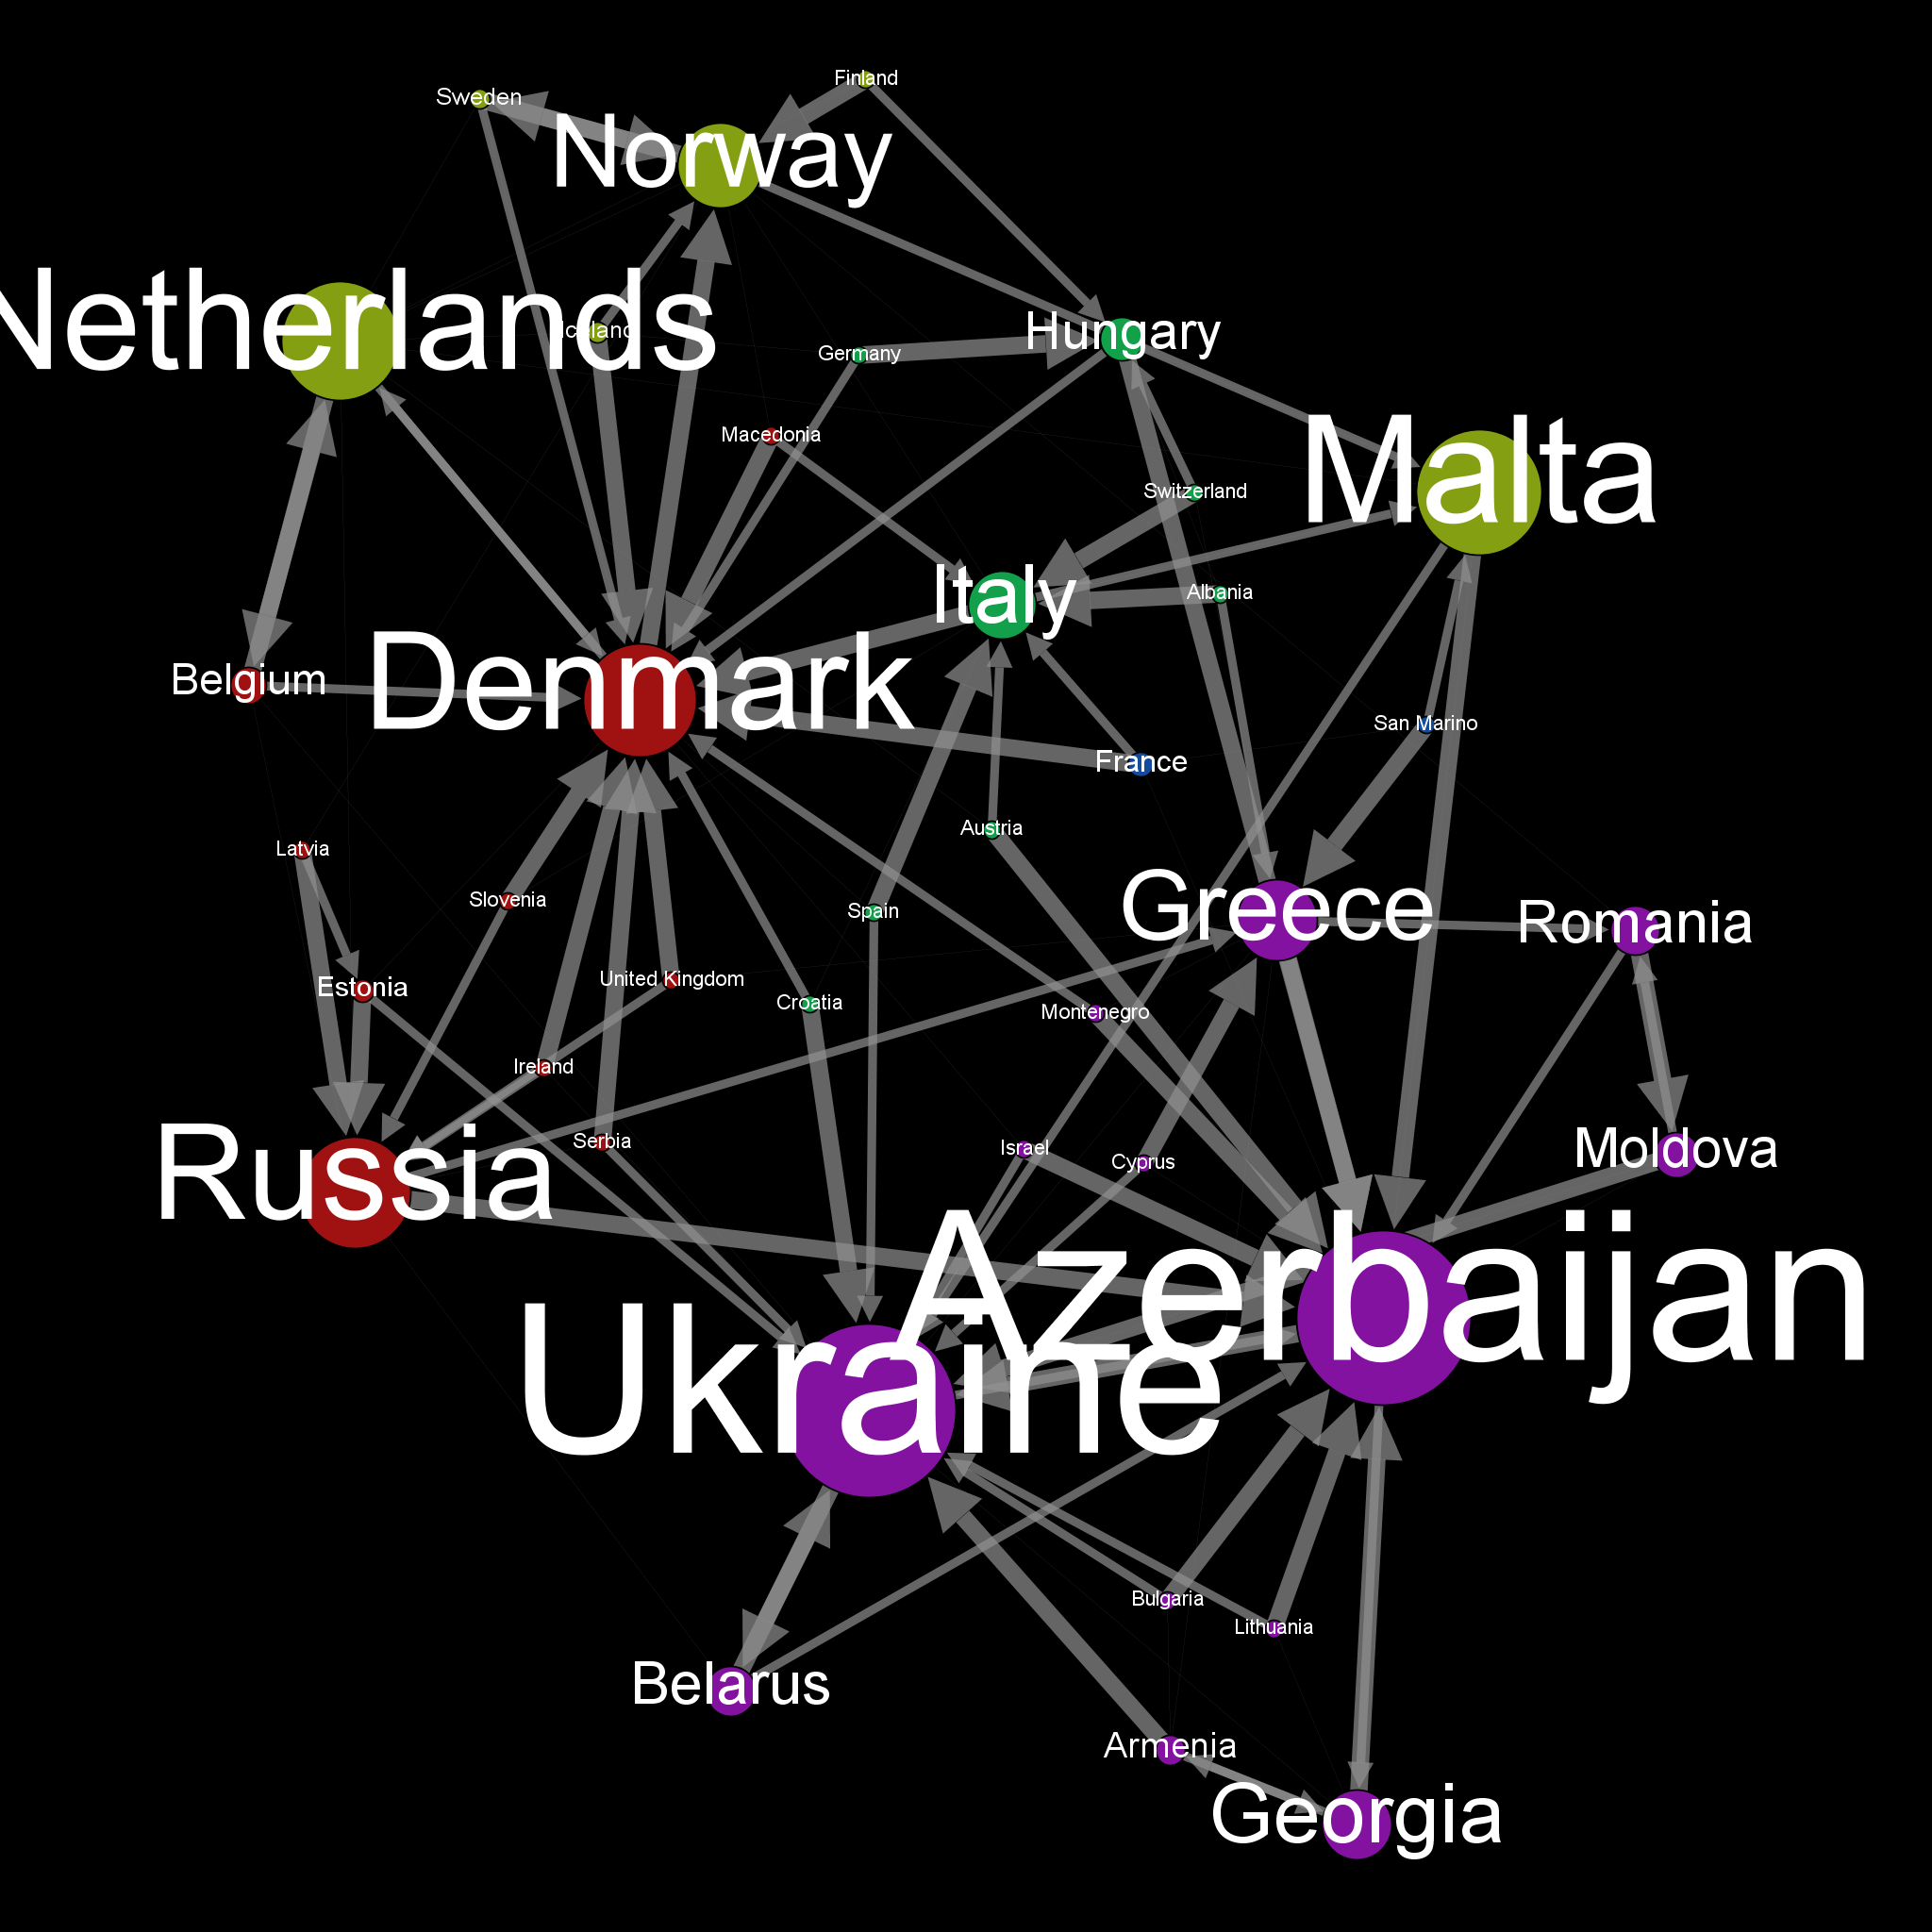
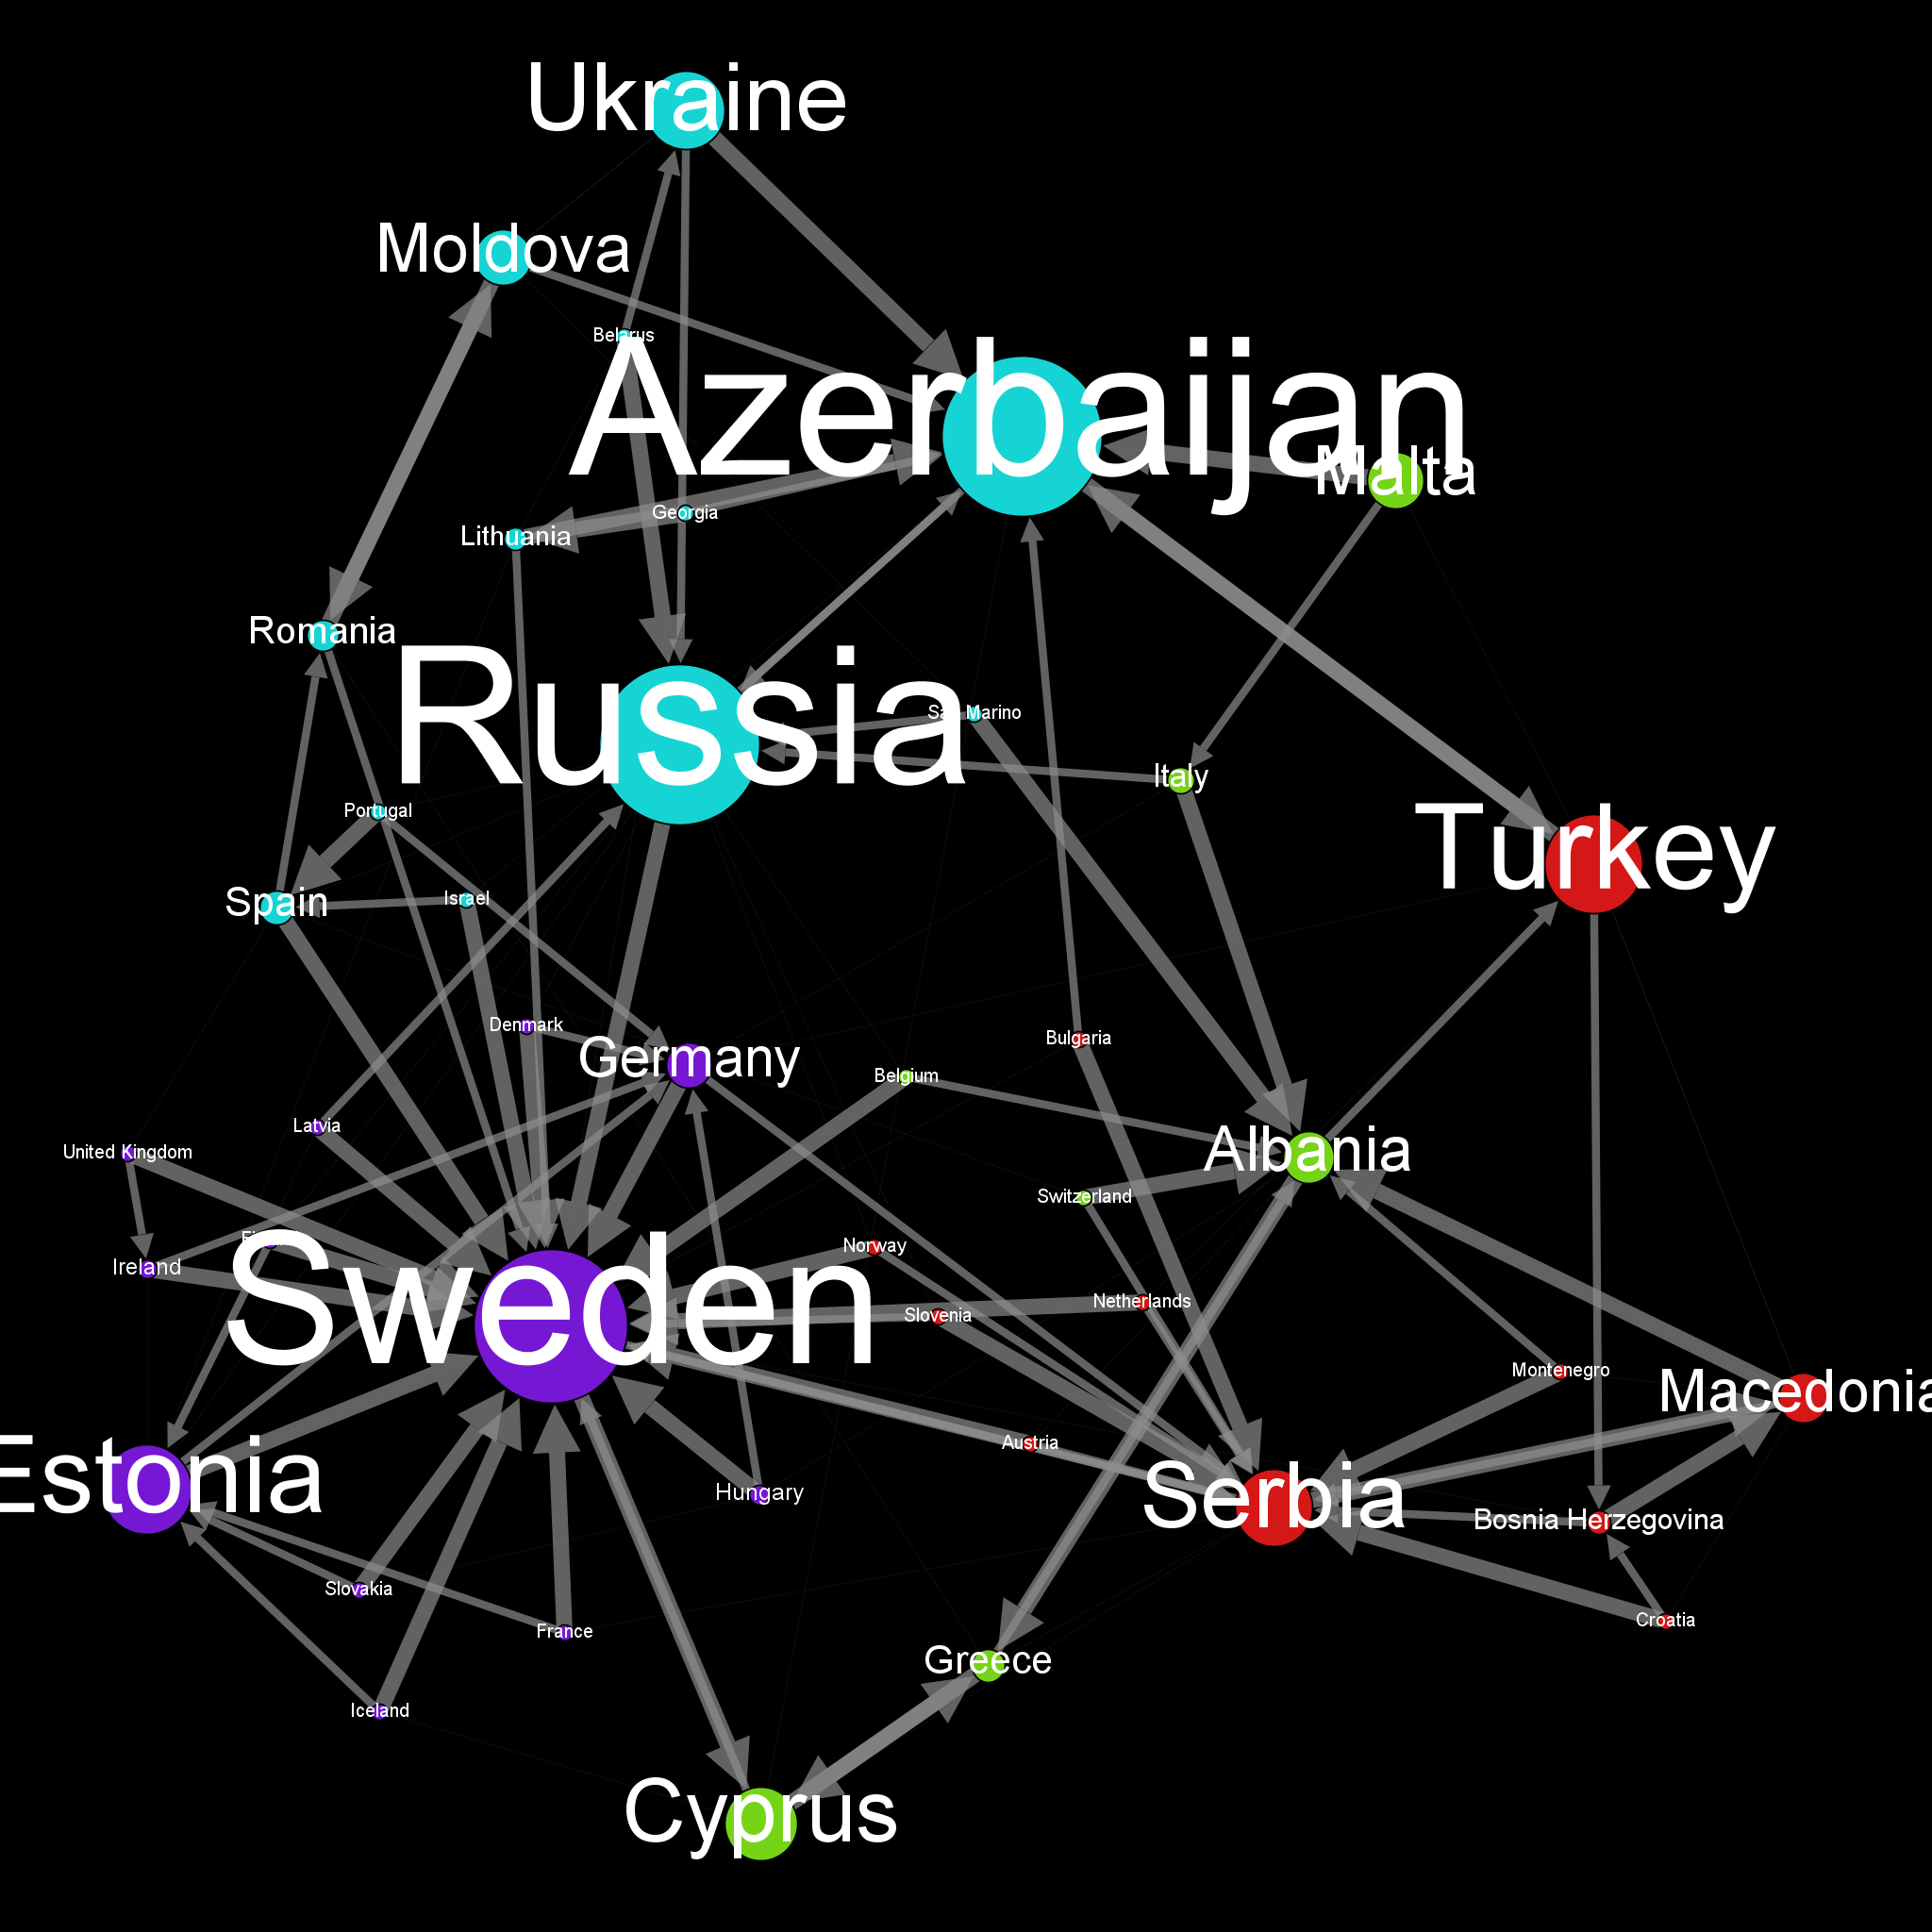
Best voter
Which voter always votes for the winner ?
MATCH (voter)-[vote:VOTE]->(country)
WHERE vote.score = 12 AND country.winner = "Yes"
WITH voter, COUNT(DISTINCT vote.year) AS nb_year , COLLECT(DISTINCT vote.year) AS years
WHERE nb_year = 4
RETURN voter.name,years
ORDER BY nb_year DESC
If you need to bet, UK looks a very good advisor :-D
Impact of votes ?
If we just gives the 8, 10, 12 points, does it change the rank per year ?
MATCH ()-[up:VOTE]->(country)
WHERE up.score >= 8
WITH country, up.year as year, SUM(up.score) AS up_score
MATCH ()-[all:VOTE]->(country)
WHERE all.year = year
WITH country, year, up_score , SUM(all.score) as all_score
RETURN country.name,year, all_score,up_score
ORDER BY year,all_score DESC
So, sounds like the votes under 8 points doesn’t really influence the rank. Maybe some place are switch in the top 5, but no drastic change.
Diversity in votes
As we saw previously, the most important points given are the famous 8, 10 and 12. How theses votes are distributed per country each year ?
Let’s see how many different candidates a country voted for.
MATCH (a)-[e:VOTE]->(b)
WHERE e.score >= 8
WITH a, count(DISTINCT e.year) AS years, collect(DISTINCT b.name) AS candidate, count(DISTINCT b.name) AS nb_candidate,toFloat(count(DISTINCT b.name))/ toFloat(count(DISTINCT e.year)*3) AS ratio
WHERE ratio <> 1
RETURN a.name,candidate,nb_candidate,years,ratio
ORDER BY ratio ASC
Details
MATCH (voter)-[e:VOTE]->(candidate)
WHERE e.score >= 8
WITH voter, candidate, collect(DISTINCT e.year) AS years, COUNT(DISTINCT e.year) as nb_year
RETURN voter.name,candidate.name,years
ORDER BY nb_year DESC,voter.name
The ratio shows how "diverse" the votes of a country was during the 4 sessions. Most of countries almost voted different countries each time. But a few of them doesn’t have this variety of votes, and they almost votes the same candidate.
Visualization
MATCH w WHERE w.winner = "Yes" REMOVE w:Country SET w:Winner;
MATCH (a)-[e:VOTE]->(b)
WHERE e.score >= 8
WITH a,b, count(DISTINCT e.year) AS years
WHERE years >= 2
CREATE p= (a)-[r:SIMILAR_VOTE {nb:years}]->(b)

RETURN p
12 points go to … Foaf:
In this query, we will try to check the mutual votes per year where the score of both votes is up to 8.
MATCH (a)-[e:VOTE]->(b),(b)-[f:VOTE]->(a)
WHERE f.year = e.year AND e.score >= 8 AND f.score >= 8
RETURN a.name,b.name,e.year,e.score,f.score
ORDER BY e.year,a.name
This result is quite detailed, we can simplify by agregating by years.
MATCH (a)-[e:VOTE]->(b), (b)-[f:VOTE]->(a)
WHERE f.year = e.year AND e.score >= 8 AND f.score >= 8
WITH a,b,collect(DISTINCT e.year) as years,count(DISTINCT e.year) as nb_years
RETURN a.name,b.name,years
ORDER BY nb_years DESC
It’s interesting to see that there is actually countries that are mutualing voting to each other, and for some, it appears 2 times on 4 years.
Graph of Friends
Let’s visualize the last result
MATCH w WHERE w.winner = "Yes" REMOVE w:Country SET w:Winner;
MATCH p = (a)-[e:VOTE]->(b), q = (b)-[f:VOTE]->(a)
WHERE f.year = e.year AND e.score >= 8 AND f.score >= 8

RETURN p
Interesting, some winner sounds like part of a cluster of countries. But as they are winner, they automatically behave like 'hub' in the graph. Let’s do the same graph without them.
MATCH p = (a)-[e:VOTE]->(b), q = (b)-[f:VOTE]->(a)
WHERE f.year = e.year AND e.score >= 8 AND f.score >= 8 AND a.winner <> "Yes" AND b.winner <> "Yes"

RETURN p
With or without the winner candidates, the result is same : it almost looks like the World Border Graph. So it sounds like some countries are part of a "geographical gang".
Conclusion
For sure, the investigation can be improved by more data and analysed more in details.
We can’t conclude surely that countries are organised in "gang", but we can observe some interesting singularities and distinguish some cluster of country based on geographical location.
Is this page helpful?