Spreading the Savings Like Mayo: How Knowledge Graphs Can Transform Invoice Data and Lower Costs

Solutions Engineer, Neo4j
4 min read

In the world of business, where every penny counts, companies are constantly looking for ways to cut costs, streamline operations, and edge out the competition. But what if I told you the secret to lowering costs wasn’t hidden in complex algorithms or revolutionary tech but instead in the humble world of … mayo?
Yes, mayo.
Much like mayo is the unsung hero of a great sandwich, knowledge graphs can be the secret ingredient to better supplier relationships and cost efficiency. Let’s dive into how you can use them to achieve these goals — and spread the savings like never before.
What Are Knowledge Graphs?
A knowledge graph is a powerful data model that organizes information in a web of relationships between entities, rather than in isolated rows and columns like traditional databases. Think of it as connecting dots between people, companies, products, and transactions in a meaningful way, allowing you to visualize and analyze how they interact.
When applied to invoice data, knowledge graphs make it easier to spot trends, detect anomalies, and understand patterns in your procurement and supply chain. Whether you’re dealing with thousands of suppliers or millions of invoices, knowledge graphs give you a bird’s-eye view of your entire operation, helping you zero in on opportunities to save money, mitigate risks, and optimize relationships.
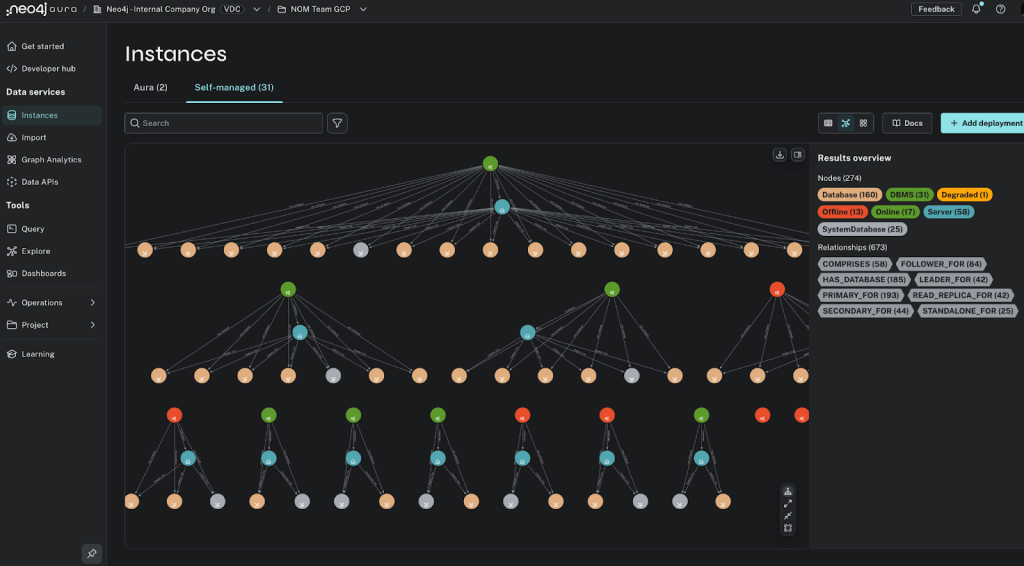
In the case of our customer, one of the largest corporate conglomerates in Mexico, the model included entities from the procurement process (where suppliers submit their offers) and from the accounting process (the actual purchase of goods). They are responsible for 2 percent of all invoices generated in the country.
The complete model is shown below.

The bottom section of the graph represents the procurement process; a supplier sends a purchase order (PO), which then generates a payment for an item. The top section represents the accounting section, revolving around the invoice; a tax ID, registered as a supplier, submits an invoice, which is then paid by another tax ID, owned by a line of business (LoB). The invoice is related to a transaction and the purchased item.
The result is the combination of two data domains in a single model that can now be used to analyze the interactions between these entities and find interesting insights.
So Where’s the Mayo?
One of our customer’s critical questions was whether there were certain high-frequency items that were being purchased by different cost centers at different prices. Blinded by the volume of data and siloed procurement teams, price differences are certainly easy to miss.
Our analysis began by ranking the top 10 suppliers by total invoiced amount. Within those, we then looked at the top 10 most purchased items, along with the lowest and highest purchase price, and total spend.
As it turns out, our customer purchased 33,000 mayonnaise containers (among other items) from a single supplier with as much as a $5 price difference. Their total spend on mayo that year: $1,509,834. Had they purchased all the mayo at the lowest price, there would’ve been savings of around $410,000.

For this specific scenario, a knowledge graph could have helped as an enabler of data-driven negotiations: You have the data to negotiate smarter and ensure that you’re getting the best price and terms from your suppliers.
Finishing Condiments
Now, let’s break down how knowledge graphs can help you manage your mayo (and your costs) more efficiently:
- Negotiating better prices with suppliers — For example, identify suppliers that tend to raise prices after long-term contracts or fail to provide discounts when volumes increase.
- Lowering supply-chain risks — For example, visualize which suppliers are crucial to your operations, and see if there’s an over-reliance on any single one of them.
- Identifying high-centrality suppliers — For example, if a high-centrality supplier is high-risk or underperforming, use your knowledge graph to explore other options and diversify your supply base.
So, go ahead — spread the savings like mayo, and let knowledge graphs help you make every dollar count!
To learn more about knowledge graphs, check out The GraphRAG Manifesto: Adding Knowledge to GenAI and Knowledge Graphs and LLMs: Fine-Tuning vs. Retrieval-Augmented Generation.
Spreading the Savings Like Mayo: How Knowledge Graphs Can Transform Invoice Data and Lower Costs was originally published in Neo4j Developer Blog on Medium, where people are continuing the conversation by highlighting and responding to this story.
Share Article


Explore
Related Articles


Agentic Graph Analytics With External MCP Providers and Neo4j
Write Neo4j Graph Intelligence Results Back to OneLake in Microsoft Fabric