Graphs & The Internet of (Connected) Things

Written by Huston Hedinger, Founder & CEO, GraphAlchemist
The Internet of Things (IoT) is a term that’s been making the rounds. Let’s start at the very beginning. According to Technopedia, IoT refers to “a computing concept that describes a future where everyday physical objects will be connected to the Internet and be able to identify themselves to other devices.” Basically, everything connected. What this means is that all of our devices, from appliances to smart phones will be able to share information with one another and with us. The term was coined in 1999 by Kevin Ashton, however, the concept has been around since 1991. Other technologies such as QR codes, wireless systems and sensor technologies are all considered to be a part of the IoT. Furthermore, per Tim O’Reilly, we might even extend our understanding of IoT to the IoTH, the “Internet of Things and Humans” taking note that the ability for things and humans to cooperate gets more nuanced when the things become smarter.
Basically, everything connected.
In the context of IoT, we might call the last 10 years a shift toward IoST, or the “Internet of some things.” In the internet of some things, mobile, tablet, and computer – we’ve seen significant disruption. Smart phones alone have significantly changed the way that brands, enterprises, and even smaller businesses communicate with their stakeholders. Along with this disruption, new datasets have emerged with extremely painful data management demands. Everything connected, means that even the most simple IoT applications will demand extremely open, flexible, and fundamentally connected data models. Enter the graph database.
The rich ecosystem of products that IoT presents and the management of such an information system will be vital. Data models that explicitly recognize entities as well as the relationships between them make, the Internet of Things a perfect graph use case. Soon, our wearable devices will sync with our household appliances, cars and even homes to create the most personalized experience possible. In order to do this, we’ll have to understand the relationships that exist between each object at rawest level, which is in the way we store and transact with the data.
Neo4j makes it incredibly easy to model connectedness like device usage and device management, as well as location, in the same context as data the makes today’s applications truly rich. For instance, social connections on Facebook and Twitter, and a user’s relationships to certain other interests. To demonstrate this, we asked our friends at GraphAlchemist to build an IoT demo, illustrating the use of graphs with wearables and other connected devices. The data set and related documentation on how to load the data into Neo4j can be found here.
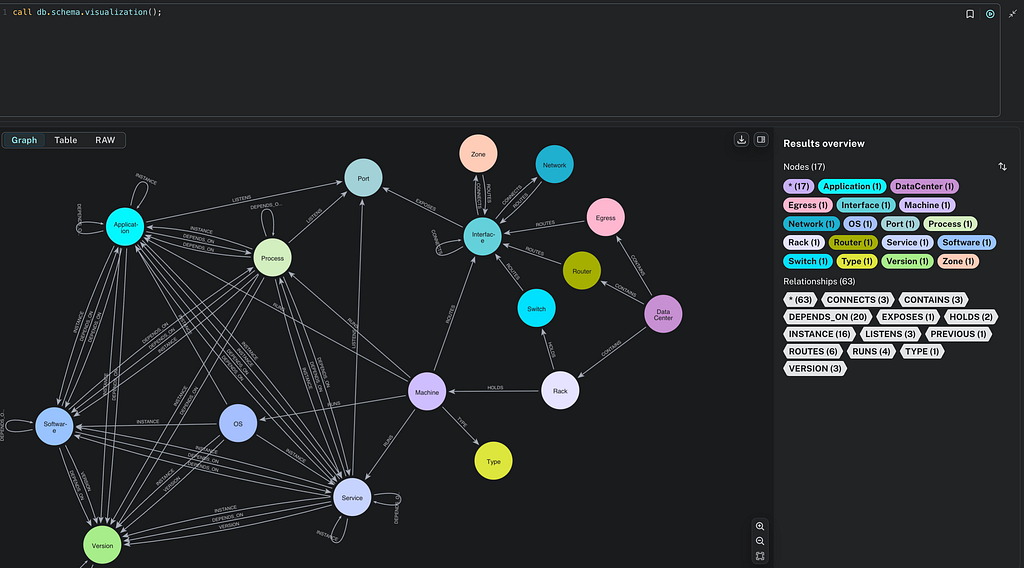
Here is the complete data model, generated using GraphJSON.io:

It is incredibly simple to query data using cypher in order to generate useful information for your application. Below we query friends and friends of friends who have attended an event:
MATCH (h:Human)-[:USES]->(:Machine)-[:LOCATED]->(l:Location)
WHERE l.name = "The Fray"
WITH h, l
MATCH (h)-[:FRIEND]-(f)-[:FRIEND]-(fof), (f)-[:USES]->(:Machine)-[:LOCATED]->(l)
WHERE (h)-[:FRIEND]-(fof)
RETURN DISTINCT h, f as friends, collect(fof) as friendsOfFriends
Which generates the following results in the neo4j browser:

For you developers, check more queries and our data generator out at our GraphofThings Repo.
For everyone else, stay tuned to our upcoming white paper on why Neo4j is the ideal choice for your Graph of Things use case!
Want to learn more about graph databases? Click below to get your free copy of O’Reilly’s Graph Databases ebook and discover how to use graph technologies for your application today.
