Model your data like your business for better insights

VP of Product Marketing, Neo4j
9 min read

Every business is a living network: Customers engage with products and services, employees collaborate across teams, suppliers connect to processes, and security systems protect it all. This web of patterns and relationships forms the lifeblood of your business and provides the fullest picture of its health.
But here’s the disconnect: While your organization naturally functions as a network, most enterprise data remains imprisoned in rigid rows and columns. The valuable patterns and relationships that drive business success are artificially severed, hidden across dozens or hundreds of isolated tables.
This is the fundamental limitation of the relational data model, and in today’s increasingly connected world, it becomes a critical roadblock because relational databases struggle to represent the natural connections that matter most to your business. When you need to reconstruct these relationships, you’re forced to build complex JOIN operations that tax your systems, drain computational resources, and require specialized expertise. The result? Critical business insights remain buried, patterns stay hidden, and your data tells only a fraction of its true story.
Missing relationships, missed opportunities
Consider customer data stored in a data warehouse. You might have purchase histories, support tickets, website visits, and marketing interactions all in one place. But the data warehouse still stores this information in separate tables with different structures. The meaningful relationships between these interactions—the patterns that reveal customer journeys, influence networks, and loyalty drivers—remain hidden in complex JOIN operations and query logic.
This relationship gap creates several persistent challenges:
- Hidden patterns: Even with centralized data, the connections between entities remain buried in code rather than explicit in your data model, making valuable patterns difficult to discover.
- Schema rigidity: Relational schemas require significant restructuring when new data types are added or when you want to ask new questions, creating maintenance overhead and limiting adaptability.
- Analysis barriers: Complex queries to reconstruct relationships require specialized expertise and computational resources, slowing insights and limiting who can access them.
- Context deficit for AI: With the emergence of AI, context and relationships between data points become increasingly critical for large language models (LLMs) and AI agents to effectively understand and work with your organization’s private data.
Graph technology fundamentally differs from traditional data integration and storage approaches because it represents and preserves the relationships that give your data meaning. It explicitly captures, stores, and prioritizes the connections between data points, allowing you to see your data as it truly exists in your business: as an interconnected network of relationships.
In a graph, purchase histories, support tickets, website visits, and marketing interactions don’t occupy isolated, hard-to-connect tables—the relationships between them structure the database itself, and querying those relationships becomes incredibly efficient. You can create a holistic view of your customer base without ever worrying about computational overhead.
This deeper, more comprehensive understanding of your business allows you to seize opportunities you might not have seen before—to transform and future-proof your business instead of simply running it. And as we enter the era of GenAI, it keeps you ahead of the curve because the rich relational context provided by graph technology is exactly what LLMs need to achieve enterprise-readiness.
The seven natural networks of your business
Every enterprise contains seven key domains of business activity—natural networks that reflect how your organization truly operates and creates value. These interconnected domains form the foundation of a comprehensive graph data architecture:
- Customer Graph: The complete network of customer interactions, preferences, and journeys. This reveals not just who your customers are but how they relate to each other and your offerings.
- Transaction Graph: The web of financial flows, payment patterns, and economic relationships. This exposes hidden patterns in how value moves through your ecosystem.
- Employee Graph: The ecosystem of skills, roles, and organizational knowledge. This maps actual collaboration patterns rather than just formal hierarchies.
- Product Graph: The interconnected landscape of offerings, components, and dependencies. This shows how products relate to each other and customer needs.
- Process Graph: The flow of operations, workflows, and business logic. This captures how work actually happens across organizational boundaries.
- Supplier Graph: The network of vendors, supply chains, and resource relationships. This reveals critical dependencies and opportunities for optimization.
- Network and Security Graph: The fabric of systems, access patterns, and security relationships. This connects your digital infrastructure to your business processes.
These seven graphs aren’t arbitrary divisions—they represent the fundamental domains that exist in every enterprise, reflecting the natural structure of how organizations operate. By modeling data according to these natural networks, businesses align their data landscape with their operational reality and can begin to understand the true, holistic picture of the business.
Australian small-business lender Prospa, for example, needed a better way to verify customer identities and relationships across multiple systems in order to make accurate lending decisions. Some prospective borrowers controlled multiple entities through trusts and shell companies, creating intricate webs of relationships that were nearly impossible to track in traditional databases. Prospa used a Customer Graph to connect and analyze all the relevant data, reducing verification work by 80 percent and creating a valuable new “business health” metric.
Enterprise Graph use cases that solve modern data challenges
Connected views lead to better decisions.
See the power of graph intelligence.
The connected data advantage: Real-world transformations
While each graph delivers immediate value in its domain, the true power emerges when you integrate them. Together, they create a comprehensive digital mirror of your organization, enabling:
- Deeper insights that cross traditional boundaries
- More accurate predictions based on complete context
- Faster responses to complex business questions
- Better decision-making with full awareness of implications
Integrated graphs that unify key data domains can be truly transformative, spurring technical breakthroughs and product innovations that shift the competitive landscape.
Connected data in manufacturing
Consider a manufacturer that integrates its Supplier Graph, Product Graph, and Process Graph. A single supplier disruption no longer hides in a black box. Managers can instantly see the cascading impact across products and production, proactively identify affected customers, and prioritize their response to minimize cost and frustration.
Boston Scientific’s recent experience with graph technology offers a more concrete example. The company needed to limit defects in a complex manufacturing process with thousands of interconnected systems. Analytics teams around the world simultaneously analyzed siloed data sources, spending hours waiting for queries to run and often duplicating their efforts. Then the company built a Neo4j AuraDB database to connect finished products, parts, and production issues, and query times dropped by 83 percent.
But what truly changed the game were the Neo4j Graph Data Science graph algorithms. By ranking nodes based on their proximity to failures, these algorithms helped Boston Scientific swiftly identify the root causes of plant defects, ensuring that they could deliver maximum value to their customers.
Connected data in retail
Retailers can transform customer experiences by combining their Product, Transaction, and Customer Graphs to spot buying pattern changes in real time. They can see how product availability affects customer behavior, predict which alternatives customers are likely to choose, and automatically adjust recommendations, inventory, and pricing. This means fewer lost sales and more satisfied customers.
Take global technology company Dell, which recently needed to redesign its pricing platform to handle complex product configurations and scenarios while maintaining performance. Dell chose Neo4j to power their pricing-as-a-service platform, which now processes up to 50 million events per day across different regions. Dell can perform just-in-time price calculations for customized products, implement flexible pricing strategies without hard-coding use cases, and achieve more predictable SLAs. This has allowed the company to decouple price authoring from calculation, giving business teams more flexibility in creating pricing campaigns and reducing time to market for new pricing strategies.
Connected data and human resources
When organizations link their Employee, Process, and Network and Security Graphs, they revolutionize employee experiences. Teams can identify bottlenecks before they impact productivity, spot security risks in real time, and streamline workflows automatically. This leads to more productive teams and stronger security. They can also transform recruitment, combining diverse data to fill roles and identify and redefine career paths.
DXC Technology, for example, built an integrated graph to power its Career Navigator platform, which helps train and retain its highly skilled workforce. The graph combines employee data (skills, assignments, career path, etc.) with data on business demand and customer accounts, so DXC employees can thrive professionally while meeting customer needs and helping the company grow. Career Navigator has reduced attrition by 40 percent, increased internal hiring by 12 percent, and developed career profiles for over 8,000 employees.
A deeper, more dynamic view of your organization
Stories like these capture the essence of connected data transformation—not just collecting data but fundamentally rethinking how your enterprise operates based on meaningful connections and insights. With interconnected graphs, you can ask and answer questions you’ve never even thought of before. You can pivot with agility as the market, technology, and customer expectations shift. You can transform your business when you truly understand the web of relationships that define it.
A connected, AI-ready future
Your business is a graph, and your data should be, too. The seven Enterprise Graphs provide a framework for aligning your data with business reality, uncovering hidden patterns and relationships, and driving transformation through connected data.
This approach becomes especially critical in the age of AI. When Klarna began implementing AI across the organization, its data was scattered across 1,200 SaaS tools, and the relationships within it were modeled indirectly—or not at all. As its CEO, Sebastian Siemiatkowski, noted, “Feeding an LLM the fractioned, fragmented, and dispersed world of corporate data will result in a very confused LLM.”
Working with Neo4j and graph technology, Klarna centralized its data and restructured it to explicitly capture connections between previously isolated entities and domains. Klarna achieved “serious productivity gains” that transformed its operational capabilities.
Klarna’s experience illustrates why graph data is inherently AI-ready. Modern AI and LLMs work best when they understand how entities relate to each other—when they have the rich context that graphs naturally provide. By maintaining your data in a graph structure, you’re not just solving today’s challenges—you’re preparing for tomorrow’s opportunities.
As AI reshapes business operations, the seven graphs will become the foundation of the AI-driven enterprise. Organizations with graph-based data foundations will have a natural advantage. Their data won’t need complex transformation or enrichment to be AI-ready—it already will be, and they will be poised to realize AI’s immense potential.
Read a complimentary Gartner® report on knowledge graphs for AI
Share Article


Explore
Related Articles

1 of 3: The difference between a graph, a knowledge graph, and a context graph

2 of 3: Why graphs, knowledge graphs, and context graphs matter to customers
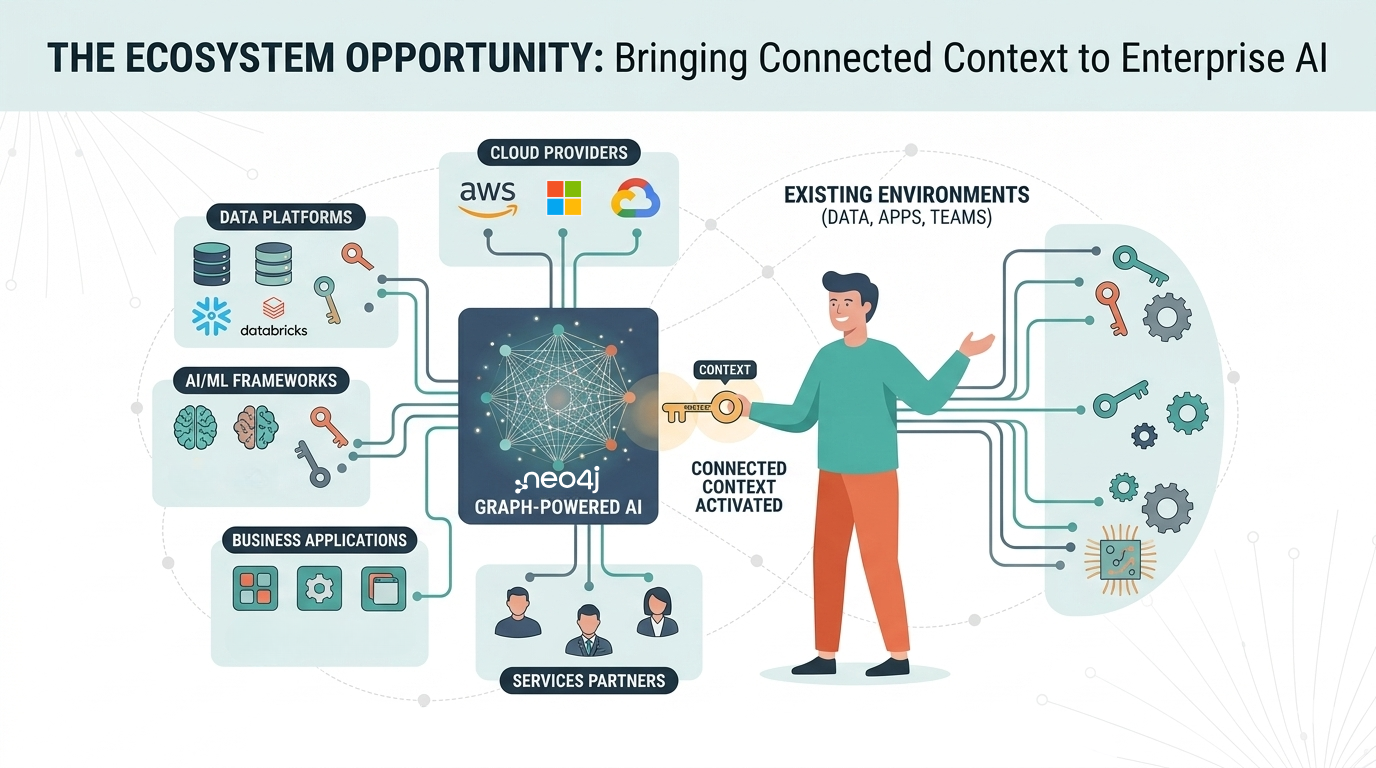
3 of 3: The graph ecosystem: Bringing connected context to enterprise AI
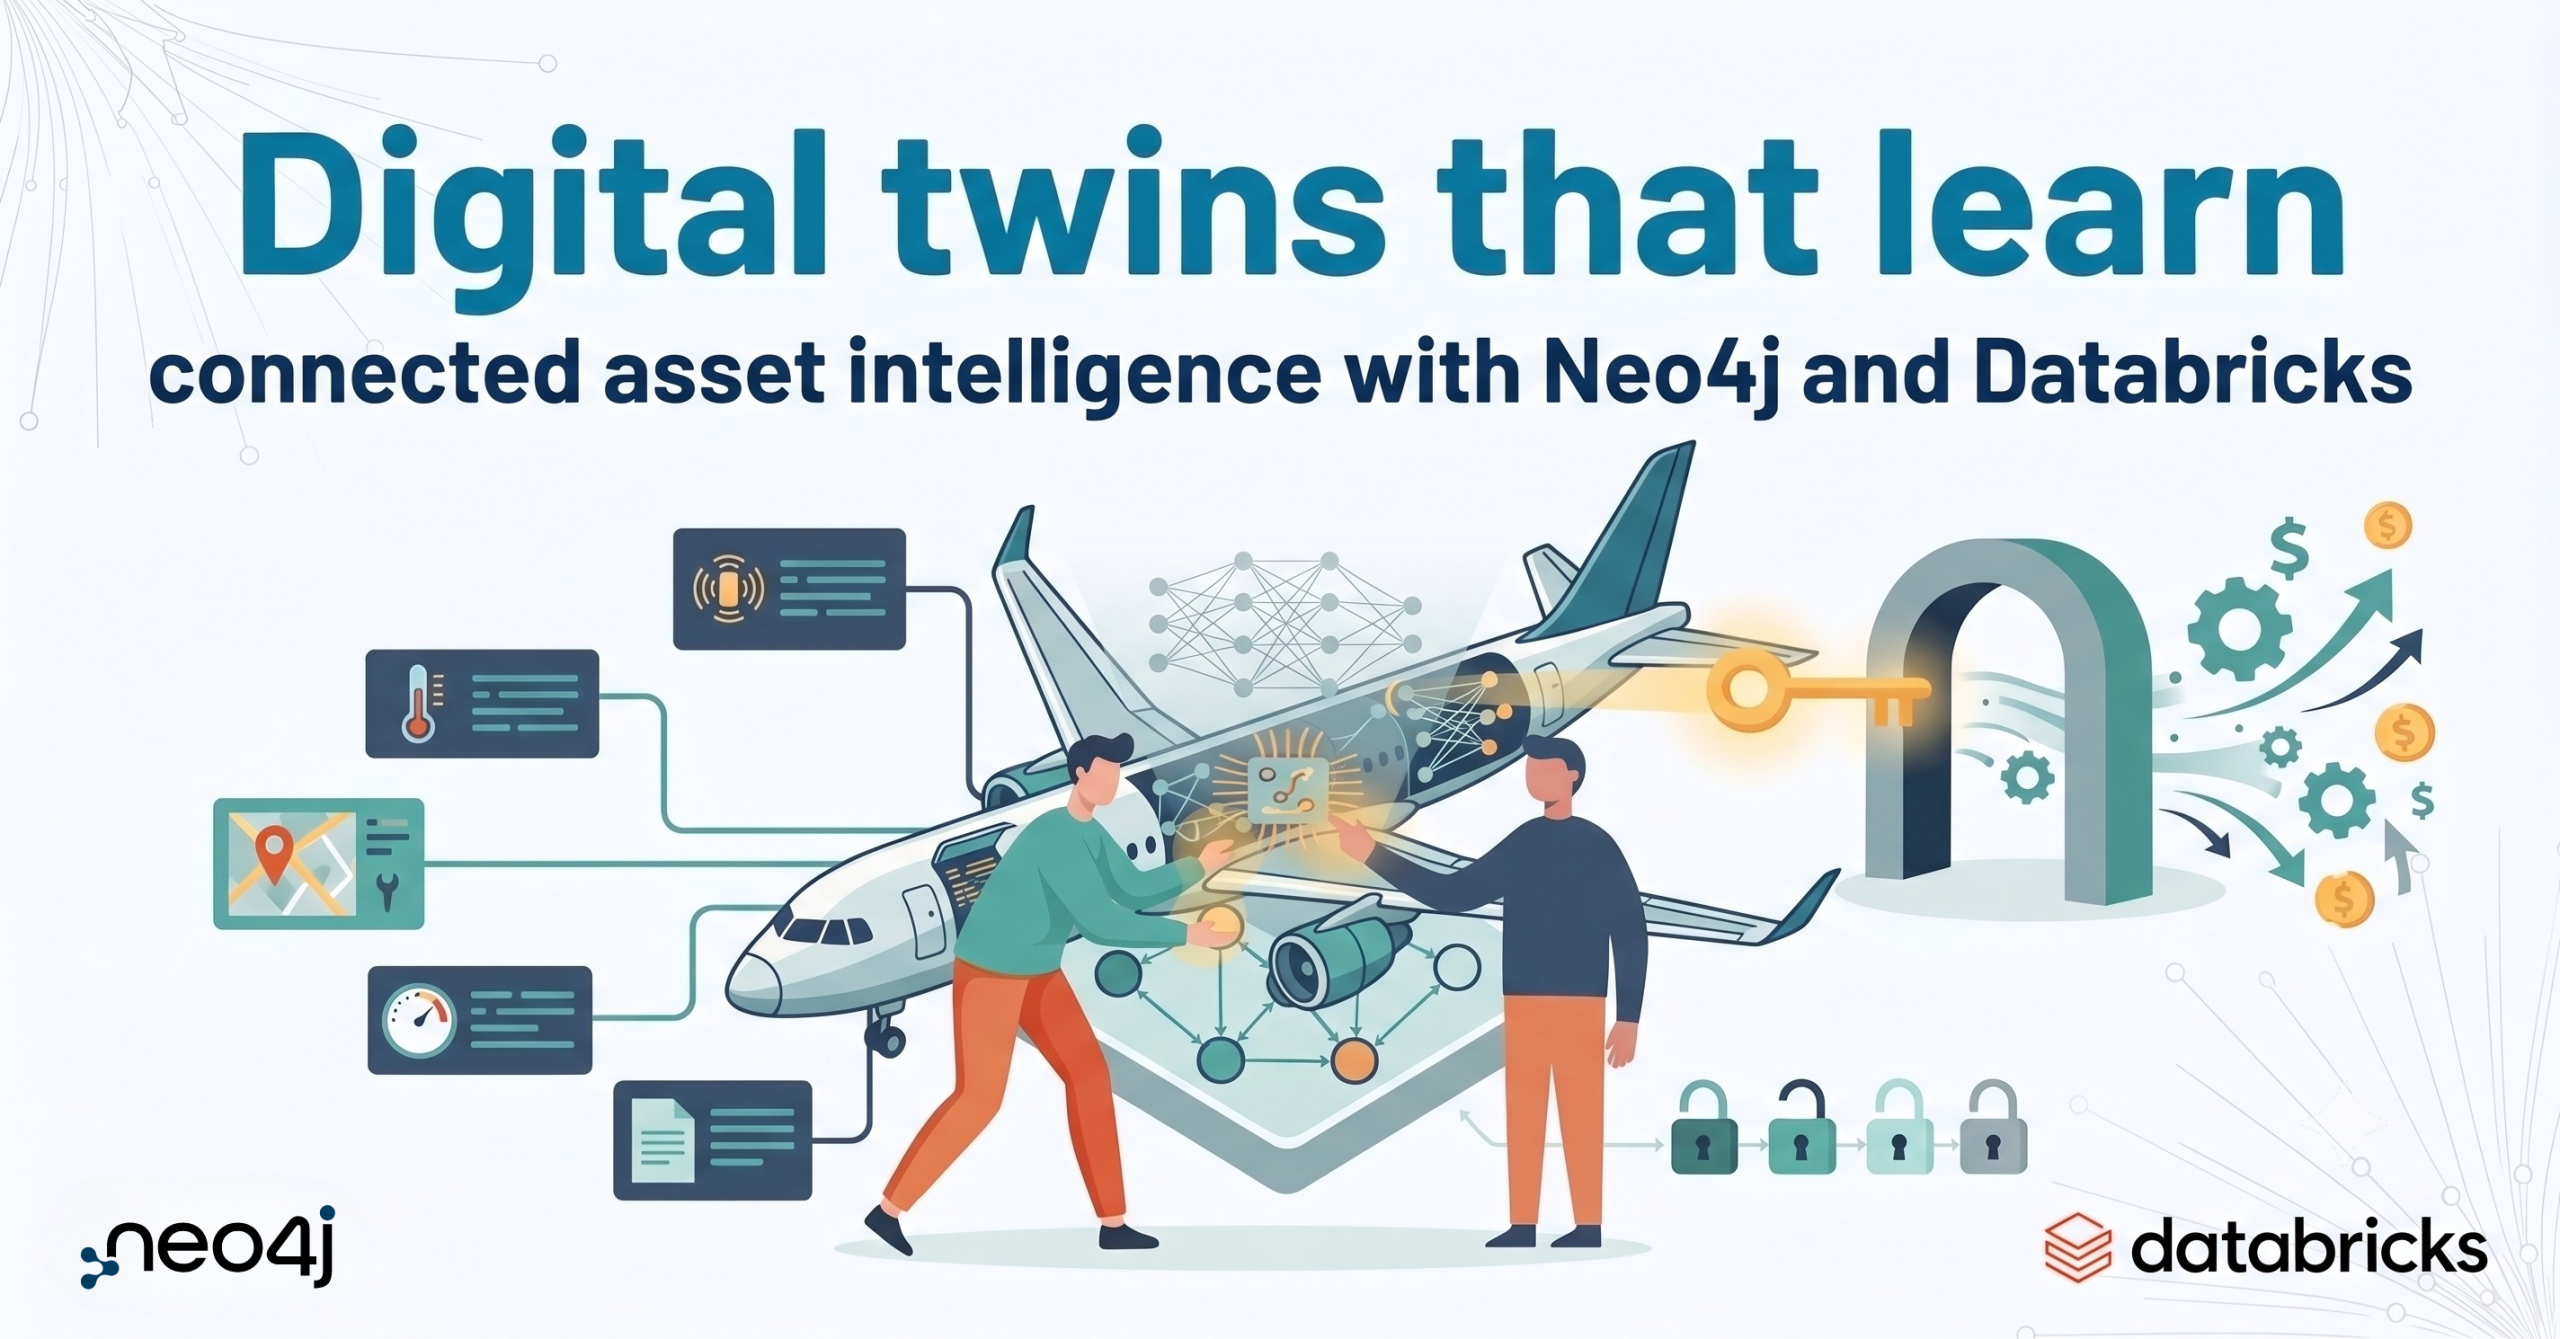
Digital twins that learn: connected asset intelligence with Neo4j and Databricks
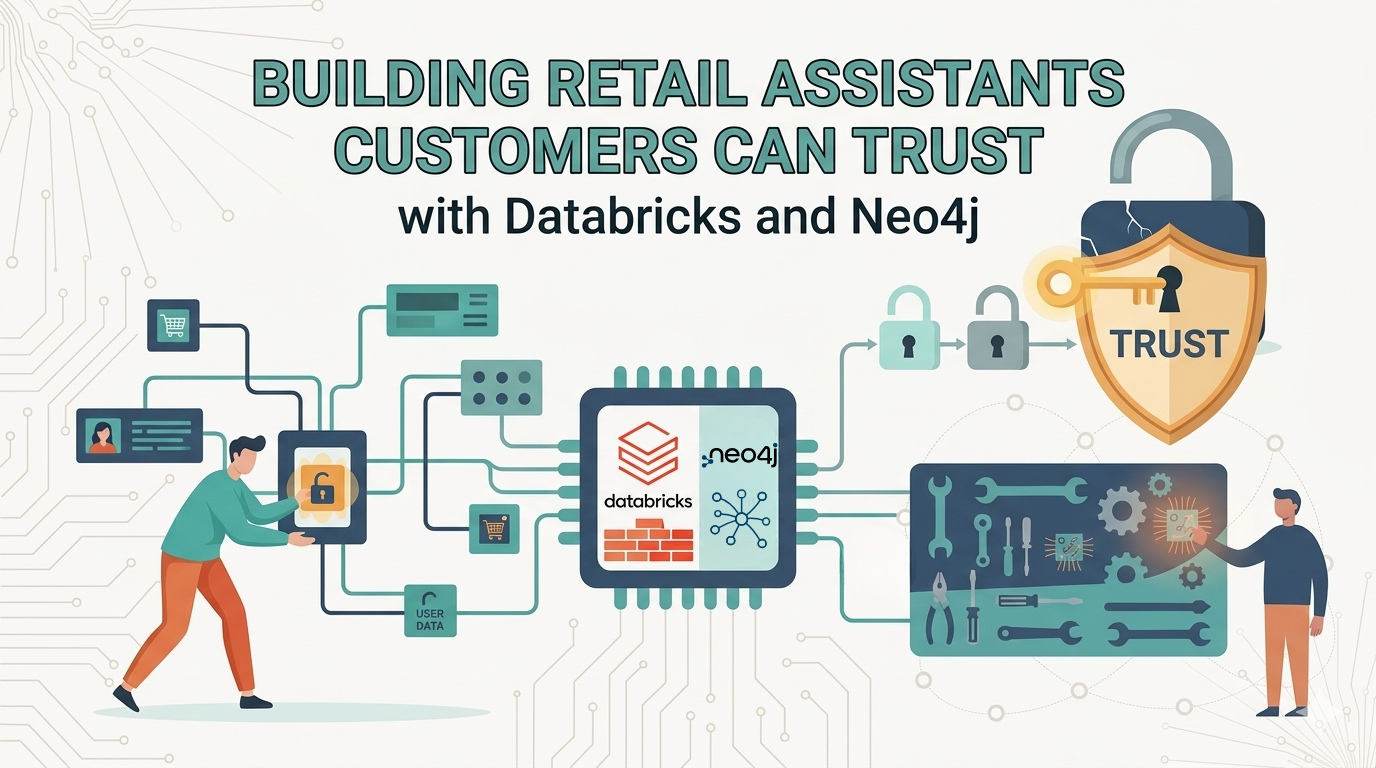
Building retail assistants customers can trust with Databricks and Neo4j