How Graph-Powered Supply Chain Improves Sustainability
7 min read

Managing a modern supply chain requires more than tracking parts and shipments in a linear fashion. It demands real-time visibility into how changes in one area impact the outcomes in another, which means moving beyond the limitations of traditional tools and siloed systems. Neo4j AuraDB, running on Amazon Web Services (AWS), makes it easier for businesses to understand relationships across suppliers, components, logistics, and regulations to unlock new insights and make faster, smarter decisions.
Capgemini, a global leader in consulting, technology services, and digital transformation, uses Neo4j AuraDB on AWS to help clients improve supply chain sustainability and meet environmental, social, and governance (ESG) objectives. By using AuraDB to build knowledge graphs that model everything from emissions data to alternative sourcing paths, companies can reduce carbon impact, improve reporting, and align operations with ESG goals, all without overhauling their existing systems.
ESG is Reshaping Supply Chain Strategy
ESG expectations span every industry. In manufacturing, companies must monitor energy use and waste throughout the production process. In retail and consumer packaged goods, sourcing practices and packaging are under close watch. In automotive and electronics, rare earth minerals, water usage, and emissions from global logistics all come into play. Even highly regulated sectors like healthcare and finance are being asked to show how their procurement and investment decisions support broader sustainability goals. On top of that, companies must juggle sustainability demands from all sides: regulatory mandates, customer expectations, and investor scrutiny, as well as pressure within the supply chain itself.
Governments and regulatory bodies are introducing rules that require detailed tracking and disclosure of supply chain emissions, material sourcing, and labor practices. These include frameworks like the EU’s Corporate Sustainability Reporting Directive (CSRD), the U.S. Securities and Exchange Commission’s proposed climate-related disclosures, and various national laws targeting plastic use, carbon footprints, and human rights compliance.
Customers and consumers are also demanding transparency. Buyers want to know where products come from, how they’re made, and whether ethical practices are being followed. In B2B settings, sustainability credentials increasingly factor into vendor selection and long-term partnerships.
Business stakeholders and investors are looking for ESG strategies that deliver measurable results without sacrificing financial performance. They want initiatives that align with financial goals, improve margins, and reduce risk exposure. Plus, they expect companies to meet sustainability requirements in cost-effective ways.
This means businesses must track and report ESG key performance indicators (KPIs) while still operating within real-world constraints. It’s not enough to reduce emissions if doing so increases costs unsustainably or delays delivery. Companies need to understand the trade-offs between speed, cost, and carbon – and make informed choices that reflect both operational needs and long-term commitments.
Why Traditional Systems Fall Short
Most legacy supply chain systems rely on relational databases, which are built for structured, tabular data with defined relationships. This works well for financial records or inventory counts, but quickly becomes limiting when you’re trying to model the complexity of a real-world supply chain.
Relational databases struggle with the deeply interconnected nature of suppliers, facilities, routes, products, and regulatory obligations. Understanding how one delayed shipment affects multiple production lines or tracing the carbon footprint of a component across its full life cycle requires countless JOIN operations. These queries aren’t only slow and compute-heavy but they also risk missing critical connections. Adding new data points, like emissions or compliance attributes, often requires schema changes and significant effort from technical teams.
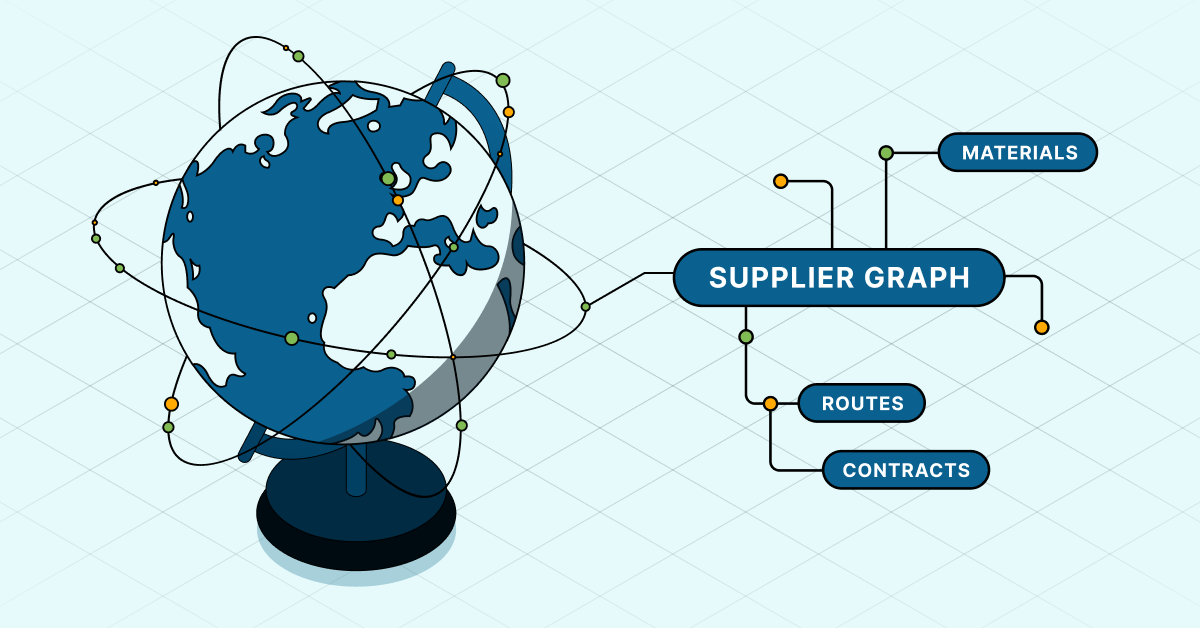
A graph database like Neo4j AuraDB is designed to handle connected data. It allows you to model your supply chain data as a living network of relationships, where insights emerge from how data points are linked rather than how rows are organized. This is where the concept of a supplier graph comes in. A supplier graph specifically looks at components that make up a supply chain. With a supplier graph in place, organizations can transform how they manage everything from inventory planning and route optimization to risk analysis and sustainability tracking.
Instead of working around the constraints of relational systems, a supplier graph gives you the flexibility and performance to explore your supply network holistically. You can trace disruptions, evaluate trade-offs, and surface insights that would be hidden in siloed systems.
End-to-End Supply Chain Visibility With a Knowledge Graph
Unify your data to build a resilient supply chain. Discover dependencies you didn’t know existed, spot risks, and make smarter decisions.
How Capgemini Uses Neo4j AuraDB
Capgemini works with organizations to enhance their existing systems by connecting ESG-relevant data using Neo4j AuraDB. The typical journey begins with a focused proof of concept, targeting bills of materials (BOMs) that have a direct impact on emissions, compliance, or sustainability reporting. By modeling these BOMs in AuraDB, Capgemini helps clients visualize how data connects across their supply chain and uncovers ESG insights that are difficult to extract from spreadsheets or relational databases.
This initial model serves as a foundation for scenario planning and impact analysis, allowing teams to ask critical questions like: What happens if a supplier fails? What alternative routes or vendors are available? How will each choice impact cost, speed, and carbon emissions?
Neo4j AuraDB supports this modeling with high-performance, flexible schemas and the ability to resolve inconsistencies across systems. Capgemini brings supply chain and ESG expertise to help customers model their operations accurately, prioritize high-impact areas, and surface the right trade-offs.
Running on AWS, Neo4j AuraDB integrates seamlessly with cloud-native tools and services, such as data lakes, analytics platforms, and machine learning pipelines. This makes it a natural fit for organizations that already rely on AWS for supply chain workloads, enabling them to connect graph-powered insights with the rest of their data infrastructure without adding complexity.
Unlocking Broader Value From the Supplier Graph
While many companies start their graph journey to meet sustainability goals, the supplier graph quickly becomes a strategic asset that supports other high-impact use cases across the business. Once the graph is in place, organizations can expand it beyond ESG-focused data to include more supplier, inventory, cost, tracking, and compliance data to increase visibility and open new use cases.
A supplier graph is a connected view of all the vendors, supply chains, and resource relationships that support your business. It connects the systems and signals that drive procurement, production, and logistics, enabling real-time analysis across operations. Once built, this connected view of your supply network can help with:
- Risk analysis – Identify single points of failure or hidden dependencies across suppliers and regions.
- Tariff mitigation and optimization – Model the effects of changing trade policies on sourcing and delivery routes.
- Real-time supply chain visibility – Visualize ripple effects of delays and evaluate alternate paths instantly.
- Inventory planning – Model shipping options, route combinations, or supplier configurations to improve procurement and logistics planning.
- Bottleneck detection and resolution – Identify critical nodes in your network to prioritize upgrades, develop fallback plans, or reroute activity to reduce downtime and maintain supply continuity.
The supplier graph isn’t just a one-time investment. It becomes a dynamic, evolving model that grows with your supply chain and helps your organization adapt in real time.
A Smarter Foundation for Sustainable Supply Chains
Neo4j AuraDB, deployed on AWS and guided by Capgemini’s expertise, gives organizations a new way to manage supply chain complexity and meet ESG commitments. The supplier graph at the core provides clear, connected oversight of supply chain operations, helping teams spot risks, surface opportunities, and make confident decisions based on a complete understanding of how everything fits together.
Getting started is simple. A focused proof of concept using a small set of data can show immediate value. From there, you can grow your supplier graph at your own pace, building resilience, efficiency, and sustainability into every part of your supply chain.


