Find impactful graph-powered insights in Databricks

Sr. Manager, Technical Product Marketing, Neo4j
3 min read

You’ve got plenty of data. Clean tables, well-defined schemas, and scalable compute in Databricks. But it can still feel like something is missing.
What’s hard isn’t the data. It’s seeing how things actually connect. The patterns that drive real outcomes like better recommendations, catching coordinated fraud, or understanding how customers influence each other don’t always show up clearly in rows and columns.
With Neo4j Aura Graph Analytics, you can run graph algorithms on top of the data you already have, so patterns around recommendations, fraud, or customer behavior become much easier to surface and act on. You can scale up to billions of nodes and relationships, all without standing up new infrastructure or rebuilding your pipelines.
What business problems work well with graph analytics?
Similarity algorithms answer the question: what is alike? Retail, financial services, and media companies use them to power product recommendations, identify duplicate customers, and find users with similar behavior for targeting.
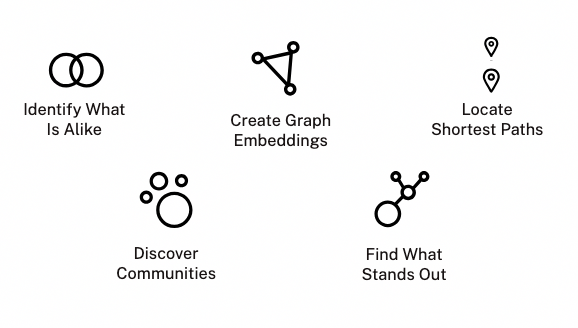
Pathfinding algorithms find the most efficient path between two points. Supply chain and logistics teams use them to optimize delivery routes, reduce shipping times, and identify the lowest-cost path to production or distribution.
Community detection algorithms uncover natural groupings based on how entities are connected. Teams use them to segment customers, including by shared behaviors like purchasing patterns, and to detect fraud rings that operate as tightly connected groups.
Centrality algorithms highlight what stands out in a network. Manufacturing, financial services, and supply chain teams use them to identify bottlenecks, surface critical suppliers, and find the customers or accounts that have the most influence on outcomes.
Embedding algorithms turn graph data into numeric features that machine learning models can use. Data science and ML teams use them to improve tasks like recommendations, predictions, and anomaly detection by capturing how entities are connected.
How does it work?
You don’t need to move your data or set up a graph database to run these powerful graph algorithms.
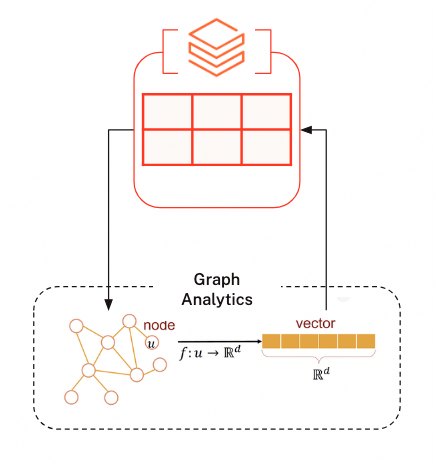
Take a look at the graphic on the right. The process starts with Python dataframes. In most cases, you’ll create one dataframe for nodes (the things you care about, such as customers or products) and another for relationships (how those things are connected, such as purchases or interactions).
Next, start a serverless session, which is represented by the dotted frame. These are ephemeral, and you are only charged while they are running. Next, create a graph projection in that session. A graph projection is an in-memory graph, meaning a version of your data stored in memory and structured as a network so algorithms can run efficiently on it.
Once the graph is projected, you run an algorithm. In your diagram on the right, you generated embeddings, which are numeric representations of each node that capture how similar they are based on their connections.
The results come back in Databricks as dataframes. From there, you can use them in machine learning workflows or write them back to Delta tables in Databricks, so they’re available for reporting, analytics, or operational use.
Now that you’ve seen how to take your Databricks data, model it as a graph, and run algorithms on it, you can start applying this to your own problems. Next up, apply these lessons to your own data in our step-by-step tutorial for Aura Graph Analytics in Databricks.
See Graph Anlytics in Action
Learn how to identify bottlenecks and reroute flights with Aura Graph Analytics and Databricks!
Share Article


Explore
Related Articles
The persistence tax: Why it’s time to let your graph analytics sleep