Improving First-Party Bank Fraud Detection with Graph Databases
6 min read

First-party bank fraud involves fraudsters who apply for credit cards, loans, overdrafts and unsecured banking credit lines, with no intention of paying them back. It is a serious problem for banking institutions.
U.S. banks lose tens of billions of dollars every year to first-party fraud, which is estimated to account for as much as one-quarter or more of total consumer credit chargeoffs in the United States. It is further estimated that 10%-20% of unsecured bad debt at leading U.S. and European banks is misclassified and is actually first-party fraud.
The surprising magnitude of these losses is likely the result of two factors. The first is that first-party fraud is very difficult to detect. Fraudsters behave very similarly to legitimate customers, until the moment they “bust out,” cleaning out all their accounts and promptly disappearing.
A second factor – which will also be explored later in greater detail – is the exponential nature of the relationship between the number of participants in the fraud ring and the overall dollar value controlled by the operation. This connected explosion is a feature often exploited by organized crime.
However while this characteristic makes these schemes potentially very damaging, it also renders them particularly susceptible to graph-based methods of fraud detection.
In this series on fraud detection, we’re going to take a closer look at how graph databases help detect and mitigate three types of fraud:
- First-party bank fraud
- Insurance fraud
- E-commerce fraud
Last week, we took a broader look at how graph databases detect fraud in multiple scenarios. This week, we’ll dive into the specifics of first-party bank fraud.
A Typical First-Party Bank Fraud Scenario
While the exact details behind each first-party fraud collusion vary from operation to operation, the pattern below illustrates how fraud rings commonly operate:
- A group of two or more people organize into a fraud ring
- The ring shares a subset of legitimate contact information, for example phone numbers and addresses, combining them to create a number of synthetic identities
- Ring members open accounts using these synthetic identities
- New accounts are added to the original ones: unsecured credit lines, credit cards, overdraft protection, personal loans, etc.
- The accounts are used normally, with regular purchases and timely payments
- Banks increase the revolving credit lines over time, due to the observed responsible credit behavior
- One day the ring “busts out,” coordinating their activity, maxing out all of their credit lines and disappearing
- Sometimes fraudsters will go a step further and bring all of their balances to zero using fake checks immediately before the prior step, doubling the damage
- Collections processes ensue, but agents are never able to reach the fraudster
- The uncollectible debt is written off
In order to illustrate this scenario, let’s take a (small) ring of 2 people colluding to create synthetic identities:
1. Tony Bee lives at 123 NW 1st Street, San Francisco, CA 94101 (his real address) and gets a prepaid phone at 415-123-4567
2. Paul Favre lives at 987 SW 1st Ave, San Francisco, CA 94102 (his real address) and gets a prepaid phone at 415-987-6543
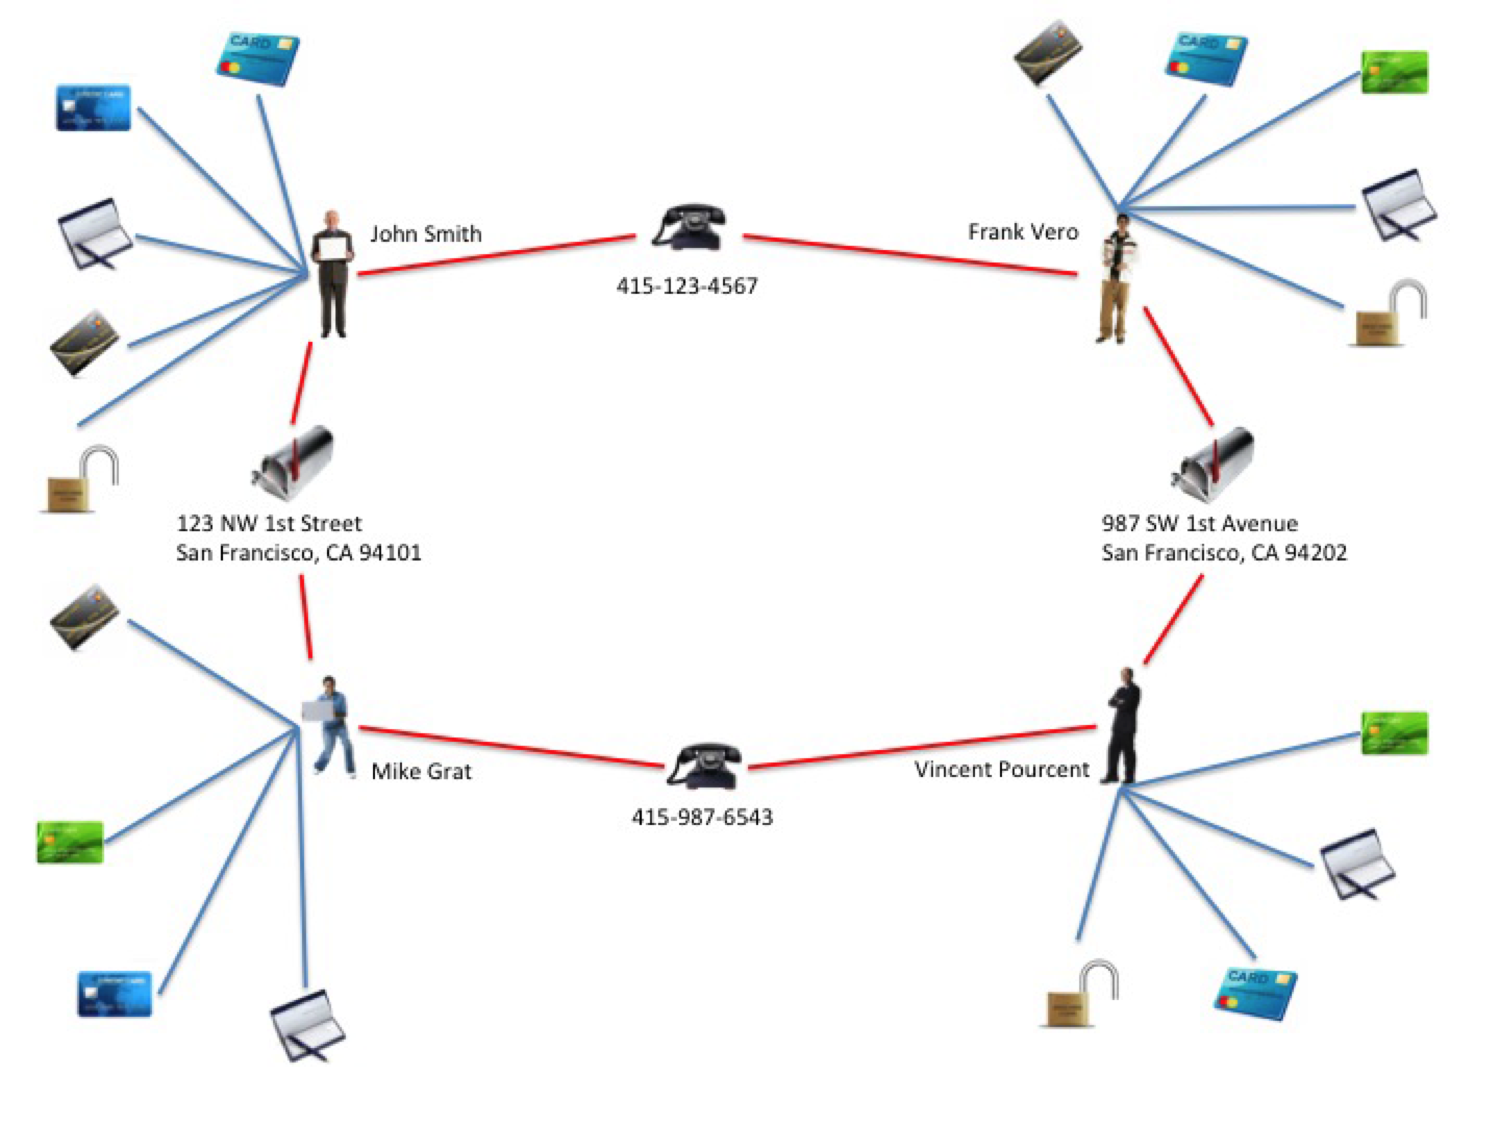
Sharing only a phone number and an address (2 pieces of data), they can combine these to create four synthetic identities with fake names as shown below.
2 people sharing 2 pieces of data and creating 4 synthetic identities
Above you’ll see the resulting fraud ring, with 4-5 accounts for each synthetic identity, totaling 18 total accounts. Assuming an average of $4K in credit exposure per account, the bank’s loss could be as high as $72K.
As in the process outlined above, the phone numbers are dropped after the bust-out, and when the investigators come to these addresses, both Tony Bee and Paul Fabre (the fraudsters, who really live there) deny ever knowing John Smith, Frank Vero, Mike Grat or Vincent Pourcent.
Detecting the Crime
Catching fraud rings and stopping them before they cause damage is a challenge.
One reason for the challenge is that traditional methods of fraud detection are either not geared to look for the right thing: in this case, the rings created by shared identifiers.
Standard instruments – such as a deviation from normal purchasing patterns – use discrete data and not connections. Discrete methods are useful for catching fraudsters acting alone, but they fall short in their ability to detect rings.
Furthermore, many such methods are prone to false positives, which creates undesired side effects in customer satisfaction and lost revenue opportunity.
It starts with simple discrete methods (at the left), and progresses to more elaborate “big picture” types of analysis. The rightmost layer – entity link analysis – leverages connected data in order to detect organized fraud.
As we’ll show in the following sections, collusions of the type described above can be very easily uncovered – with a very high probability of accuracy – using a graph database to carry out entity link analysis at key points in the customer lifecycle.
The Power of Entity Link Analysis
We discussed earlier how fraudsters use multiple identities to increase the overall size of their criminal takings. It’s not just the dollar value of the impact that increases as the fraud ring grows, it’s also the computational complexity required to catch the ring.
The full magnitude of this problem becomes clear as one considers the combinatorial explosion that occurs as the ring grows. In the diagram below, you can see how adding a third person to the ring expands the number of synthetic identities to nine.
Above: 3 people each sharing 2 valid identifiers results in 9 interconnected synthetic identities. A ring of n people (n≥2) sharing m elements of data (such as name, date of birth, phone number, address, SSN, etc.) can create up to nm synthetic identities, where each synthetic identity (represented as a node) is linked to m × (n-1) other nodes, for a total of (nm × m × (n-1)) / 2 relationships.
Likewise, four people can control 16 identities, and so on. The potential loss in a ten-person fraud bust-out is $1.5M, assuming 100 false identities and 3 financial instruments per identity, each with a $5K credit limit.
How Graph Databases Can Help
Uncovering rings with traditional relational database technologies requires modeling the graph above as a set of tables and columns, and then carrying out a series of complex JOINs and self-JOINs.
Such queries are very complex to build and expensive to run. Scaling them in a way that supports real-time access poses significant technical challenges, with performance becoming exponentially worse not only as the size of the ring increases, but as the total dataset grows.
Graph databases have emerged as an ideal tool for overcoming these hurdles. Languages like Cypher provide a simple semantic for detecting rings in the graph, navigating connections in memory and in real time.
The graph data model below represents how the data actually looks to the graph database, and illustrates how your fraud detection team can find rings by simply walking the graph.
Augmenting one’s existing fraud detection infrastructure to support ring detection can be done by running appropriate entity link analysis queries using a graph database, and running checks during key stages in the customer and account lifecycle, such as:
- At the time the account is created,
- During an investigation,
- Ds soon as a credit balance threshold is hit, or
- When a check is bounced.
Fortunately, real-time graph traversals tied to the right kinds of events can help banks and financial institutions like yours identify probable fraud rings during – or even before – the bust-out occurs.
Want to learn more about how graph databases improve fraud detection? Download this white paper, Fraud Detection: Discovering Connections with Graph Databases.
Catch up with the rest of the fraud detection series:


