Governing multichannel services with graphs at Veneto Banca


8 min read
Editor’s Note: This presentation was given by Nicola Camillo and Alberto De Lazzari of Veneto Banca at GraphConnect Europe in April 2016. Here’s a quick review of what they covered:
What we’re going to be talking about today is how we developed a graph-based platform to govern our IT infrastructure and architecture.
Nicola: My name is Nicola Kamila and I’m an IT manager at Veneto Banca, a prominent bank in Italy. I’m here with my colleague Alberto De Lazzari to talk about the graph-based tool we use to govern our IT infrastructure and architecture.
Thinking about, deploying, and implementing this tool from scratch was a challenging opportunity. We were given the direction from our COO to completely modify the information technology system of each bank we wanted to adopt, and we’ve spent the last couple of years working on this huge project. We wanted to adopt the microservices pattern exposed by Martin Fowler, and we built a multichannel architecture as a platform to enable the new core applications of the bank to run in production.
In this new architecture, we rely on the application in the multi-channel project to span into both self and supervised channels. The supervised channels include the tools used by bank branches — such as the workstation and contact center — and the self channel application includes mobile and internet banking.
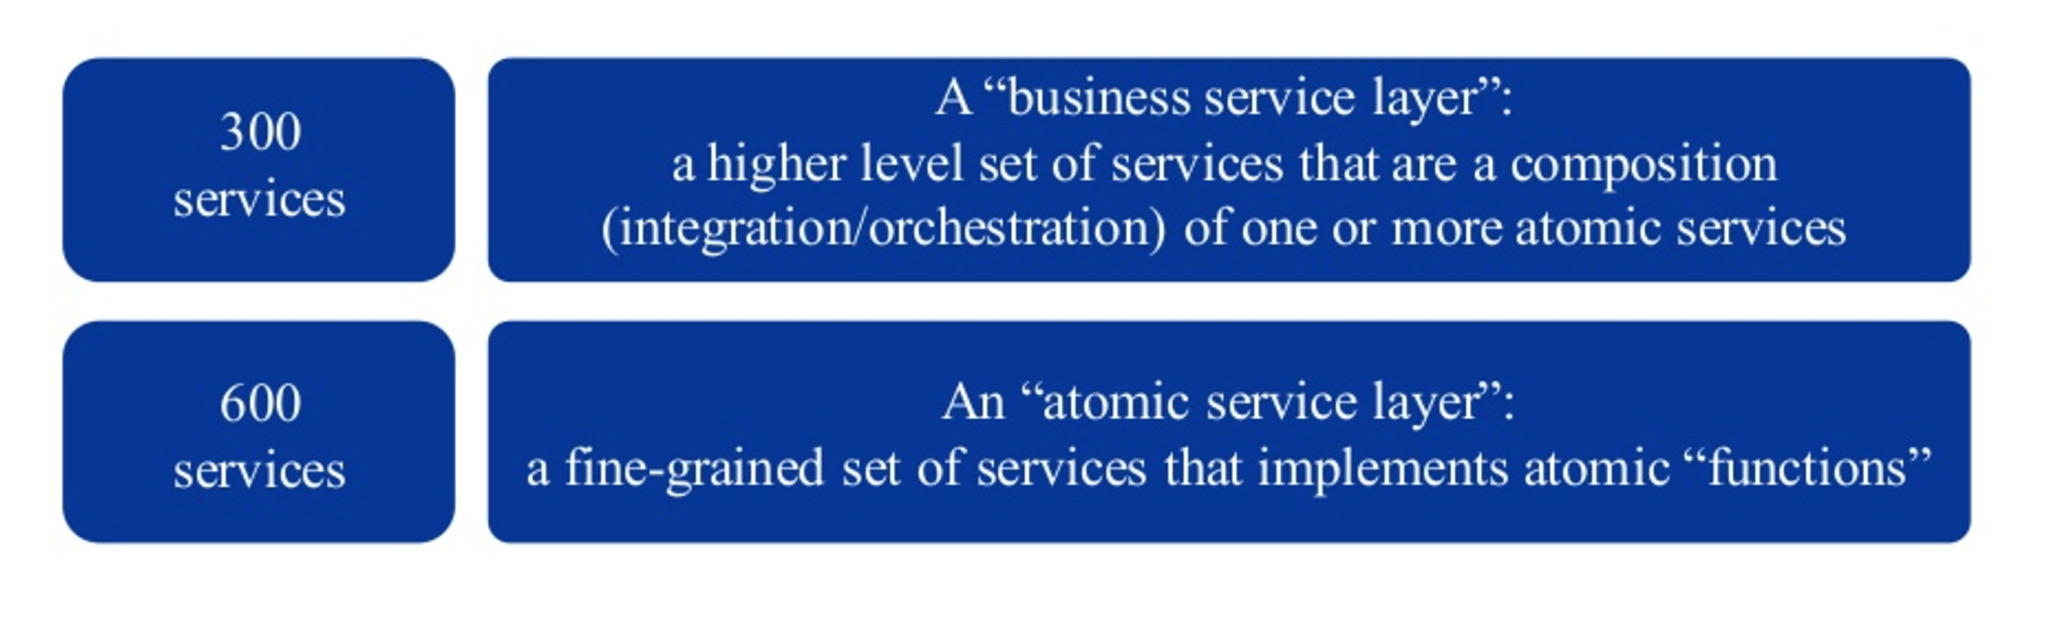
At the end of our work, we discovered that our service landscape included almost 300 business services composed of a “business service layer,” and that the “atomic service layer” was composed of 600 atomic services, each of which exposed a particular function or functionality:
Challenges: Governance, impact analysis and automation
The project faced several challenges before going into production, the first of which included documentation and governance. We couldn’t answer the question, “Can you describe your multichannel architecture in terms of layer services?” In fact, we had to go to our seats, pull up the code, and then place our data into Excel spreadsheets to answer this question.
Impact analysis was another challenge. We needed to answer the question, “What challenges will our platform face if one of our services or service providers becomes unreachable?” And finally, we wanted to develop automatic feature activation so that we could change service behavior on-the-fly without having to deploy it multiple times.
A focus on relationships
When we first started holding our brainstorming meetings, we didn’t know anything about graph databases or Neo4j, but we knew we needed a repository other than Excel to collect information. We also needed a tool that could focus on relationships, because that’s where the meaningful IT system information was held. And finally, we wanted to be able to easily draw our data model (or for it to be “whiteboard friendly”).
Building the database: Trial and error
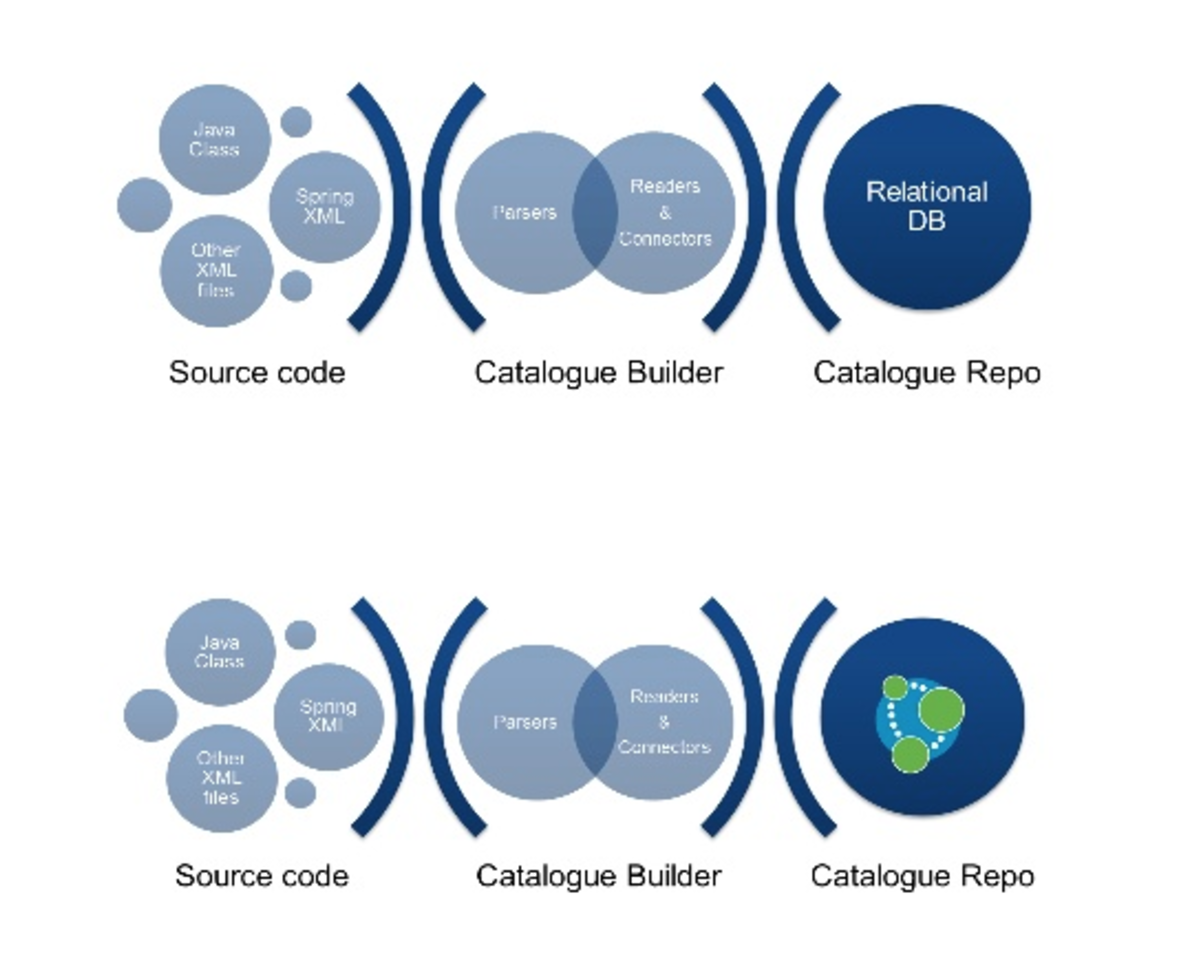
Our first approach was very primitive: we collected information in an Excel file and developed the below process after the deployment of the application into production:
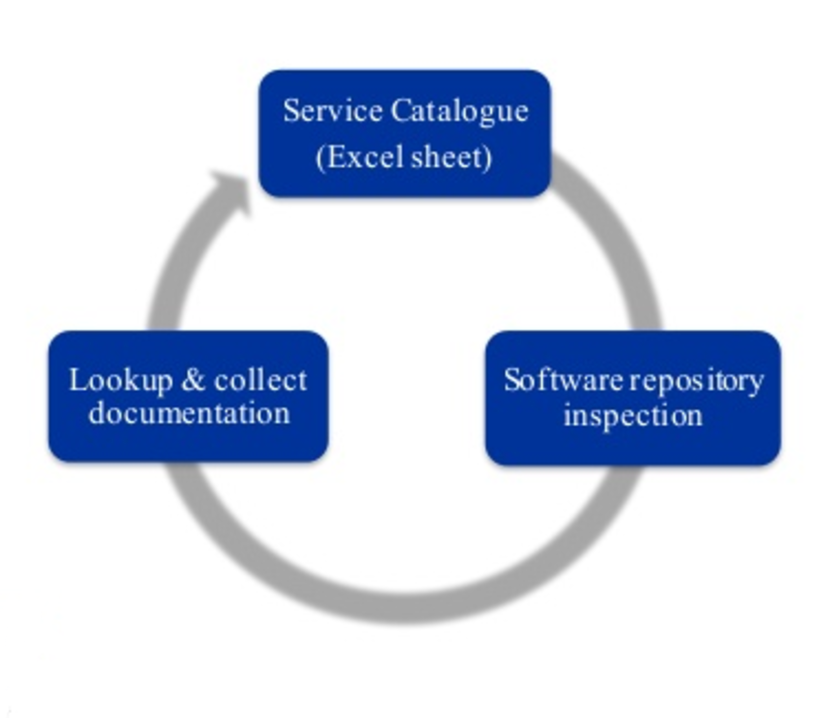
There were several problems with this process: it was time consuming, very prone to human error, and the information was not up to date with the software changes. We decided to leave this model behind and tried the following two approaches:
Our first approach relied on a Relational Database, because our team already had extensive experience with this type of tool. The database stored the information of the service capital, and we built all of the the parcels and source code readers — along with the adaptors for building the data model — according to the data scheme of the relational database.
But we quickly found out that relational databases were not useful for tracking or managing relationships. We weren’t able to write the SQL queries needed to extract meaningful information from our system, and had a difficult time explaining the necessary complicated queries to our IT team — and especially our business teams, which needed to help us design applications.
Finally, thanks to Lorenzo Speranzoni, we discovered the power of graph databases — and Neo4j in particular. This led us to the second approach (above), and we were impressed that Neo4j treated relationships as first-class citizens. Alberto and I were able to draw a graph without pain; we could easily and repeatedly make changes to the data model without having to change the adapters of the parcel of our source code.
Building the service catalogue
We next turned our attention to building our service catalogue, the core component of a magical tool that could answer all of our questions by simply pressing a button. We wanted this tool to help us automate some steps in the process, and by placing it in the center of our system, we were able to use it for impact analysis, out configuration of services, switching features on or off, and for stakeholder reporting.
Alberto: There are several valuable features Neo4j provided to us in this process. We think that graphs are the most natural way to represent entities and nodes that have connections. Neo4j also provided us with the ability to easily add new types of nodes and relationships, which allowed our data model to continually evolve. The fact that the whiteboard model directly mirrors the physical model is another key feature of Neo4j; whatever we draw on our paper is what we get in our database, which makes it incredibly easy to explain the data model to colleagues with no technical background. It’s a powerful tool for connected data, is incredibly easy to integrate, is expressive, and provides a powerful query language — Cypher — that can be written on top of our JVM.
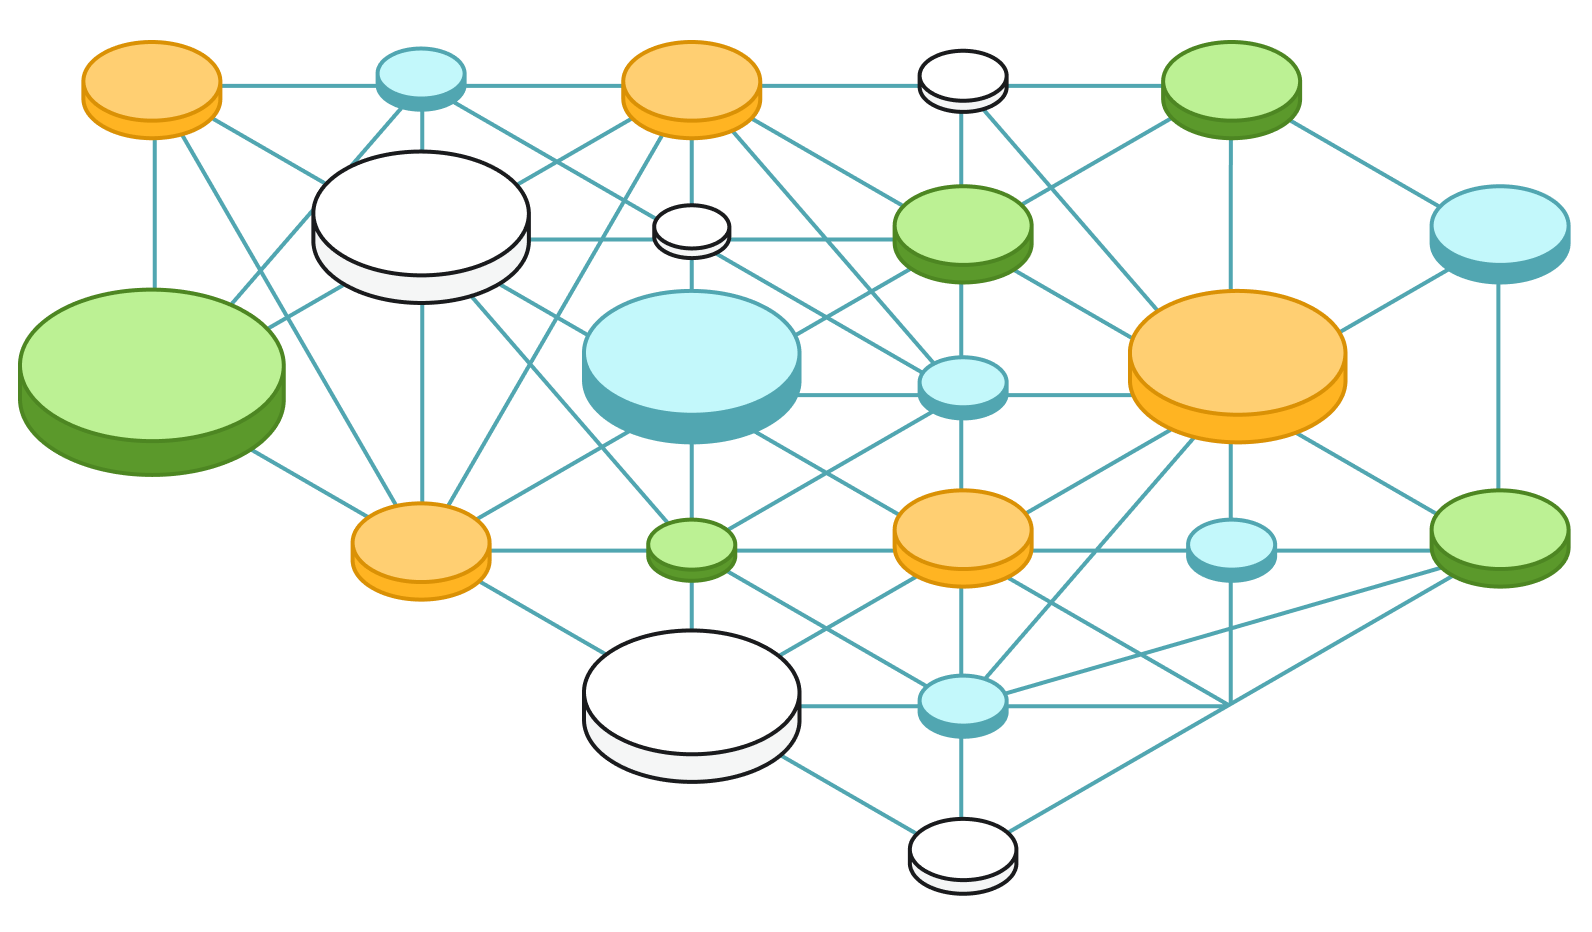
As Nicola mentioned, we started out by drawing our data model on a piece of paper starting with our Data Provider (from the bottom of the graph):
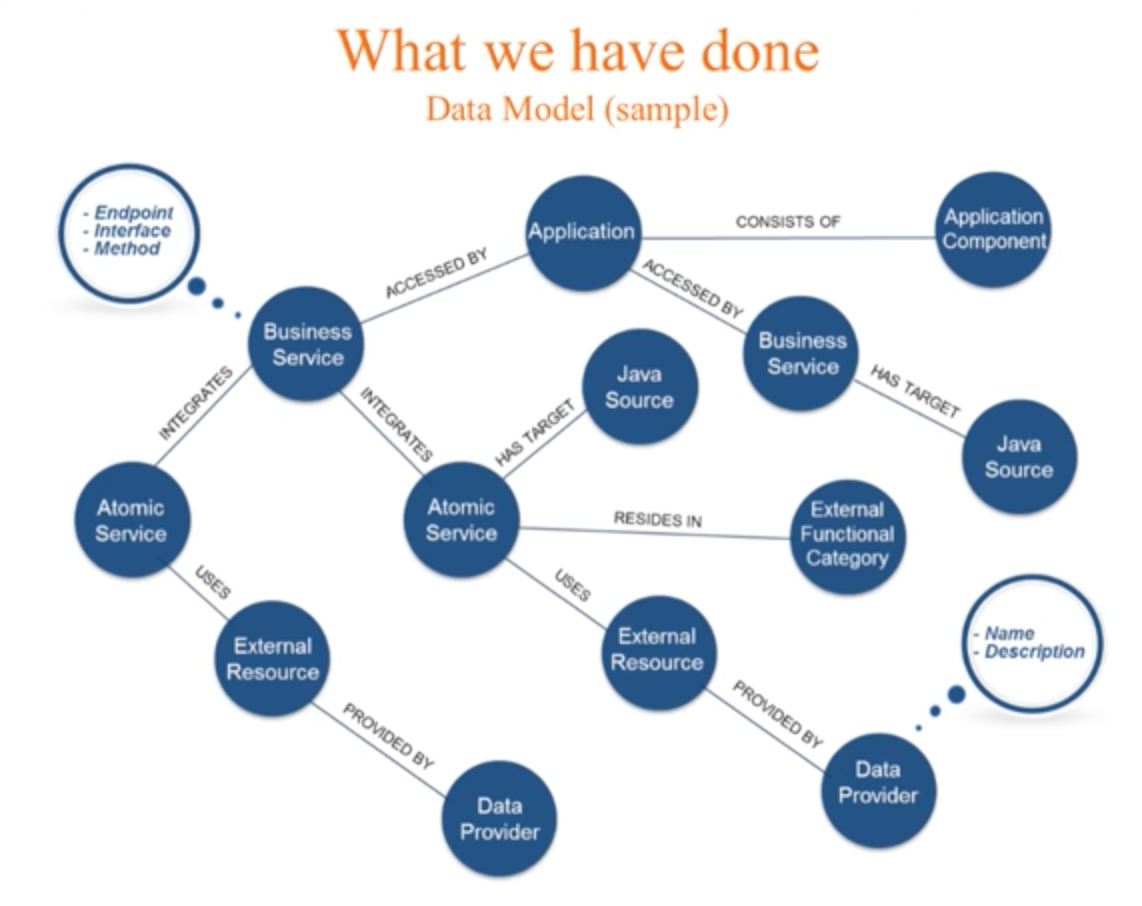
Our atomic services depend on many data providers for a variety of services that we refer to as external resources. This includes web services and database queries. Our atomic services are the building blocks for our business services, which are in turn the services consumed by our applications. The process included successive refinement of our data model, which we developed layer by layer and was made easy by Neo4j. And ultimately, we chose Spring Data Neo4j to map our entity classes. Because we had a lot of experience with Spring, this choice allowed us to more quickly move to production.
Executing the service catalogue
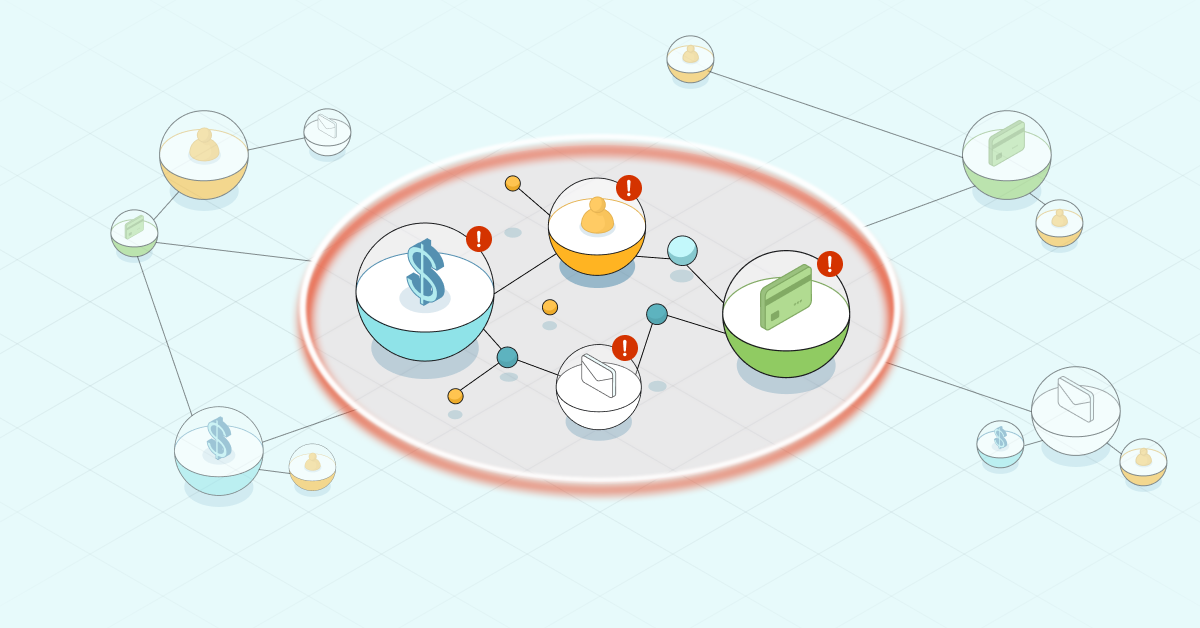
Below are two examples of what we have done with our service catalogue with both software changes and impact analysis:

The first is software changes, shown on the right side of the slide. We have the change sets (software changes) as the starting point, followed by a bottom-up analysis that allows us to collect all the impacted components. In general, these include applications or business services.
Next we extract all the test plans, test suite, and test cases that we want to run, and eventually we can send the impacted components to the change advisory board. One of the key feature here is that we don’t need to run all the test suites or test cases because we can extract a subset of those plans due to the link between the impacted components and test cases.
We have a similar business continuity example with impact analysis, which is shown on the left side of the slide above. In this case we have an external provider or service that isn’t working, and we want to know what services are impacted and to alert application users.
Conclusion
We require our service catalogue to be inside an IT governance process because it’s extremely useful for ensuring our application map is complete and up-to-date. It also allows us to take a snapshot of our service catalogue on demand, or to attach it to the continuous delivery process.
Once you have your data model, you can extend the graph with additional heterogeneous information and areas of interest, such as the infrastructure topology, and we can do a business continuity impact analysis. Implementing an IT governance tool based on Neo4j has been the right choice for us because it allows us to manage relationships extremely well, is whiteboard friendly, easy to understand, provides a powerful query language, and — last but not least — we like it!
Click below to download your free copy of Learning Neo4j and get up to speed with the world’s leading graph database.
Share Article


Explore
Related Articles

APRA just put the financial sector on notice over AI. Government agencies need to take notes.

Hey LLM, you’re using OPTIONAL MATCH wrong. Here’s the Cypher that actually works.