Pushing the evolution of software analytics with graph technology

Senior Consultant, buschmais GbR
7 min read

Editor’s Note: This presentation was given by Dirk Mahler at GraphConnect Europe in April 2016. Here’s a quick review of what he covered:
–
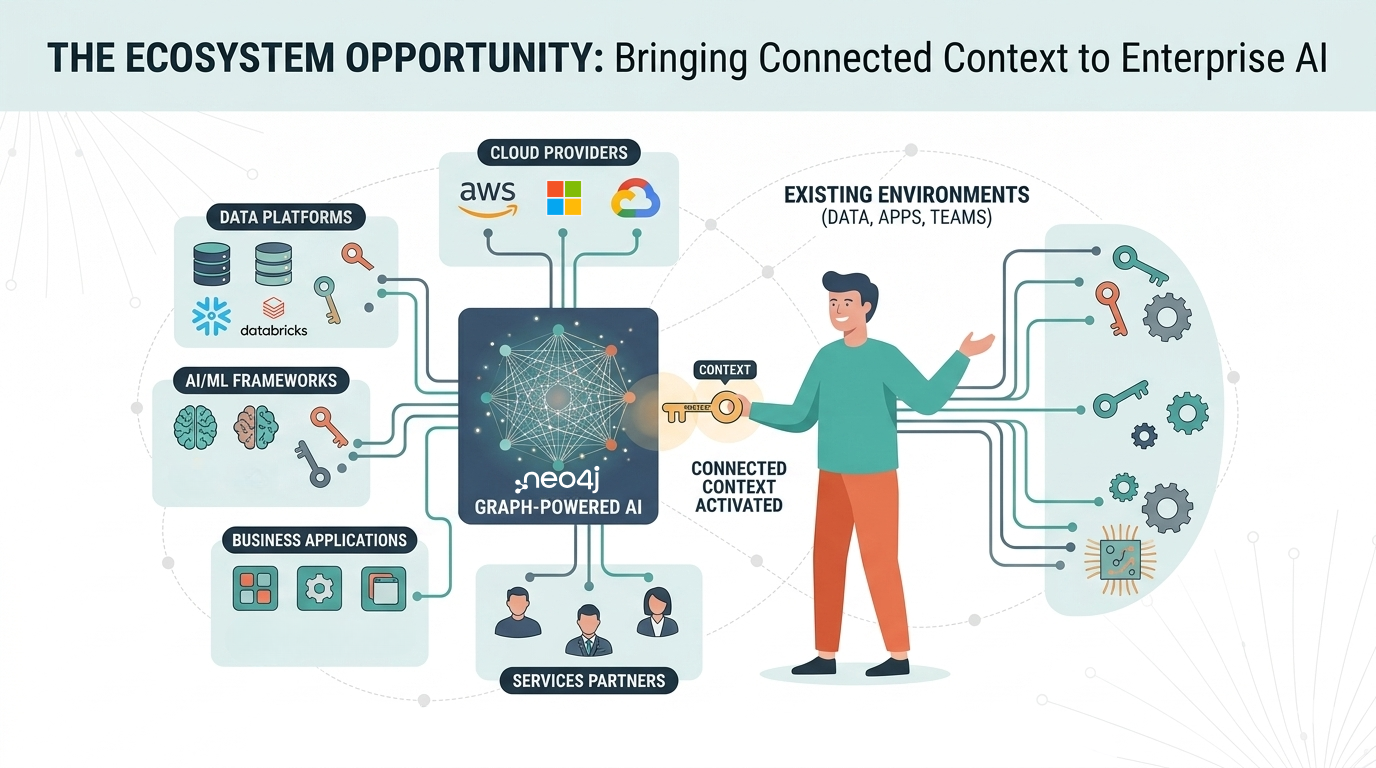
What we’re going to be talking about today is all the benefits of using a graph-powered software analytics tool:
I work as a Java developer with buschmais GbR, and we are made up of a team of software developers, engineers, architects and testers for our customers’ projects.
Because we’re human, we make mistakes. In terms of the technical aspects of what we develop, I use software analytics tools — such as Checkstyle — in my build chain to break the build if something goes wrong. If you are coming from the Java world, you can use tools such as PMD, FindBugs, Maven Enforcer Plugin and others to provide valuable feedback.
Challenges of traditional software analytics tools
Tunnel vision
Something all of these tools have in common is tunnel vision, meaning that they focus on a very specific technology or aspect. For example, Checkstyle provides feedback about missing Javadoc, incorrect formatting in your source code, and so on. But our projects use a mix of technologies, such as XML descriptors, YAML files and XJs, which makes it challenging and inefficient to find errors.
Closed set of rules and metrics
Most of these tools also come with a predefined set of rules, which you can activate or deactivate depending on your needs. You can also make changes to rule behavior, but there are often situations where you end up violating these rules. For example, you may want to express your own menu rules, or locate things in certain folders.
Opinionated rules
Even if you find a tool that helps you, especially on a design and architectural level, you get into another problem: the tool is often very opinionated. You have to do layers, construct your packages a certain way or place classes in a certain place, which doesn’t provide the flexibility I need.
Low level of abstraction
You can perform architectural management with tools such as Checkstyle, which allow you to do a couple of packages or classes that might depend on another set of classes or packages. But at the end of the day, you still aren’t exploring the things beyond those packages such as modules, layers, components, entities, services and controllers — all of which refer to Java classes. (Note: Even though this is Java-focused, these concepts apply across programming languages.)
Closed data models
Even if I wanted to add new rules to those tools, they often come with closed data models. Sometimes this forces you to struggle with technologies with which you’re unfamiliar.
The solution: jQAssistant + Neo4j
Some years ago with the help of the Neo4j team, especially Michael Hunger, I initiated a project called jQAssistant based on Neo4j to provide quality assurance. And while it’s based in Java, it isn’t limited to Java.
Here’s how it works:

Software represents structures, and there are scanners that scan those structures and store the structure information in the database. You can execute queries to explore existing structures. I recently performed an analysis for a bank to see if I could find any back doors in an application and discover the communication patterns and technologies used by that application.
You can enrich the graph and the data with higher level concepts and also find constraint violations. If you need some rules that you treat as constraints, you can do that by just executing queries. If you automate those queries, you can also create helpful reports.
The benefits of modeling software as a graph
There are many benefits to modeling software as a graph. First of all, as I already mentioned, the data is connected. We’re no longer working on islands. Secondly, it’s extensible. We start with Java, and to the graph add information from the build system along with property files, and dynamic information tracing from call graphs.
And finally, the graph data model is natural — it’s easy to understand. Let’s use the popular build system Maven as an example:
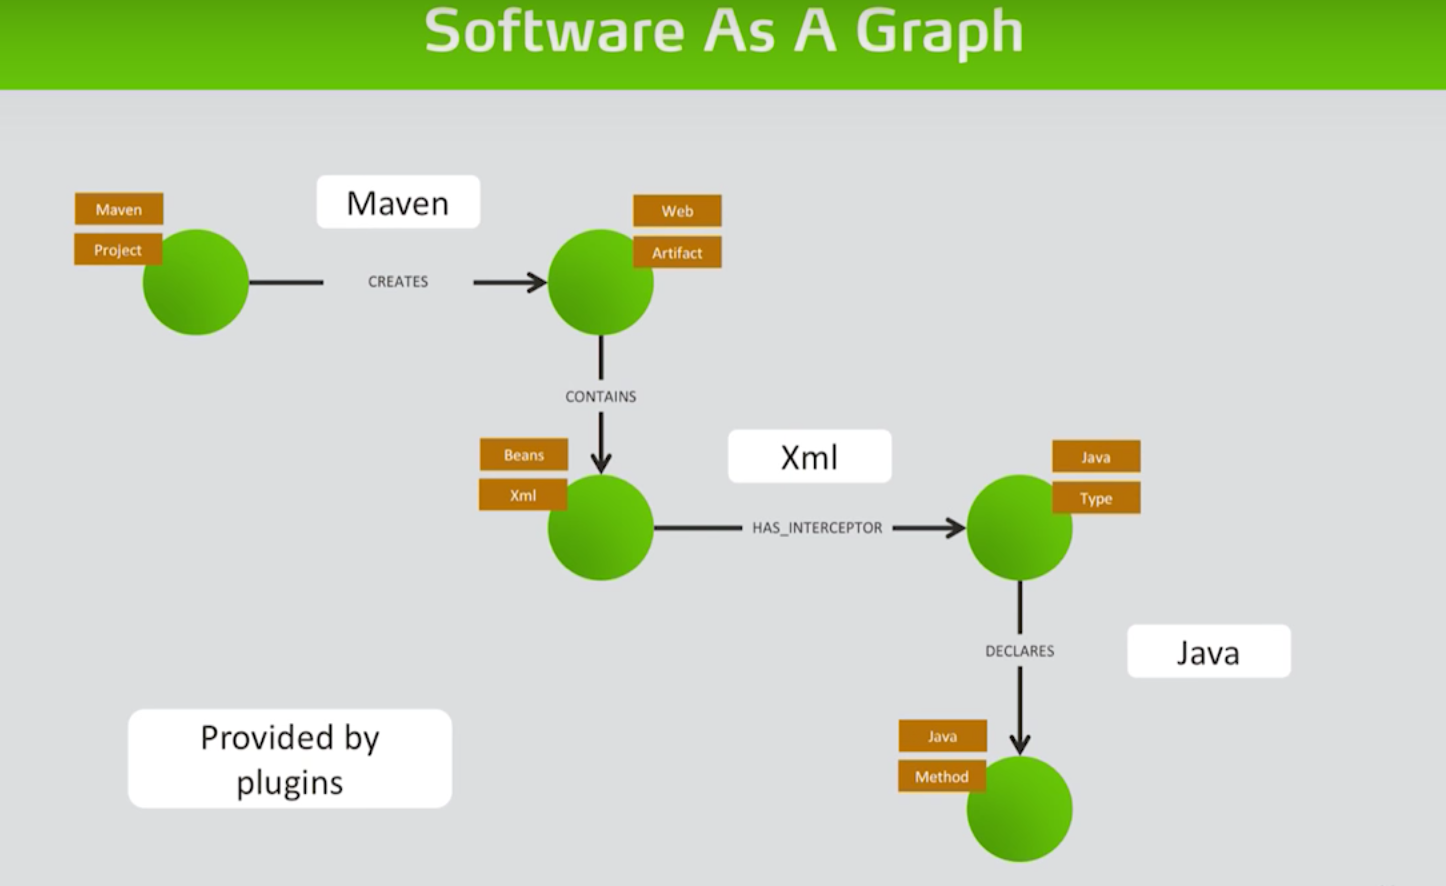
You have a Maven project that creates an artifact of our archive, and the archive contains an XML (or CDI for the Java enterprise people). That has a Java class interceptor, and the Java class declares methods.
We have several worlds connected to each other: Maven, the build system, some XML stuff and the Java class. When these are all in one place, you can execute queries across all the systems at once. This openness of the graph allows for a plugin architecture for the tools, so the JQAssistant is just a framework for plugins adding other language concepts.
This type of data model is extremely accessible. You can write in Cypher, which is a very expressive graph query language. The Maven project creates a web artifact that contains beans.xml, which has an interceptor of a specific Java type that declares a method.

A graph is also by nature multi-dimensional, meaning we can scan entire software repositories along with the artifacts that have been deployed there. For instance, the artifact we have on previous slides contained Java types and descriptors. But the repository could also contain an artifact in an older version with an older version of that class:

And if you have some idea how these relate to each other — for example if you can add relations as predecessors on both levels — you can find differences between them. In this example, we want to find out if there have been any interface changes. We can easily do an analysis on that in multiple dimensions and still maintain the level of detail from the static view we had before.
One of the most powerful features of modeling software as a graph is that you can add concrete information. This includes the raw data you already have in the graphs along with abstract data:

In this Java class you can add an annotation which provides it a role, a class. For example, an entity that maps persistent data structures. In a Java class, which is annotated by a certain type of annotation – javax.persistence.Entity, for instance – you can execute Cypher queries that say if you find a pattern where the annotation is javax.persistence.Entity, set two labels on the node. In the context of JQ systems, we call this a concept because it is usually a concept of your application. It has entities, but could also be some things like controllers or servicers.
Based on these concepts, you can create constraints:

Now you can request all packages that contain entities where the name is not model, which would be a violation if you had coding saying you want all entities in a model package, which is a constraint.
Another query below is more abstract and focused on architecture:
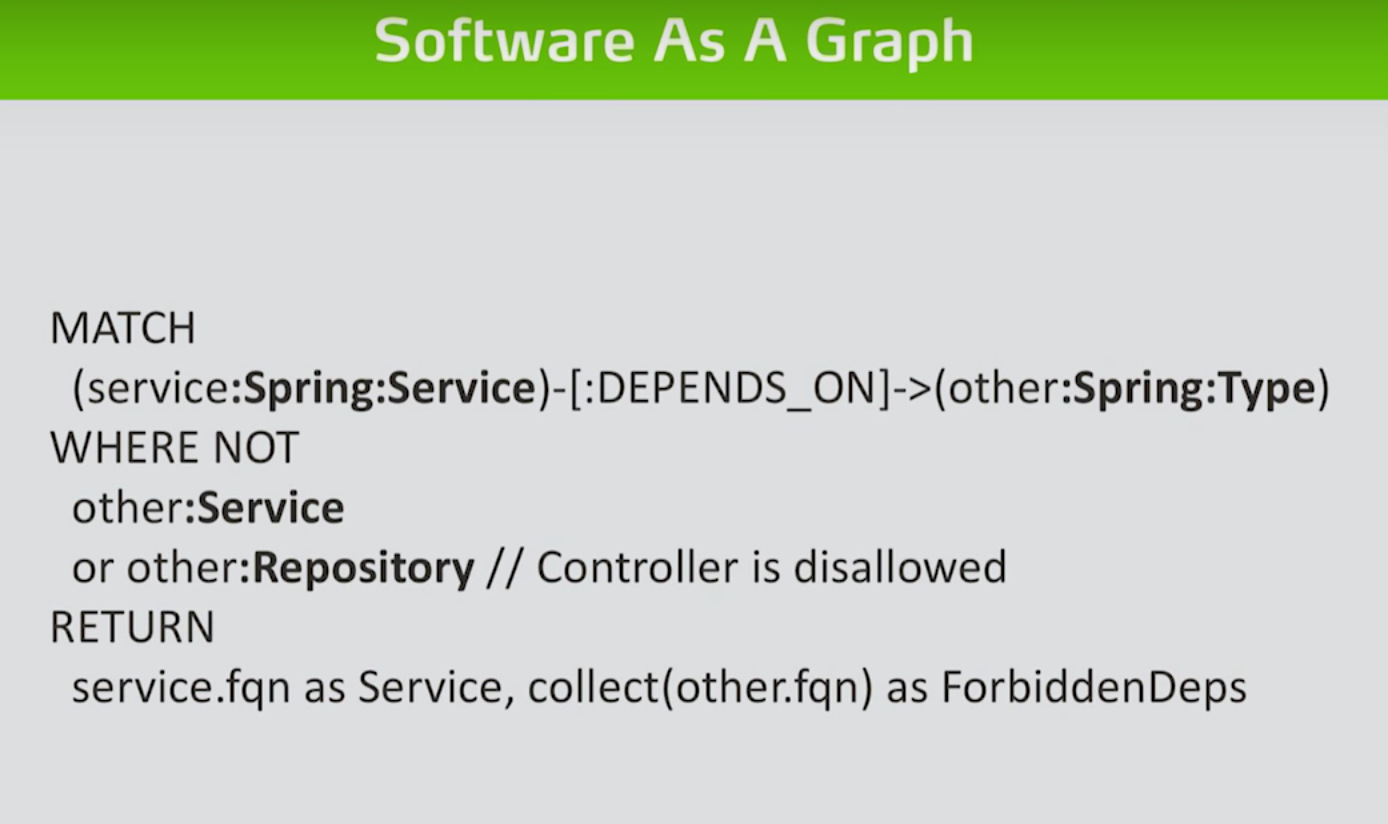
Here we are requesting all Spring services that somehow depend on other Spring types, where the other Spring types are not services or repositories. We want that returned as a violation because it has the wrong dependencies, thus allowing us to check the accuracy of our architecture. You can do that on classes, packages and even Maven modules. So the rules we have are just expressive Cypher queries which are based on abstract concepts.
You’re writing that in that notation, and below is the query:

Add in some metadata based on the concepts along with a description and an identifier, and we write it as ASCIIdoc, which are coding guidelines for developers that are actually rules.
What you get by scanning software structures into a graph database is a very holistic and extensible view of the code structure and the system architecture.
You can explore existing structures just by doing queries and returning the metrics, and you can validate your application on the fly using abstract concepts that you can define from the design and architecture language. And you put those rules in the developer documentation to close the gap between documentation and your code.
Share Article


Explore
Related Articles

Neo4j Named “One to Watch” in Snowflake’s 2026 Modern Marketing Data Stack Report


1 of 3: The difference between a graph, a knowledge graph, and a context graph

2 of 3: Why graphs, knowledge graphs, and context graphs matter to customers