A path to the graph: Data integration that begins without writing any code

Director of Sales Engineering, FactGem
5 min read
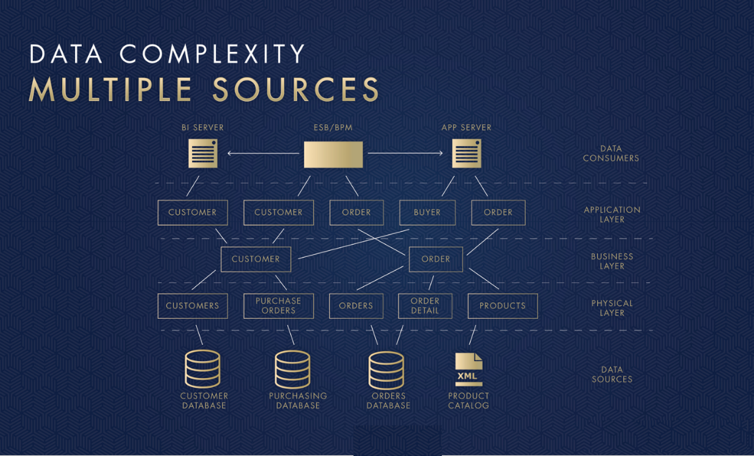
Most people understand the problem in any large organization today is that the data is in silos.
Data is disconnected, and as a result, a report from any one source is incomplete and not necessarily actionable to the extent it really can or should be. Reports providing unified views on integrated data from across the silos are required so people can look for information crucial to their organization and support a level of confidence in their division’s ability to execute and deliver accurate information to help their businesses succeed.
NoSQL: The answer to data siloes
Most organizations have already accepted the fact that the tools and technologies that created the data silo problem can’t be used to help solve the data silo problem. As a result, for the last few years we’ve seen the proliferation of NoSQL databases and technologies being developed and deployed to help integrate data more rapidly, at greater scale, and with more agility.
While these powerful new databases and platforms can reduce time in integrating data compared to traditional methods, they are all developer centric and bring with them another set of challenges that have to be overcome. In particular, they require the acquisition of new skills required to develop and work with these newer technologies.
While we live in this wonderful time of a database renaissance and have all these new wonderful technologies at our disposal, NoSQL expertise is still relatively new and developing. For over 40 years people have been developing data management and integration solutions using SQL-based technologies. It’s as if for 40 years people have been practicing data management with their right hand.
Those of us practicing on the leading edge of NoSQL come in, show them what we can do with their data, and say: “Look, we can help you work with your data to deliver results flexibly, securely, at scale and deliver insights in a ¼ of the time compared to what you’re currently doing!” The developers and business hear us, rejoice and shout: “Hell Yeah! Let’s go! How do we do it?” And we answer: “Easy! To succeed with this new technology, all we’re going to do… is ask you to use your left hand.”
Behind every technology are people
Above the technology silos are silos of people. Along with these technical integration implementations come the hurdles of updating change management and business processes to succeed in taking advantage of these new systems to optimally deliver results.
At FactGem, we provide a way to integrate data without writing any code. The engineering team at FactGem has taken on the burden of handling the complexity of integration so that business users don’t have to.
As a result, a data integration discussion doesn’t necessarily have to start with IT. FactGem’s Data Fabric application can be used by non-technical users to rapidly integrate disparate silos of data to deliver unified reports on previously disconnected data.
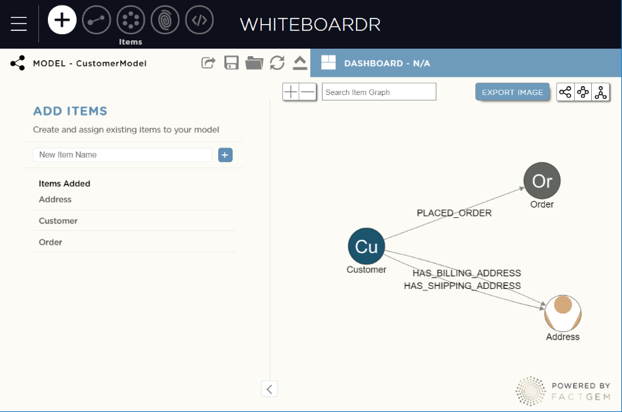
If you can draw the entities and relationships for your organization’s data on a whiteboard, you can use FactGem to integrate data. It’s that simple.
An introduction to FactGem
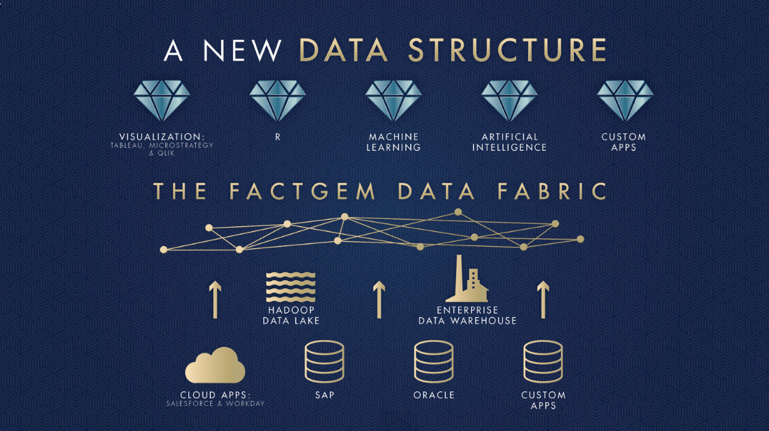
FactGem allows you to point at sources of data and load only the sources you need, and only the attributes from those sources that you need, as you need them. You start by creating a unified model for the sources you care about in WhiteboardR.
Next, you map your data sources and the attributes you care about to the WhiteboardR model using MappR. Once the mapping is complete, you can use MonitR to then load your data into FactGem where it is immediately accessible and queryable in the unified model. Data can be accessed via FactGem’s REST APIs, web data connections to BI tools such as Tableau, or custom extracts.
FactGem’s Enterprise Neo4j offering allows you to take advantage of the graph directly using Cypher as well.
FactGem: Perfect for graph beginners
And while we in the Neo4j community know the power of graph database technology, one of the big hurdles is that people are just unfamiliar and don’t know what graph technology can do.
For the most part, there’s not a tremendous amount of graph expertise out there in the large organizations implementing the types of data integration projects that FactGem and Neo4j are helping to solve. But because we believe graphs are so important, we want to help bring them to enterprises.
With FactGem it’s easy to show someone very quickly what graphs can do, by providing drag-and-drop data integration and access to data insights that weren’t available in their old data systems. This helps people immediately see the value of graphs, and makes them more willing to put resources towards adopting graph technology. And this has been the pattern with those using FactGem.
Non-technical users start in FactGem to get immediate results and insights delivered in a web-based interface that makes sense to them. From this experience they discover the power of graphs and ultimately invest in letting their people practice with their left hand, as it were, to become proficient with Neo4j and graph technologies. From here the benefits and understanding of graphs abound.
Contact us to learn more.
More resources
For more information on FactGem and Neo4j’s partnership. See our previous blog posts and presentations at GraphConnect here:
FactGem is a Bronze sponsor of GraphConnect New York. Use discount code FactGem30 to get 30% off your tickets and trainings.
Share Article


Explore
Related Articles

1 of 3: The difference between a graph, a knowledge graph, and a context graph

2 of 3: Why graphs, knowledge graphs, and context graphs matter to customers
3 of 3: The graph ecosystem: Bringing connected context to enterprise AI
Digital twins that learn: connected asset intelligence with Neo4j and Databricks
Building retail assistants customers can trust with Databricks and Neo4j