SQL Server Advocate Turns Graph:
5-Minute Interview with Dee Pandian

Senior Manager, Content, Neo4j
3 min read

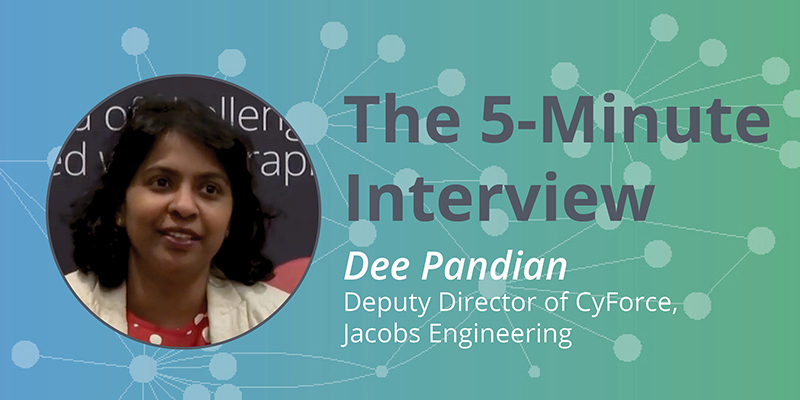
“I got a fairly big data set, around 2 gigabytes, and I created the same kind of relationships in SQL Server and in Neo4j. When I got the results back, that was a wow moment,” said Dee Pandian, Deputy Director of CyForce at Jacobs Engineering.
In this week’s five-minute interview (conducted at GraphTour DC 2019), we spoke with Dee Pandian about her experience in working with a graph database after 18 years as a SQL developer.
What made you choose Neo4j?
Dee Pandian: Because I work in Research & Development, I get a chance to research technology, and that’s how I got introduced to Neo4j.
I have about 20 years of experience in software development and 18 years as a SQL developer. I fight for including SQL Server in my projects; I’m a strong SQL Server supporter. When I first got Neo4j, I didn’t like it at all. I thought, “What is this?” The concept is different.
The shift happened once I started using Neo4j. I got a fairly big data set, around 2 gigabytes, and I created the same kind of relationships in SQL Server and in Neo4j. When I got the results back, that was a wow moment. I was like, Okay, this is how it should be!
At that point I started to understand how Facebook and LinkedIn recommendations work on the backend. I thought, Oh, that’s how they are using that technology! I could easily make that connection.
Since then, I started leaning toward graph technology.
What have been the most surprising results you have seen from Neo4j?

Pandian: Our use of Neo4j was not at all planned. I got a configuration file from my boss, and he wanted to put it in Neo4j to see the results. I plotted it in Neo4j and showed him the results.
The moment he looked at it, he said, “No, this system should not be linked with that one.” I said, “I didn’t link them. The graph shows that there is a relationship between this system and that system.” He said, “Oh my God!” and he realized it was a misconfiguration. We removed the configuration between the two systems. That was another wow moment.
If you could go back to when you first started using graphs, what would you change?
Pandian: I’d try to turn SQL Server into graph technology, using nodes instead of saving everything in rows and columns and having lots of indexes. If you can specify relationships the moment you enter the data, you don’t have to worry at pulling time.
What are your favorite aspects of working with Neo4j?
Pandian: Speed, accessibility and results I haven’t even thought about. That’s an amazing part of using Neo4j. I might think this system has these IP addresses, and then the graph will plot other IP addresses. Another interesting aspect of Neo4j is how easily it lets you create relationships.
What are you looking forward to in Neo4j?
Pandian: We developed a small ETL tool for our work so we could flow data into the graph instead of manually populating it. I thought I would use our ETL tool a lot, but, today, I was surprised to see that Neo4j is developing an ETL tool. I think we’re going to use that instead.
Want to share about your Neo4j project in a future 5-Minute Interview? Drop us a line at content@neo4j.com


