7VORTEX: Systems Thinking Powered by Graph Technology

Consultant, GraphAware
8 min read

The success of many enterprises greatly depends on their ability to gather useful information and process it in a timely manner. Automation is essential and so is presentation, giving tangible feedback, to decision makers. This is where technology reaches out to management, where science and design are combined to put the right people in the position of making better and more sustainable choices.
Decision making is often a very complex task. Outcomes depend on a multitude of interactions between variables, actions, and actors at play in multiple contexts. While emphasis on individual aspects or subsets of interactions is very important, information must also be presented in a coherent, connected way. It is vital to establish feedback with the entire system that emerges from the network of interactions.
A Journey to the Graph
Hugo Araujo is an entrepreneur, a consultant and an expert in biomimicry, the imitation of well-tested patterns found in nature to solve human problems. Hugo approached GraphAware to find a technology partner for developing an advanced consultancy and knowledge management tool which could help him capitalize on 10 years of working experience in different contexts: business, nonprofit and even off-the-grid natural reserves in Europe and Latin America. He wanted to connect information in a fashion that matched the complex systems he analyzed, such as natural ecosystems and human organizations.
Biomimicry is concerned with emulating the biological patterns, evolutionary strategies and ecosystem dynamics that natural selection has refined for millions of years and subsequently applying them to new, artificial solutions. When it comes to deriving relevant knowledge from information, the model is the complex network of the human brain. What really matters is the ability to leverage the relationships and connect the dots. This need for managing complexity led Hugo to the Neo4j graph database, which provides the ability to store, retrieve and compute data in a naturally connected way.
GraphAware helped Hugo to create 7VORTEX, a tool inspired by nature for managing information, creating beautiful graph-based presentations, and deriving systemic knowledge, powered by Neo4j (thanks to the Neo4j Startup Program).
The Biology Of Connected Data
“I think the biggest innovations of the 21st century will be at the intersection of biology and technology. A new era is beginning…”
–Steve Jobs, in Isaacson, W., 2011
7VORTEX Presentations are graph visualizations where nodes are bubbles and links are double-weighted. Conceptually similar to an identity card for a piece of information, a bubble represents anything that contains a title and optional URL, media, text and tags. Links have optional data, can also be weighted, and represent “energy exchanges” between connected bubbles, mimicking biological interactions between organisms.
A relationship can have a detrimental (-), neutral (0), or beneficial (+) effect on each of the connected bubbles. In the example (A)-[+, -]->(B) element A is gaining energy from the relationship with B, while the same relationship is causing B energy loss.

Figure 1: Example of predation relationship.
Figure 1 (above) describes a relationship type well known in biology – predation – which defines the roles of predator (the cat) and prey (the mouse). Indeed, each of the 6 combinations of values identifies a specific relationship type.

Figure 2: Types of interaction between organism A and organism B. Image © Hugo Araujo
Figure 2 adds a rainbow gradient to these types, so they can either be used as discrete categories or as intensity levels. More information about biological interactions can be found here.
Modeling weighted networks as energy exchanges between nodes is just one of the insights Hugo derived from connecting biology and information management. We are very excited about the analytical possibilities of his model choice since it allows us to distinguish the effect of a relationship on source and target nodes and grasp the complex dynamics of a system.
These analytical possibilities, such as the use of color coding of relationships based on specific criteria, can provide important systemic insights. For example, selective relationship coloring is used in the figure below to reveal strong or weak spots in an ecosystem map.
Figure 3: using colors to highlight relationship types.
As Steve Jobs’ quote illustrates, there are immense opportunities in the intersection of life sciences and technology. Graphs are by definition cross-boundary constructs and are well suited solutions for many new use cases coming from these intersections.
In particular, the flexibility of Neo4j’s data model is capable of levering all sorts of interconnection logic and, with power and scale limits pushed further at every release, it is going to lead many new businesses forward.
The Semantics Of Connected Data
Another important intersection is between linguistics and technology. Graph technology is again a core player in this game, as meaning and form in language are also dependent on the connections between speech elements, context, and other concepts.
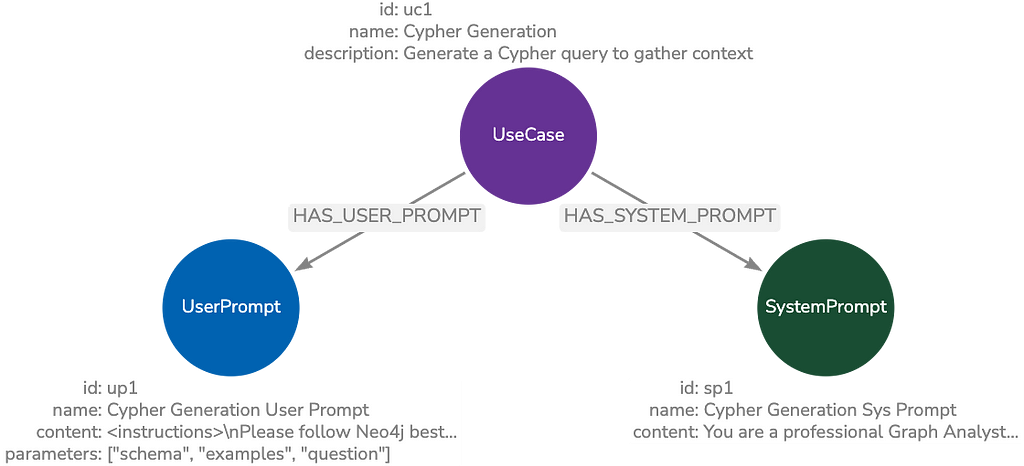
In 7VORTEX, we are paving the way to leverage this new technology. Bubbles, as units of information, are associated with Concepts. One bubble has one main concept (the topic), but is also linked to other concepts through tags. This way we have interconnected Presentations, and we can easily find them with simple Cypher queries like this:
MATCH (p:Presentation)-[:ELEMENT]->(e)-[:TOPIC]->
      (c:Concept {name: '7VORTEX'})<-[:TOPIC]-(e2)<-[:ELEMENT]-(p2)
WHERE p <> p2
RETURN *

Figure 4: connections through concepts.
Using Natural Language Processing (NLP) we could easily detect when two bubbles refer to the same concept, even with language or spelling variances. Automatic categorization of Presentations is possible as well.
We can also leverage these semantic connections of the data to provide recommendations on which tags to add to a bubble or even suggest which bubble should be next in a presentation. PowerPoint-like tools are often used to create presentations, including different views of the same content.
By taking advantage of NLP and graphs, the system could detect what you are working on and, after a few initial bubbles, could suggest the next topic. Such systems would function as a PowerPoint where pieces of information can be populated on demand, such as making topic or tag selections from a suggestions list.
Find And Create Gems in The Public Library
7VORTEX has two different versions. The free version is publicly available and is called Lucky7 as it allows the creation of presentations of up to 7 bubbles. The bubbles are positioned according to their number, generating a beautiful crystal-like presentation of a central topic and its branches.

Figure 5: crystal-like bubble positioning.
All bubbles can link to another presentation, allowing for “inward” navigation. Previous and next buttons allow sideways navigation making it easy for the presenter to explore the bubble-verse. The full-screen mode allows you to examine bubble media, such as uploaded images or embedded YouTube videos, in more detail.
The 7VORTEX public library provides tangible examples of these concepts.

Figure 6: 7VORTEX public library.
As an example, Figure 7 illustrates a presentation about visual complexity.

Figure 7: example of a 7VORTEX presentation about “Visual Complexity”.
Graph-Based Storytelling and Analysis
Ecosystem Map, the advanced version of 7VORTEX, is available exclusively to Hugo’s clients. The Ecosystem Map contains numerous advanced features and does not impose any limits on the number of graph elements.

Figure 8: edit ecosystem map with neighbors of selected bubble highlighted.
Some of these advanced features empower the storytelling and content creation experience, such as in-place editing. The editing view is embedded into the visualization, so fields are editable and drag-and-drop gestures allow to add bubbles and links to the graph.

Figure 9: Drag and drop to create new bubbles or new links.
When we tell a story, such as during a presentation, we often wish to adjust the content to the audience reactions and to the performance of the moment. We want the audience to follow the thread of the story, sometimes allowing them to jump in. A pre-defined linear sequence, showed one slide at a time, is often not dynamic enough. Instead, stories can be seen as a networks of connected chapters where one scene leads to another.
The 7VORTEX Presentation is actually a graph and not a simple hierarchy or sequence of slides, allowing us to experiment with new graph-based storytelling features, such as breadth-first and depth-first narrative modes. These modes will allow the presenter to navigate the presentation, moving to or revealing adjacent bubbles according to the graph topology. The application currently uses a force simulation layout with collision detection, capable of automatically displaying graphs. More layouts will be available in the future.
Other advanced features increase the analytical capabilities of the tool. For example, it is possible to resize bubbles according to their local centrality (degree) to highlight the most valuable ones. We are experimenting in two directions here. On one side we want to leverage the energy exchanges, e.g., by differentiating graph metrics based on positive, negative and neutral effects. On the other side, we are implementing other metrics like Betweenness and PageRank centrality using the new Neo4j Graph Algorithms plugin. These graph algorithms also provide automatic graph partitioning and path detection, which can be used to identify structurally similar areas in an ecosystem map or to highlight minimum length paths that connect some bubbles.
7VORTEX has become central to Hugo’s consultancy work, contributing to many successful projects. As time progresses, each project often requires re-analyzing the situation, evaluating what has changed, in particular which connections have been severed and which connections have been created. The technology we have in place will allow the comparison of different time slices of the same network, which is another source of deep analytical insight.
Conclusion
“Unable to communicate the complexity of my information, I was paralyzed by technology. Thanks to GraphAware, I have been able to share how everything is connected and to capitalize my knowledge with a graph”
–Hugo Araujo
7VORTEX is powered by Neo4j. A sincere thanks to Neo4j for their amazing startup program. We encourage every startup with graph use cases to check out the program.
The time has come for many enterprises to put complexity to work to their benefit. Graph technology and the associated ecosystem of integrations are leading this wave, powering many new projects. At GraphAware, we are very active in this ecosystem and we make sure companies of all sizes around the world succeed with Neo4j.
GraphAware is Gold Sponsor of GraphConnect New York, so if you want to check out what we can do for your business, come to meet the team at our booth. We wish you a great GraphConnect and recommend that you watch the videos if you can’t make it!
GraphAware is a Gold sponsor of GraphConnect New York. Use discount code GRAPHAWARE30 to get 30% off your tickets and trainings.
Share Article


Explore
Related Articles


Top 10 Graph Database Use Cases (With Real-World Case Studies)