Agile Open Source Intelligence: 5-Minute Interview with Frederick Kagan

Senior Manager, Content, Neo4j
6 min read

“One thing that a relational database isn’t, is relational ,” said Frederick Kagan, Director of the Critical Threats Project at the American Enterprise Institute.
All intelligence organizations are interested in seeing data connections and traversing networks. The Critical Threats Project does open source intelligence, mining the internet and social media to produce intelligence analysis based on a rigorously cultivated dataset. From that analysis, they generate insights into what’s going on in conflict areas around the globe to share with policymakers, the media and the public.
In this week’s five-minute interview (conducted at GraphConnect 2018 in NYC), we discuss why Frederick Kagan chose Neo4j as the backbone for its intelligence analytics.
How do you use Neo4j?
Frederick Kagan: At the Critical Threats Project, we have a highly cultivated dataset of events and entities, people, places and things and their relationships to one another based on data that we pull from the Internet and from social media.
That database, its integrity and our ability to access it, visualize it and traverse it, are central to our ability to perform our analysis and forecasting and derive insight from our information.
We use Neo4j as the backbone for the information system in which that data resides. We chose Neo4j for a number of reasons, but principally because we think that a graph database is the right model for the intelligence community and for any kind of intelligence organization moving forward, and we think that Neo4j has the best graph database structure out there.
What is a major problem Neo4j has solved for you?
Kagan: One of our problems is that we operate extensively on unstructured data.
The team is going out and reading articles and so forth in local media, and we need to bring that into a database. But we also interact with a lot of structured databases provided by various non-governmental and governmental organizations, as well as from others who do the same type of thing we do. All of the data comes in different structures. And we had legacy data from another system that was in yet another structure.
We’ve learned that it’s very important to give analysts a single graphical user interface by which to interact with their data. The more clicks you put between a user and insight, the less insight you actually get and the more users run away from a tool.
Being able to bring all of those disparate data sources together in a single place and have users interact with them seamlessly is vital. The graph technology that Neo4j has makes that very, very easy in a way that traditional SQL databases make it very, very hard.
And the key to this is that Neo4j allows you to have multiple, overlapping ontologies coexisting simultaneously in the same dataset without degrading performance. Whereas in a traditional SQL database, if you have a new data structure, or even if you just add a new type of property, you have to add it and then you have to reindex all of the tables and all the JOIN tables and so forth.
With Neo4j, you don’t have to do any of that.
Basically, you add a new label or a new set of labels and bring it straight in. I’ve done that repeatedly and it’s very easy. Getting the data into the database is the easy part. And the only part that I then had to deal with a little bit is how to present it on the front end to the user, given that it’s in a slightly different structure. But the ability to munge data like that is incredibly important for the kind of work we do.
Why is flexibility so important to you?
We are operating in a very dynamic environment. We are exploring how to do what it is that we do. We’re thinking about it all the time. And we’re coming up with new ideas for how to organize our data, how to categorize it, how to arrange it, how to make links and so forth.
Having the ability to change the ontology that we’re using on the fly – and in a way that’s transparent to the user and doesn’t require taking databases offline or indexing or reindexing or anything like that – is incredibly important to sustaining the dynamism of our own development of our tech stack and of our analytical workflow and processes.
Why is graph technology valuable to the intelligence community?
Kagan: I think graph technology is really the ideal technology for the backbone for intelligence analytical systems. There are a couple of reasons for that. One is the ease with which it supports data munging and bringing together lots of different data sources, which is a huge problem in the intelligence community and generally.
The other, of course, is that all intelligence organizations, whether business or government, are interested in seeing network connections and traversing networks. And that is, of course, the thing that graph usually sells and is the most obvious thing, and it’s quite valid.
I have interacted with other systems that laid what looked like a graph GUI on top of a SQL database, and then I have used Neo4j to do similar things. It is unquestionable that you get much better performance when you’re doing graph traversals and when you’re reaching out to different degrees of separation with a true graph database versus a SQL database that is presenting you with a graph-like GUI.
And since understanding network diagramming and understanding network relationships and traversing graphs rapidly is going to continue to be a huge problem for the intelligence community and all of us, I think that graph is the natural place where the community should migrate to.
What made you choose Neo4j?
Kagan: I came to the task of writing the software that we use in a strange way. I’m a hobbyist programmer. I’ve never taken a computer science course. My college appreciation job years ago was writing Fortran 77 code for a geophysicist.
I picked up Python a few years ago because I thought it would be helpful and then I found myself for various reasons having to write code that will allow us to interact with a dataset and bring that dataset into something. So I decided to bring it into Neo4j.
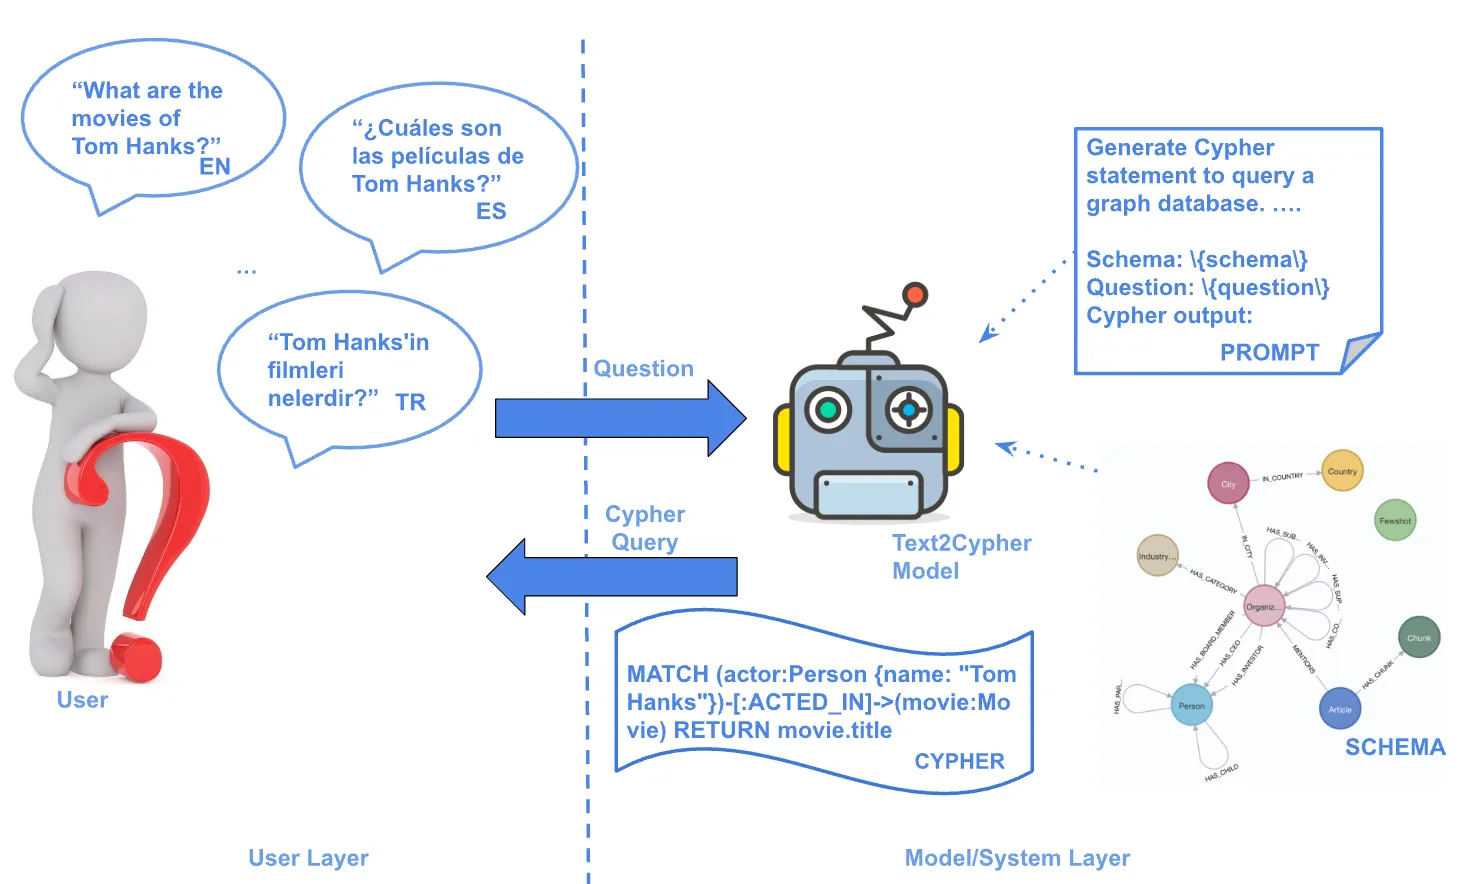
To my amazement, learning how to use Neo4j, how to get the data into Neo4j, and how to write Cypher queries, was the easy part. All the other stuff that I had to do was the hard part. But I found Neo4j to be an incredibly user-friendly interface and Cypher to be an incredibly user-friendly and intuitive way of interacting with the data that made it super easy for me, as a novice programmer, to bring our data into this data structure and start interacting with it.
I’ve also found Neo4j to be incredibly reliable. Which is good, because I’m the backend engineer as well. I’ve had to do virtually nothing to maintain a healthy dataset for more than a year. It’s used at any given time by 40 or 50 analysts and has eight or nine million nodes in it of different types. It’s been incredibly stable and reliable with very little maintenance.
So, from all of those perspectives, as a tool for someone who is relatively inexperienced, working with Neo4j has been a dream.
What has been your most unexpected use of Neo4j?
Kagan: We were so excited about Neo4j and how we were using it for our backend, that when we had to redesign our website, we talked with the vendor who was working on that for us and we persuaded them to use Neo4j as the backend for the website.
Instead of using the traditional WordPress SQL backend data store on the website, we’re running a Neo4j database behind the website that is also going to facilitate the integration of our research data directly into visualizations on the site. And it’s a really good backbone for a website because of the relational aspect of it.
Funny thing is, the one thing that a relational database isn’t, is relational in the sense that when we talk about graph relationships.
I think the company that did our website was very excited about learning how to use Neo4j and bringing it into the website. I think that that’s another application that also has a lot of interest.
Want to share about your Neo4j project in a future 5-Minute Interview? Drop us a line at content@neo4j.com
Download this white paper, The Top 5 Use Cases of Graph Databases, and discover how to tap into the power of graphs for the connected enterprise.


