
Announcing Neo4j for Graph Data Science

Senior Director of Product Management, Graph Data Science
6 min read
At Neo4j, we’ve always been user-driven, and we know that many of you are dealing with increasingly complex questions and uncertain situations.
One of our biggest user communities are developers and data scientists working for businesses that use advanced analytics and data science to improve predictions and drive better decision making. Because relationships are so predictive of behavior, we heard your collective call to simplify the methods of incorporating connected data into your workflows with robust, enterprise-grade features and scale.
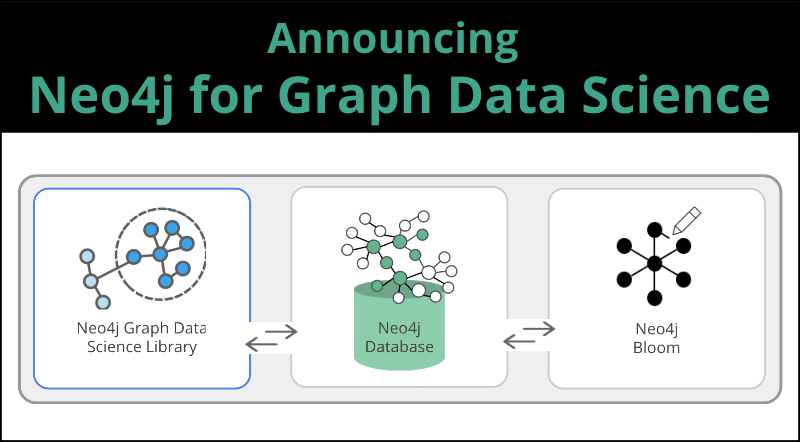
We appreciate your candid stories and collaboration, and we’ve used this to create a better solution. As such, we’re excited to announce Neo4j for Graph Data Science™, the first data science environment built to harness the predictive power of relationships for enterprise deployments.
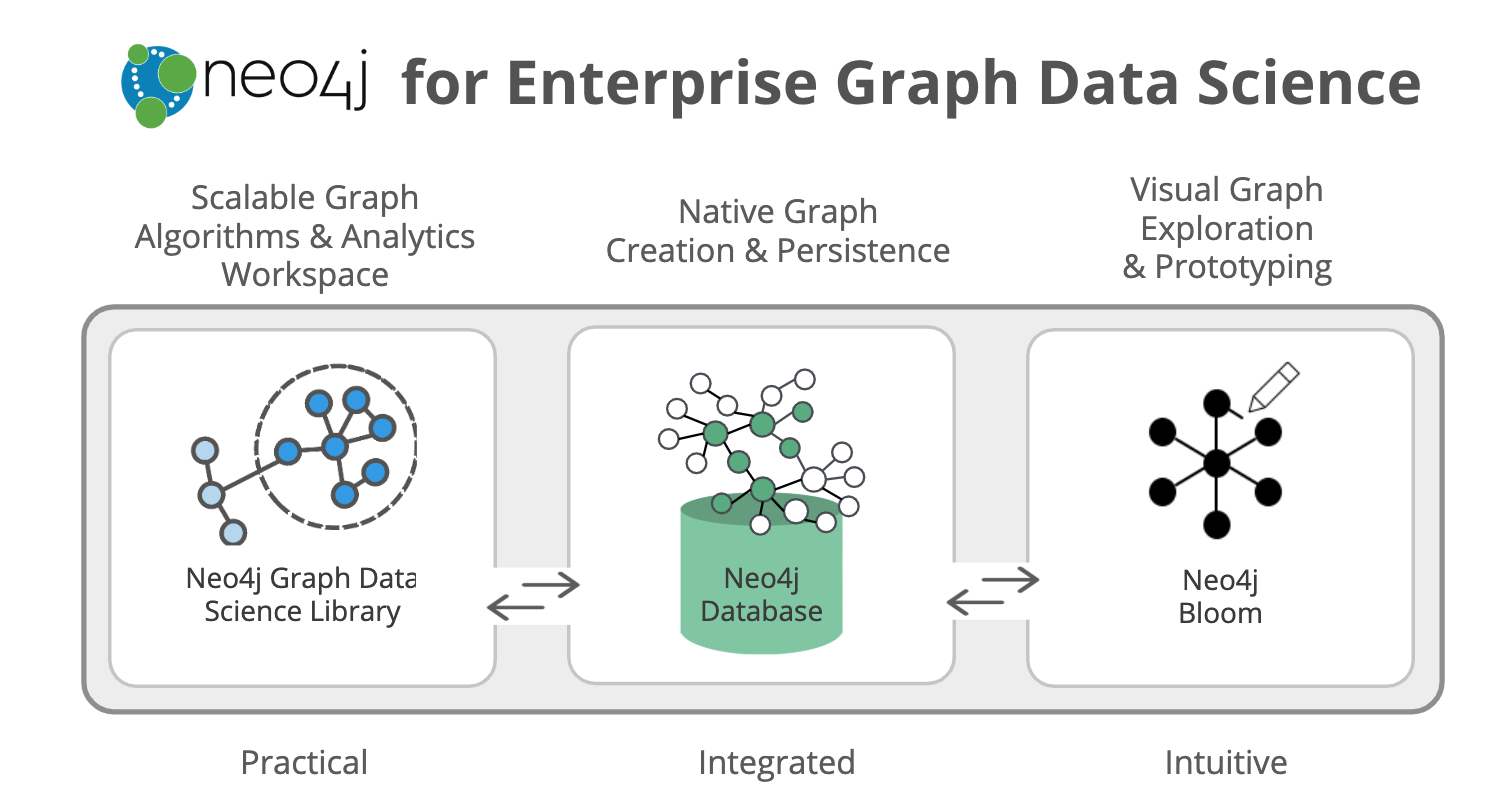
Neo4j for Graph Data Science is an ecosystem of tools that includes:
- The completely new Neo4j Graph Data Science™ (GDS) Library for support in efficiently executing graph algorithms.
- The Neo4j Database for the fastest path to graph success.
- The Neo4j Bloom visualization tool to easily explore and investigate your results.
With Neo4j for Graph Data Science, data scientists are empowered to confidently operationalize graph analytics and machine learning (ML) models to infer behavior from connected data.
What Is Graph Data Science?
When speaking to practitioners, the first questions I’m often asked is, “What is graph data science and how is it different from what I’m already doing?”
Simply put, graph data science is connected data science, where relationships are first-class citizens and the connections between your data points can be used to make better, more accurate predictions. Instead of thinking about your data in rows and columns, you begin to consider the importance of the relationships between those data points, which are potentially far more valuable for predictive accuracy than your flat tabular descriptors.
Graph data science uses multidisciplinary workflows – combining queries, statistics, graph algorithms and ML techniques – for leveraging the relationships and topology of connected data to power artificial intelligence (AI) applications. Beyond algorithms and statistics, graph data science uses expressive Cypher queries to interrogate your graph and find local patterns. Visualization tools like Bloom advance efforts to explore, summarize and interact with your data.
Graph data science is broken down into two categories: graph analytics and graph-enhanced machine learning.
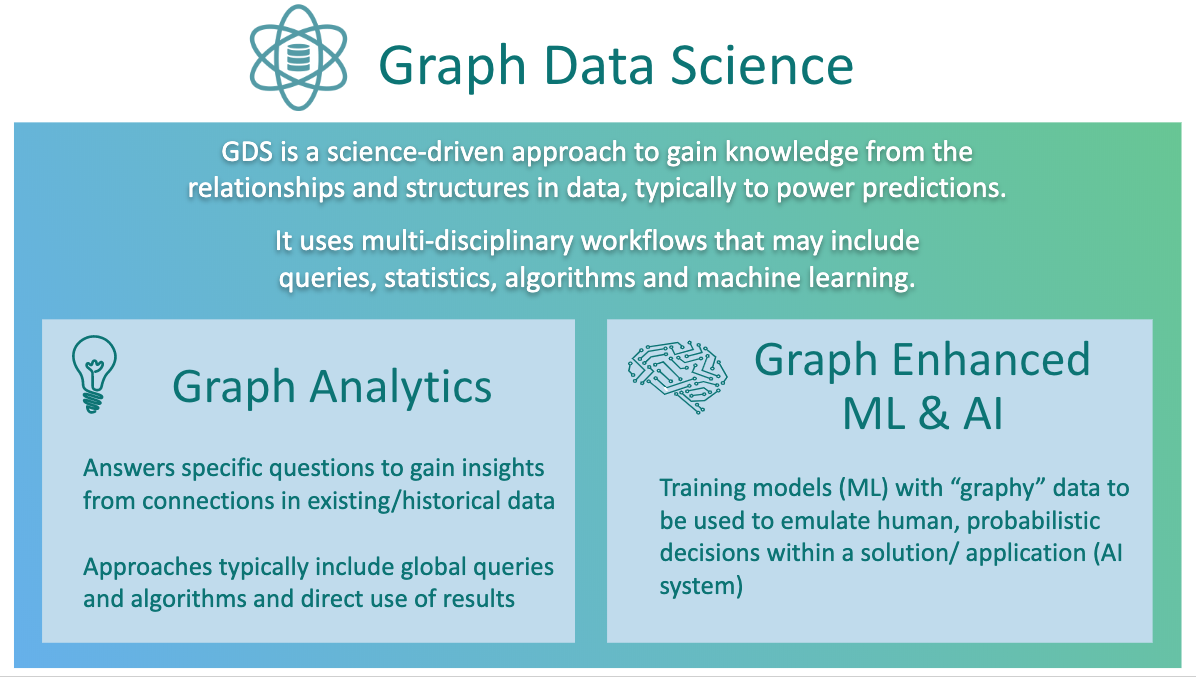
Graph analytics uses global queries or graph algorithms to answer specific questions, such as how many customers are in a marketing graph, are there any fraud rings in transaction data, or who’s the most important influencer in a network. Often, these kinds of questions can’t be answered without graphs.
Graph-enhanced machine learning uses graph algorithms or queries to describe the global topology or connectivity of your data set, and those features are used to train traditional ML models. You can add in descriptors based on your graph topology and relationships as additional features (or columns) in the model building pipelines that you’re used to using. Graph-based features let you make better predictions, using the data you already have.
Neo4j Graph Data Science Library
Neo4j’s Graph Data Science Library provides data scientists with a rich toolkit offering a flexible, analytics-designed data structure for global computations, and a library of parallelized, robust algorithms that quickly compute over very large graphs.
Algorithms are one of the most powerful tools in a data scientist’s toolbox. Graph algorithms are unsupervised ML methods and heuristics that learn and describe the topology of your graph.
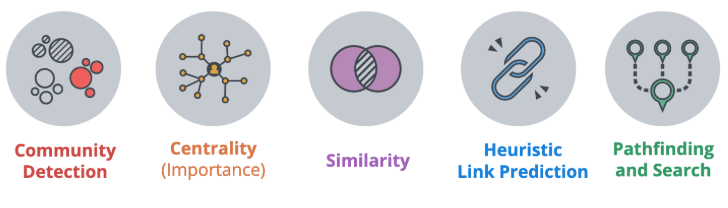
The categories of validated, supported algorithms in the GDS™ Library are:
- Community Detection algorithms that cluster your graph based on relationships
- Centrality algorithms that reveal which nodes are important based on graph topology
- Similarity algorithms that identify similar nodes based on their neighbors or properties
- Pathfinding algorithms that find the shortest or most efficient paths to traverse a graph
- Link Prediction algorithms that predict unobserved or future relationships between nodes
These graph algorithms help to effectively answer questions about your data’s connectivity or topology, or generate new and highly predictive features for your existing ML pipelines.
Ready to try out these graph algorithms? Check out our Neo4j Graph Data Science sandbox or play the Browser guide :play graph-data-science from within Neo4j desktop!
Flexible, Scalable Analytics Workspace
For efficiency, algorithms run on materialized in-memory computational graphs. Underlying data from your Neo4j database is transformed into a data structure optimized for global traversals and aggregations for extremely efficient and scalable execution over very large graphs with tens of billions of nodes.
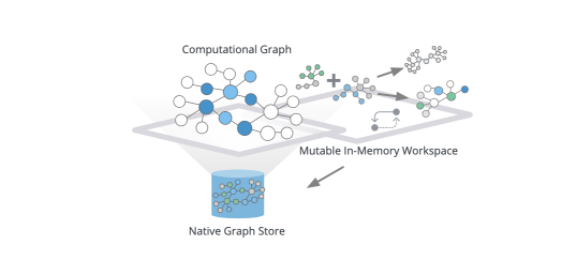
The in-memory graph allows you to project different subsets of your graph and flexibly reshape your graph.
For example, you could create new relationships based on multi-hop paths or quickly aggregate or combine relationships or node labels. You aren’t limited to a single computational graph. You can load multiple computational graphs, and reference their names to execute algorithms against different projections. Once you’re satisfied with your results, you can either update your computational graph, stream results out (for example, into your Python environment) or write the results back to your database.
By combining the power of graph mutability with our algorithms, we’ve given users the ability to build workflows to load named graphs into memory, chain algorithms together to build pipelines that execute against these computational graphs, and ultimately write to their database or exporting new graphs.
Graph Data Science: Drug Discovery Example
If you’re struggling to wrap your head around this workflow concept, it’s helpful to walk through a real use case. Drug discovery is a great example of graph data science in action.
Let’s say we want to identify new drugs for a disease of interest, using a knowledge graph with the following schema (:Drug)-[:TREATS]->(:Disease)<-[:ASSOCIATED_WITH]-(:Gene)-[:TARGETS]->(:Drug).
Our graph could be derived from experimental data, published literature, patents or more.
Once we’ve built a knowledge graph – the foundation to build our data science workflows on – we can start exploring and analyzing our data. A simple workflow might look like:
- Pull an interesting subgraph into memory, starting with genes that are either treated with the same drug or associated with the same disease.
- Find disjointed subgraphs in the gene-gene graph projection using the Weakly Connected Components (WCC) algorithm. Update your in memory graph with these new community IDs.
- Calculate the similarity of genes for each WCC community, based on their neighbors using node similarity (Jaccard). Update your in-memory graph with a
‘SIMILAR_TO’relationship, identifying genes that have over 50% similarity. - Run Louvain to find networks interacting genes with similar topology by referencing your new
SIMILAR_TOrelationship, using the similarity score as a weight. - Write the Louvain communities back to Neo4j so you have access to query your results in the broader context of your graph.
- Query your knowledge graph to find the gene communities associated with your disease of interest, and retrieve all the genes that don’t have an edge to your disease.
- Explore your graph visually in Neo4j Bloom to investigate pathways among interesting communities.
Now you’ve created a whole new batch of targets to investigate! You could re-run this workflow on other projections or data subsets, or test your results with different Community Detection algorithms or different ways of calculating gene similarity.
When you combine the power of graph projection with the scalability of mutable graph workflows, it becomes easy to experiment and find otherwise hidden insights.
If you’ve used the Graph Algorithms Library previously, you should switch to the GDS Library to take advantage of optimized algorithms and graph loading, simplified API and in-memory graph shaping. Check out the migration guide for information on moving to the new library.
Conclusion
I’m thrilled that we are already helping customers in industries from healthcare to finance and marketing to address hard questions that were previously intractable. Likewise, I’ve been impressed by the breadth and creativity of the projects I’ve seen so far – and I can’t wait to see what you’ll do with the new GDS Library!
We’re looking forward to releasing new features every quarter in 2020, so please stay tuned for updates from our end as well.
If you’re ready to get started now, you can install the GDS Library plug-in in Neo4j Desktop or access it from the Neo4j Download Center.
Register today to join us for Neo4j Connections: Graph Data Science, a full day of online talks about data science from customers and Neo4j experts.
Share Article


Explore
Related Articles

Mastering Fraud Detection With Temporal Graph Modeling

Neo4j Named a 2025 Gartner® Peer Insights™ Customers’ Choice for Cloud Database Management Systems


Neo4j Graph Analytics for Snowflake: Bringing Graph-Powered Insights to the AI Data Cloud
