Applying graphs to enterprise media asset management


10 min read
Editor’s Note: This presentation was given by Brant Boehmann and Chris Goodacre at GraphConnect New York in October 2017.
Presentation summary
Scripps Networks Interactive is a leading developer of engaging lifestyle content in the home, food and travel categories for television, the internet and emerging platforms.
Their U.S. lifestyle portfolio comprises popular television and internet brands HGTV, DIY Network, Food Network, Cooking Channel, Travel Channel and Great American Country, which collectively engage more than 190 million consumers each month, and HGTV was among the top 10 cable networks in 2016.
Managing the asset and instance-level metadata for Scripps’ historical media portfolio is critical to their business. It affects everything from broadcast availability to viewing behavior to the ability to syndicate content to non-linear and international broadcast partners.
In this session, the speakers will discuss:
- Applying graph technology to federate relevant metadata across multiple digital asset management systems into a cohesive multimedia library
- Leveraging the advantages of a graph database over traditional relational databases
- Facilitating modeling via graph database technology of complex, multi-dimensional relationships between multiple domains (such as shows, seasons, episodes, formats and versions)
Full presentation: Applying graphs to enterprise media asset management
What we’re going to be talking about today is how we use Neo4j to federate digital asset management systems at the Scripps Networks Interactive:
Challenges with a relational database
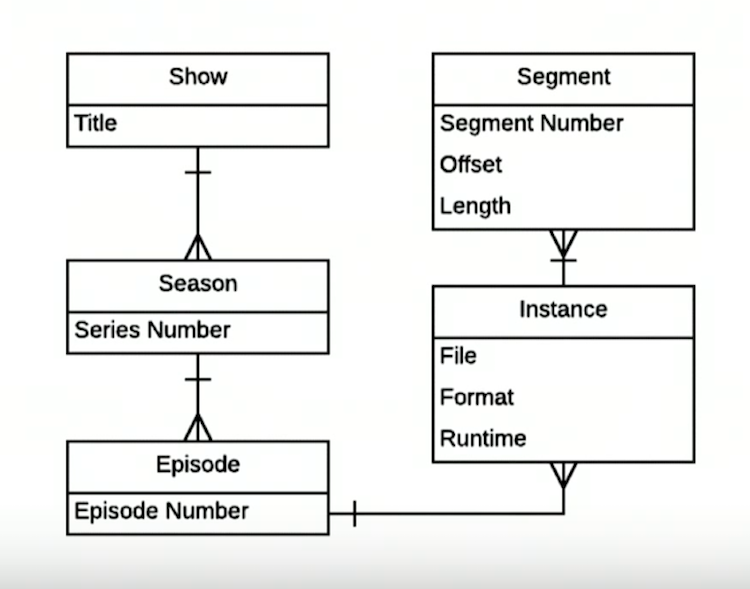
Chris Goodacre: You may not be familiar with Scripps Networks, but you probably know our brands like HDTV, DIY, Food Network and the Cooking Channel. Traditional television includes shows, series, episodes and have video segments.
Below is a fairly elementary model of what this all looks like:
However, when you start adding real-life ideas like brands, channels, talent, production organizations and distribution rights, your simple model turns into something more like this:
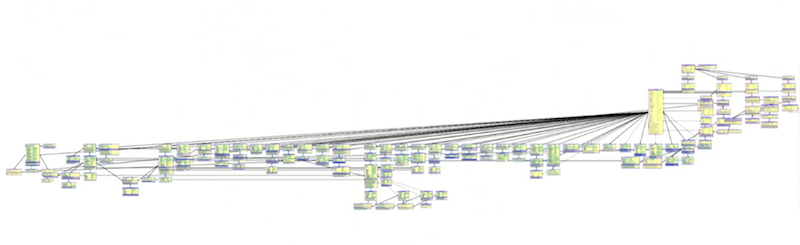
Our model becomes even more complex when we start tracking more than just video assets, such as production management, distribution rights agreements, licensing agreements, closed caption files, corresponding imagery, audio files and recipes.
Point-to-point integration doesn’t work in this situation for several reasons, the first of which is that it’s an anti-pattern. This isn’t manageable when your digital asset management systems are a collection of SaaS, COTs and homegrown. It also doesn’t allow you to coordinate the changes for systems you don’t control, which is a significant hurdle to meeting business deadlines.
This is why settled on a hub-and-spoke model:

Our digital asset management systems sit at the edge of the wheel, while our Scripps Asset Registry sits in the middle and manages the relationships between these systems. It’s main function is to serve as the authoritative source on the relationships and our key identifiers across these systems.
The asset registry
The next question is: What do we use for this asset registry?
We already saw the challenges with a relational model, but imagine what would happen if we tried to add even more roles, recipes or videos. And the queries we want to perform are not well-suited for a relational database because they rely on relationships (i.e. what recipes, people, producers or participants are associated with this food channel show?) These are the types of questions that we need to ask and answer every day.
Our first attempt at an asset registry involved an LDAP database:
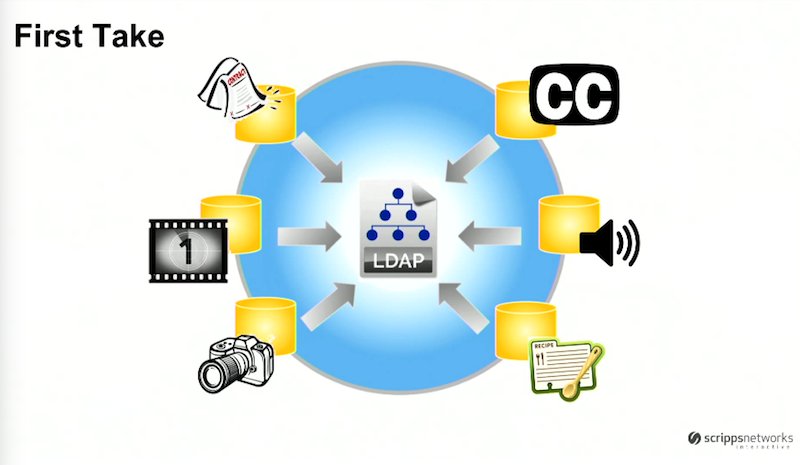
It handled large data sets and performed fast reads, but we encountered significant operational and business challenges.
Our business was continuously evolving and changing, but our LDAP database didn’t have the corresponding schema flexibility we needed. We saw the emergence of a non-linear schedule of shows with the development of on-demand, and also had to change our distribution model based on the emergence of social media and micro-networks. Given this increasing complexity, our LDAP model wasn’t working for us anymore.
In 2014, we rebooted our asset registry and started mapping relationships with Neo4j:
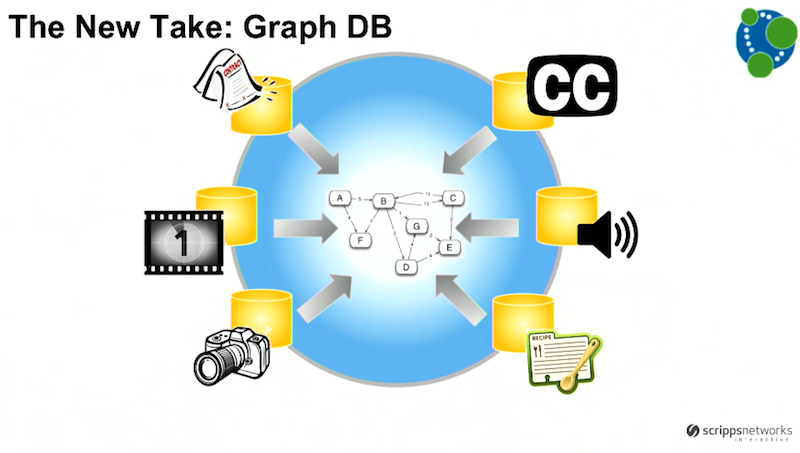
We needed to be able to easily add new asset types like short-form video, as well as new relationships. It was important for our new model to be able to map collections of short-forms that shared different aspects, and we needed to be able to quickly and easily query that relationship data.
The graph topology
Brant Boehmann: After we transitioned everything over to Neo4j in 2014, once all was said and done, we had a very medium-sized graph with about 10 million nodes.
Today, we have about 43 million nodes. Our read-write ratio is about 400 to 1, and our transaction volume is between 3000 and 8000 requests per minute. Our Neo4j query times remained at just above two milliseconds per request, even after we grew to 43 million nodes.
Below is the topology of our graph, which we run in AWS:

Our model has the following characteristics:
- Cluster of three
- HA mode
- Database runs on EBS volumes on EC2 instances that are m4.2xls, which are fairly moderately sized machines with 32GB of ram.
- 8GB JVM heap
- 20GB page cache
Interestingly, we run two load balancers in front of this: both point at all three nodes but use the HA endpoints on the graph database to tell us which one is the master and which ones are the slaves. This is important because we direct all of our writes to the master, and we direct all of our reads to the slaves.
Below is the metamodel of our graph, which is extremely simple:
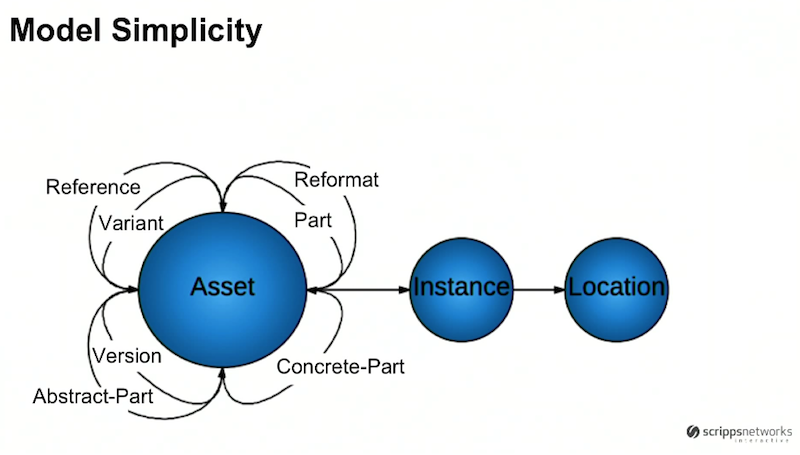
We have assets, which relate to one another in one or several different ways. Each of those assets have instances, which are really just some representation of the asset.
The asset is a file that represents a piece of intellectual property, which could be an mp4 video, an XML recipe, a .pdf recipe or .jpeg image. We track the location of where that file lives globally, whether it’s on-premise in our headquarters in Knoxville, Tennessee or in an S3 bucket.
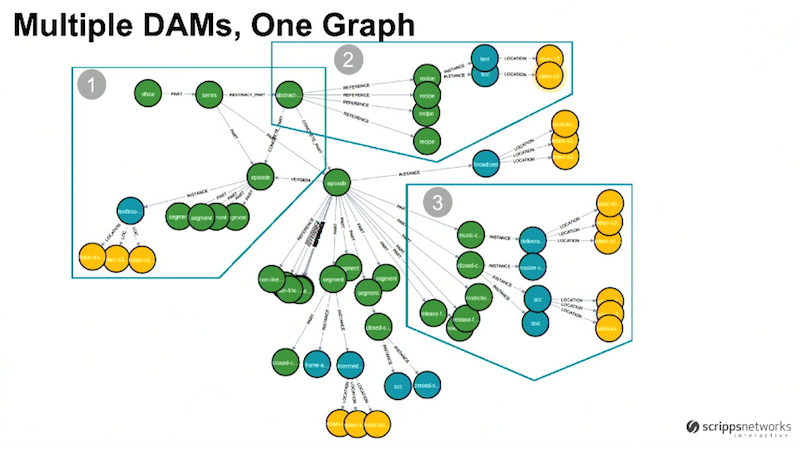
Below is a small snippet of our graph, which represents our actual data:
Each of these nodes comes from different DAMs that are registering them in.
Let’s zoom in on the first section of this graph, which shows broadcast video:
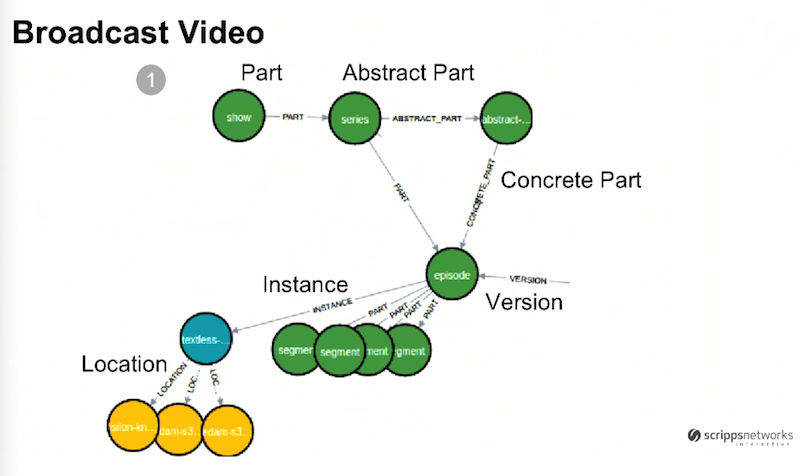
As we mentioned above, we have a linear scheduling model with specific shows airing at specific times. The green node on the top left represents a show like Fixer Upper or House Hunters. We refer to each season of that show as a series. Closer to the center of the graph we have an episode, and each of those episodes has segments.
Based on this graph, it’s easy to see that all of these components are related as part of a chain.
Over time, we started creating different versions of episodes due to the introduction of HD and the emergence of new platforms like social, which is what the incoming “version” relationship refers to. At the top right we added the abstract node, which groups all the different episode versions together and provides us with a way to easily license all of these episodes internationally.
This would have been extremely difficult in our inflexible LDAP model. The ability to dynamically add relationships based on business need is the real power that a graph database provides us.
The second section of this subgraph illustrates some of our recipes:
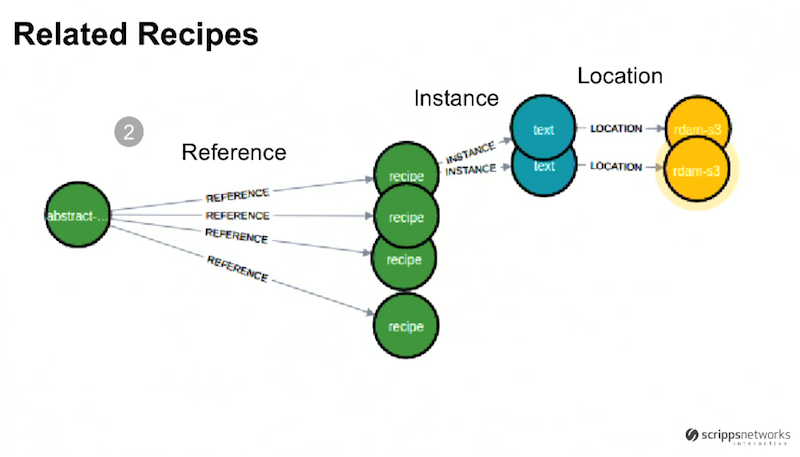
The center four green nodes are recipes. The top recipe has a few instances, which could represent XML or .pdf versions of this recipe. Both of these are located in an S3 bucket, and there’s a reference relationship between the abstract episode on the left and the recipes in the middle. This provides us with the ability to track which recipes are related to which episodes.
Our third image shows another DAM:
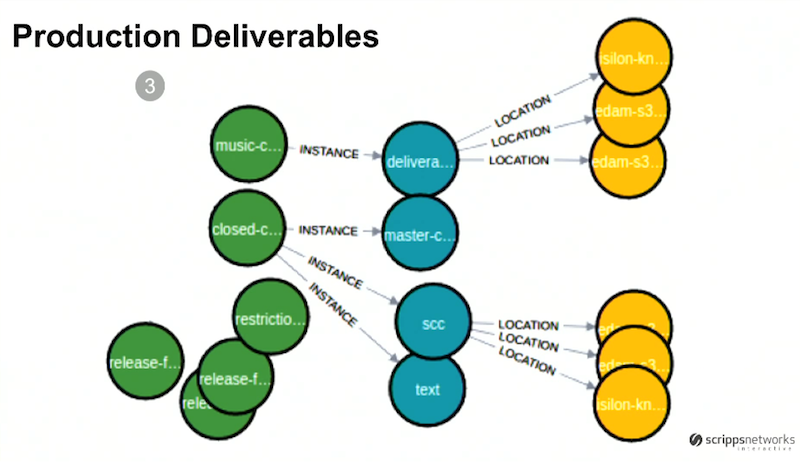
The green circles are our assets and the blue circles are the instances of those assets, all of which also relate either into concrete or abstract episodes, shows or series.
Our first broadcast video subgraph above represented linear content, which worked for us when we only aired our content linearly. But now, people can turn on their TV and specifically request what they want to watch on demand. They can select which specific clips they want to watch on a variety of different social networks.
We’re shifting more and more away from a linear model towards a non-linear model, which is why we now produce distinct content for each of those non-linear channels.
The following example walks us through the flexibility of our data model:
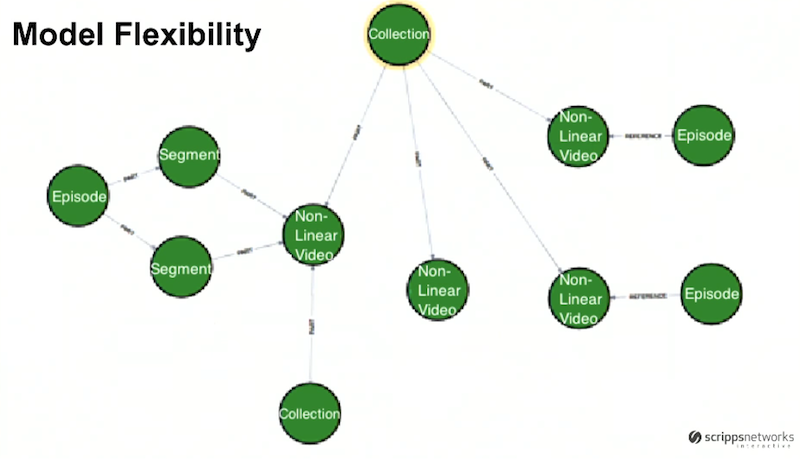
All of the following episodes are part of a collection of nonlinear videos, which allows us to bundle this content with a unique SKU and sell it to one of our many partners.
We have an episode node on the left, which is related to two segments. Directly to the right of those segments is a non-linear video, which is tied to the segments with a “part” relationship, which could potentially represent the creation of a new video for distribution on a non-linear channel.
We have two more episodes on the right-hand side of the graph, but they relate to the adjacent non-linear video node with “reference” relationships. This relationship type indicates that the non-linear video could be something like an outtake or blooper from the production company.
And finally, at the center of the graph, we have a non-linear video, which doesn’t have any relationships to other episodes in the graph.
The benefits of Neo4j
Neo4j provides the right abstraction for the problem we were trying to solve. Our assets are related to one another in a graph, and it was far too complicated to try to model this relationally.
With the Cypher query language, Neo4j also provides us with a high degree of simplicity. This terse syntax is extremely expressive and easy to use and understand.
Let’s explore the following example query, which is related to an internal application that plays our videos:
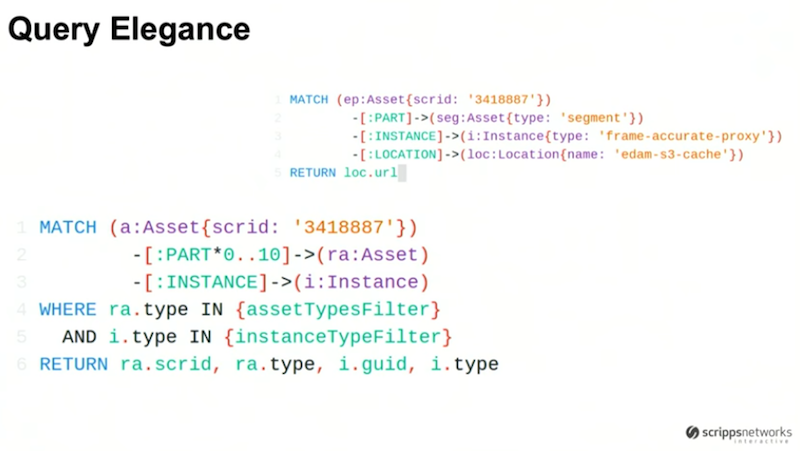
We create low-resolution versions of our videos, called video proxies, which are the same aspect ratio and timing as our episodic or non-linear content. An internal application plays these various video segments so people can perform QC or identify particular content.
In the top right, we’re querying to find an asset with a specific scrids identifier and all the video segments with the instance type “frame-accurate-proxy” that are located in the EDMS-3 cache. Through this very simple query, we are able to pull back the URLs for those locations and feed them into the video player.
On the bottom left we have another query, which is particularly useful when we’re delivering content to partners like Hulu, Apple or Google.
Often we send production deliverables like recipes, photos or music cue sheets to accompany our videos. This query traverses down through all the parts related to any particular asset at the show, season or episode levels up to 10 levels deep. We then filter that by any asset or instance types that we might be contractually obligated to deliver, and can easily bundle all of those assets together to send to our partner.
Summary
Our business uses a collection of DAMs with a best-of-breed approach that is led to a mixed ecosystem of COTS, SaaS and homegrown. Our systems weren’t orthogonal, and our business required interrelationships between the DAMS for our different use cases. Operational challenges led us towards a graph model through Neo4j, which provides us with modeling flexibility and simplicity, as well as query elegance.
Share Article


Explore
Related Articles
Hybrid Search in Neo4j: Full-Text, Vectors, and Graph Topology with Cypher


Hey LLM, you’re using OPTIONAL MATCH wrong. Here’s the Cypher that actually works.