
Who Cares What Beyoncé Ate for Lunch?

Senior Vice President of Economic Research & Analysis
7 min read
Editor’s Note: This presentation was given by Alicia Powers at GraphConnect Europe in April 2016. Here’s a quick review of what she covered:
–
I’m a data scientist from New York working in public policy, and today I’m going to go over the first project I did with Neo4j — which I also did using R: a food recommendation engine to improve peoples’ health:
When I was first looking to start the project, there were three things I wanted to end up with: a data model that was easy to understand, the ability to easily explore data and glean new insights, and the ability to generate high-quality recommendations.
The Project: Global Obesity Epidemic
The project first started in response to the obesity rate in the United States:

The above graph shows the percentage of the population that has a body mass index over 30, which classifies a person as obese. The United States is the top line followed by England, Spain, France and South Korea. As you can see, there has been a pretty consistent upward trend — which is happening in most of the developed world — and doesn’t seem to be changing. I was inspired to do this project to better understand food and its connection to health.
The Dataset
As a data scientist, I was also motivated by data — and there is a lot of great data made available by the United States Center for Disease Control and Prevention. Every year they conduct a survey called the National Health and Nutrition Examination Survey to try to understand how the foods people eat relate to their health.
For this project I used the most recently updated data I could find, which happened to be from 2012. This particular data has over 9,000 people that range in age from one to 80 and tracks all the food and drink these people consumed over the course of two days:

The data provides demographic information about each person as well as what, how much and where they ate, as well as when they ate it. The data includes over 5,000 different types of foods, 4,000 food characteristics, and 90,000 meals. With 9,000 people over a period of two days, this indicates that each person is registering an average of ten eating situations, also known as events.
Connecting the Data
I wanted to know how all of this data connected. I could have done this in SQL — I knew what I had to JOIN, as well as which standard statistics and analytics to use for the project. But I wanted the data to look different and be more easily accessible, which is where Neo4j comes in.
Below is the graph data model I developed, which is both extremely accessible and provides a way to easily make recommendations:
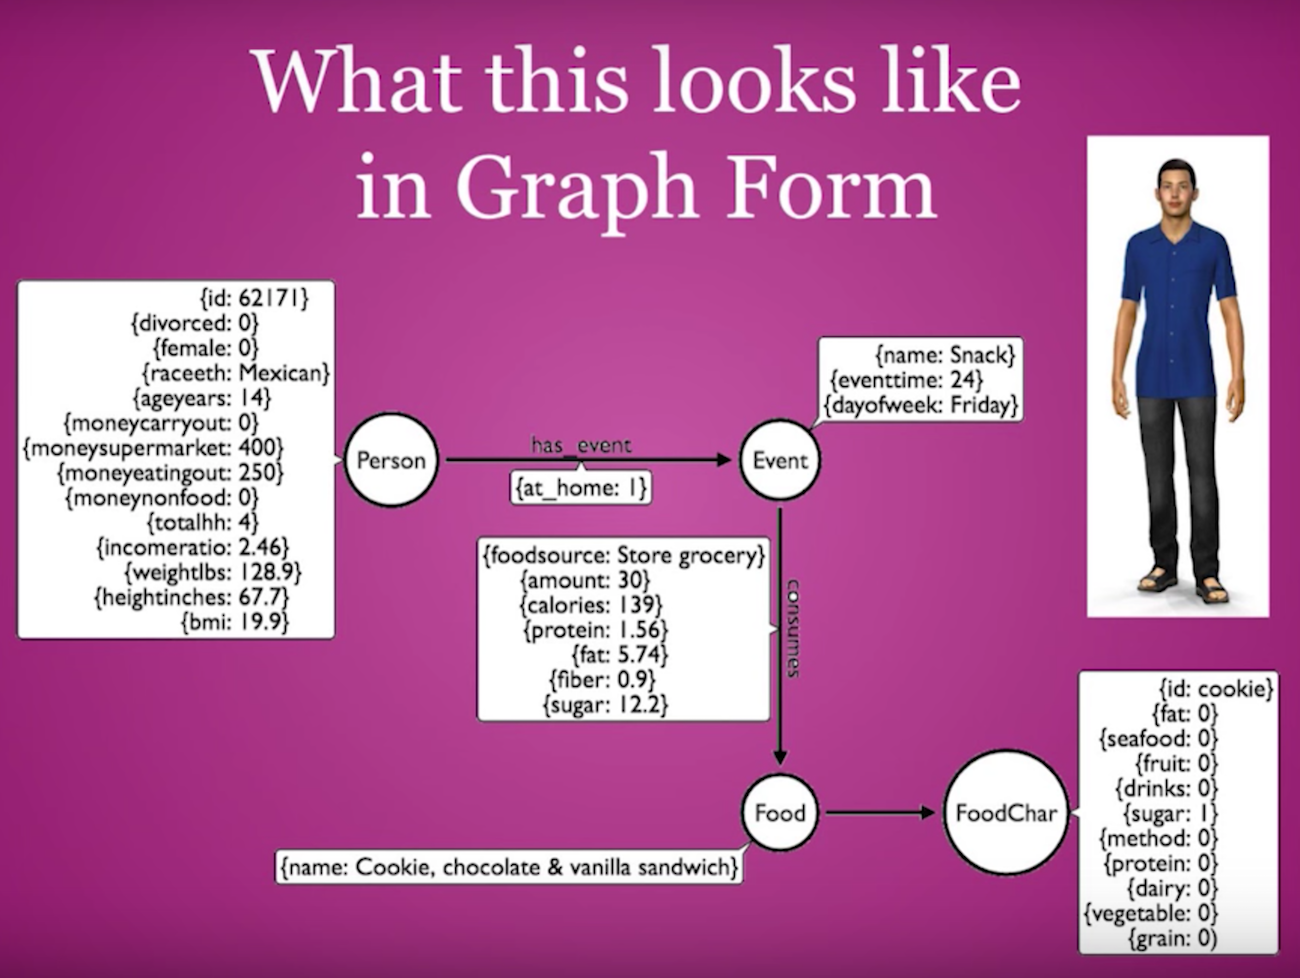
On the left we have the Person node along with a rich set of characteristics that includes gender, race, ethnicity, age and BMI, along with where they spend money on food. This person is related to an eating event, indicated by the Event node, which happens at a particular time and place. This particular event represents a snack that this person ate in the 24th hour — midnight — on a Friday at home. He consumes food, which is a cookie that was chocolate and vanilla. We know where it came from, its nutritional information and how much he ate.
While the CDC dataset did include the type of food, it didn’t include the information contained in the The Food Characteristics node in the bottom right of the slide. I wrote some code in R to parse the name cookie, chocolate, and vanilla sandwich; assigned characteristics using a bag of words; and used Neo4j to incorporate it into the system. I then tagged different foods with different elements. Take sugar, for example, which I assigned to foods such as cookies, pies and cakes. It was rather crude and I did it very quickly, but it yielded good results.
Ladies who Lunch: An Example
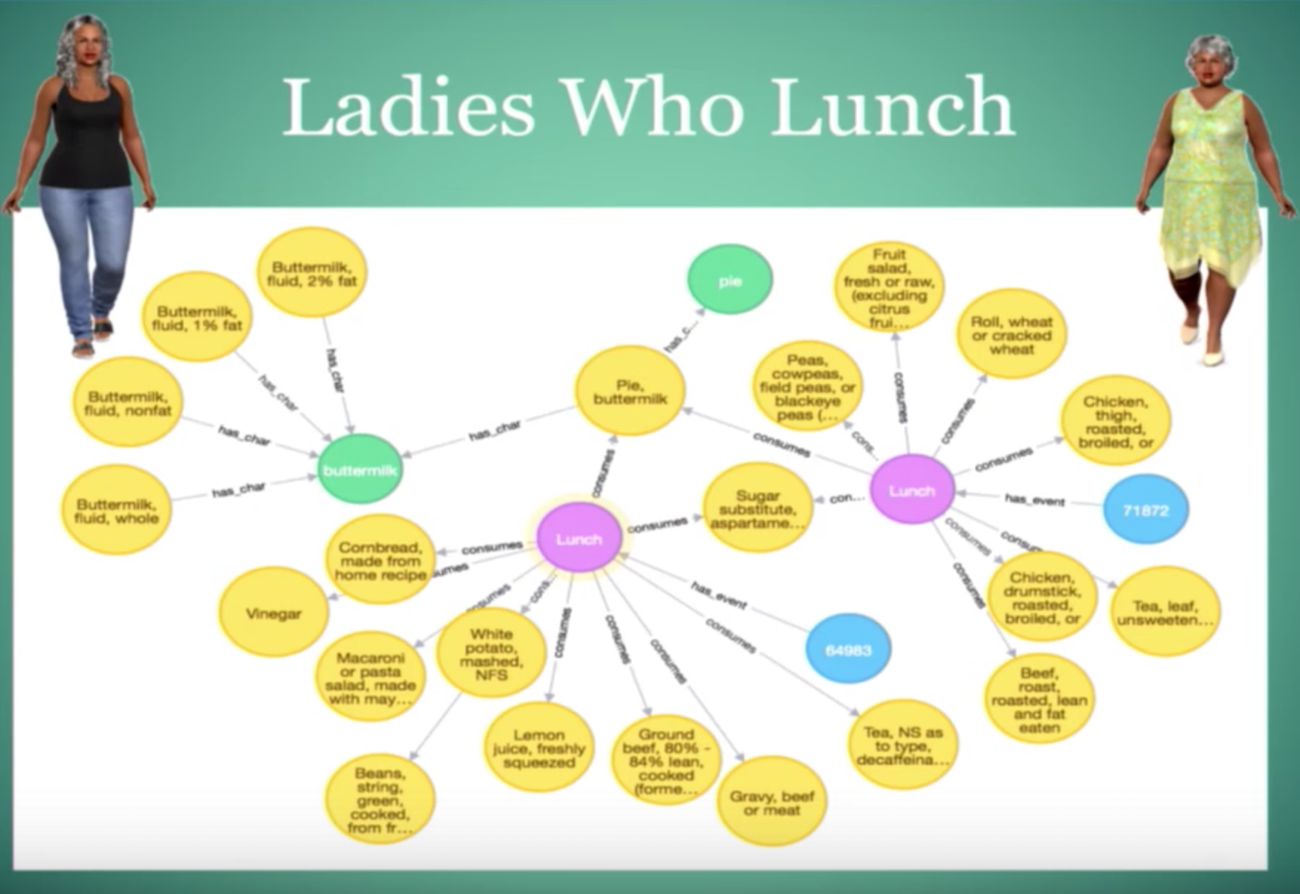
Let’s take a look at what the data looks like in Neo4j. Below is data from two women having lunch:
The blue nodes indicate the women, each of which have a connection to the “lunch” event. If this were a live demonstration, I could mouse over each event and see where they were eating, which happens to be out at a restaurant. They both eat different things except for this buttermilk pie, which they happened to share.
You’ll notice that this graph also includes the food characteristics represented by the green nodes — the pie and buttermilk — which provide a way to link to other food. In this case, buttermilk links to actual buttermilk, buttermilk with 1% and 2% fat, and buttermilk with no fat. In other words, this characteristic helps connect different types of food together.
Verifying the Data Model
Because the CDC data we’re working with comes from the United States, we’re going to focus on the obesity trend in that part of the world. The first question you ask as a data scientist is, “Does my data actually represent this world that I think I’m modeling?” To answer this, I did something very simple — I looked at the top foods and drinks consumed by the people in this dataset:

The good news is that people drink a lot of water. But what about the raw lettuce and tomatoes? While at first glance this might seem to indicate that people are eating a lot of salad, we did a market basket analysis to look at the meals and combinations of food people eat together. It turns out that people are primarily eating lettuce and tomato as part of their hamburger or sandwich.
There’s a similar pattern with coffee and sugar — people are putting sugar in their coffee. Ketchup is normally associated with some kind of fried food, and then we have white rolls, colas, bread and mayonnaise. In looking at this information, we get a sense that we are probably looking at the right dataset associated with not-so-great health.
The Key Components of a Recommendation Engine
In the United States, 108 million people identify as being on a diet or working towards losing weight. It’s an $80 billion industry; between celebrity diets, diet books, drugs and surgeries, Americans are investing a lot of money in losing weight. And based on the obesity trends, it may not work out as well as one would hope.
As a data scientist I wondered if there was a technical solution. And while I was thinking about this, Boyonce came out with her own endorsed diet called “22 days.” I’m a big Beyoncé fan, and if it would be possible to look like her in 22 days, I figured I would give it a try.
The plan includes food that is 100% organic and plant-based without soy or gluten, and purports to come in delicious, perfect proportions. This is very different than the way average Americans currently eat, so the thought that this would apply to everyone is a bit of a stretch. A one-size-fits-all approach probably isn’t going to work because we’re all individuals with our own wants and needs. Understanding this is important when considering recommendations.
To make sure we could provide good quality recommendations, I took an approach that looked at eating in the U.S. in three phases: accessibility, nutrition and pleasure. With accessibility, if you work ten hours a day, it’s unlikely that you’re coming home and having a home-cooked meal. Instead, you’ll go out and have a convenience meal or something at a restaurant. Nutrition is also extremely important, but so is pleasure. Especially in the US, our food is very much marketed towards enjoyment and pleasure. This will need to be integrated into a good food recommendation engine.
Personalization vs. Customization
A lot of times when people talk about recommendations, they’re really talking about personalization:

They’re taking user data to try and make a prediction, often times based on similarities. Customization is a little bit different and is where the user gets to provide inputs and have some control over what is recommended to them.
Next let’s explore recommendation algorithms:
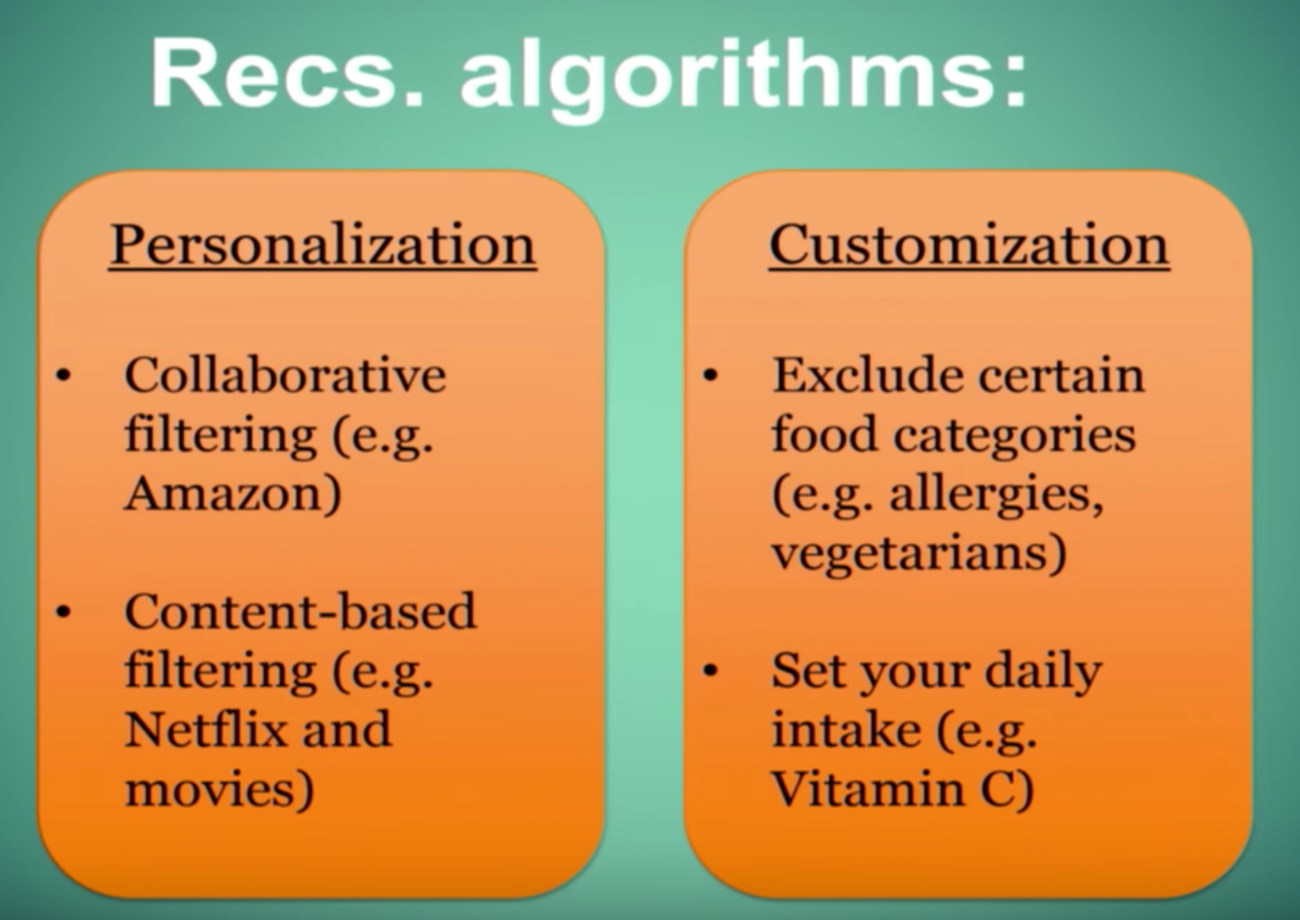
On the personalization side there is a lot of collaborative filtering. If you’re not familiar with this idea, think about Amazon which uses your likes of certain things along with another person who likes similar things, and then provides you with recommendations of what that similar person has bought. This can also work in the food space: if I like certain foods, and this other person likes the same foods, it’s very possible that we’ll like some other similar types of foods.
Another approach in personalization is content filtering, which is less about the people and more about the content. A good example here is with Netflix, which uses the characteristics of certain movies and TV shows to make recommendations. For example, if you like movies based on comic books, Netflix will provide other movies in that genre. This also works in the food space as it relates to food characteristics. If someone likes spicy food, recommend more spicy food; If someone likes crunchy food, recommend more crunchy food.
Where recommendations in the food space sets itself apart from those in other realms is the need for customization. Sometimes you have to exclude certain food categories because someone has allergies or they have made a choice not to eat certain types of food (i.e. meat). And there are things you may not be able to see in the user data that you probably need to know in order to make a quality recommendation. Additionally, people will want to be able to customize their daily intake. For example, if everyone in your family has a cold, you might decide to increase your intake of Vitamin C. If you put that in the recommendation engine, it will return foods with high contents of Vitamin C.
The winning combination for this tool is really part personalization and part customization. This recommendation tool is designed to help people change their behavior and make healthier choices. When personalization works, it seems like magic: “It’s amazing, you know me so well.” And the customization allows the person to be a co-creator in the process, which is an important psychological component
Using the Recommendation Enging to Change Eating Behaviors
Now let’s dive into the Neo4j example. First I need to answer the question, “Who needs help?” In this huge dataset, how do I identify people who might be helped by using some sort of recommendation engine? Again, the focus is on simplicity, so to do this, I decided to find the people who consume very few vegetables (less than two instances in two days) and a lot of sugar (more than nine instances in two days). This query is represented below:

This has returned an individual with a BMI of 40 who had one vegetable instance and ten sugar instances over two days. Below is a graph with all of his food instances, with him at the center:

Laying out this data in a graph pointed out a key insight: he has breakfast and dinner on both days, but no lunch. Outside of meals, he eats a mixture of snacks such as cookies, Kellogg Special K bars, nuts, and popcorn. The recommendation for him is very simple but high quality: eat lunch every day. It was immediately pretty clear that Neo4j could easily provide data insights.
Let’s turn back to the question, “How do you change eating behaviors successfully?” The best way to do this is through a series of small changes. By making the small change of eating lunch, this will get him closer to healthy eating. Remember the three important features in our food recommendations: accessibility, nutrition and pleasure:

Because this man eats a lot of snacks, we can assume that he isn’t at home during the day, which means we have to recommend a portable lunch solution. Lunch for the average adult male should be about 600 calories, so we’ll recommend food in that range. And to meet the pleasure component, we’ll find people who like similar foods but who also happen to be healthier.
Again, the winning combination is personalization and customization. This man wants to eat like people who are healthier than him but who also share food preferences. On the customization side, he needs a solution where he can eat this food when he’s not at home and is less than a certain number of calories.
Performing the Personalization Query
Let’s explore the personalization query first:

Now we want to find people with lots of food in common with this man but who are healthier. This particular individual has six foods in common with our original individual, and over those two days they ate six foods in common. The first number you see, 604, is how many instances of different foods he ate. I also looked at how many calories they consumed in these foods. You’ll see that the guy who is unhealthy ate an average of 600 calories per meal while the healthier guy ate an average of 476 calories per meal. While these things aren’t directly comparable statistically, it’s a very simple concept to explain.
Now we can provide some lunch recommendations, which is where the customization comes in. In the below example we have a man who eats cookies and special K bars, but he has lunch that’s under 600 calories which he gets at a convenience store:

We end up with a lunch recommendation that includes a hot dog, some coleslaw, mustard, mayonnaise, and a caffeinated soft drink. While this is probably not a meal a nutritionist would recommend, it’s healthier than what the first man was originally doing and he’s probably willing to accept the recommendaiton, which will bring him closer to his goals.
How to Eat like Beyoncé
This is an overview of the proof of concept I conducted to determine whether or not Neo4j could provide an accessible model that would provide insights and act as a high quality recommendation engine. To me, it’s clear that it does so very well. But to make something production-ready that people will actually want to use, we need more data points. Right now I only have two days of information on a certain subset of people.
We also need a feedback loop. I need to know that the recommendation that I’ve made to someone is actually something they might do, whether or not they actually do it, and whether or not it makes a positive change. More types of data points, such as lifestyle and sleep, would also be helpful.
That being said, there are also a number of possibilities. Let’s go back to Beyoncé’s diet. Even within the structure, I could probably help someone get closer to the Beyoncé lifestyle by customizing recommendations. I can write a query that searches for all types of meals that don’t have meat, gluten or soy and that returns some foods that are organic — such as 20 or 30% — because organic food is expensive. And you can also add the personalization aspect:
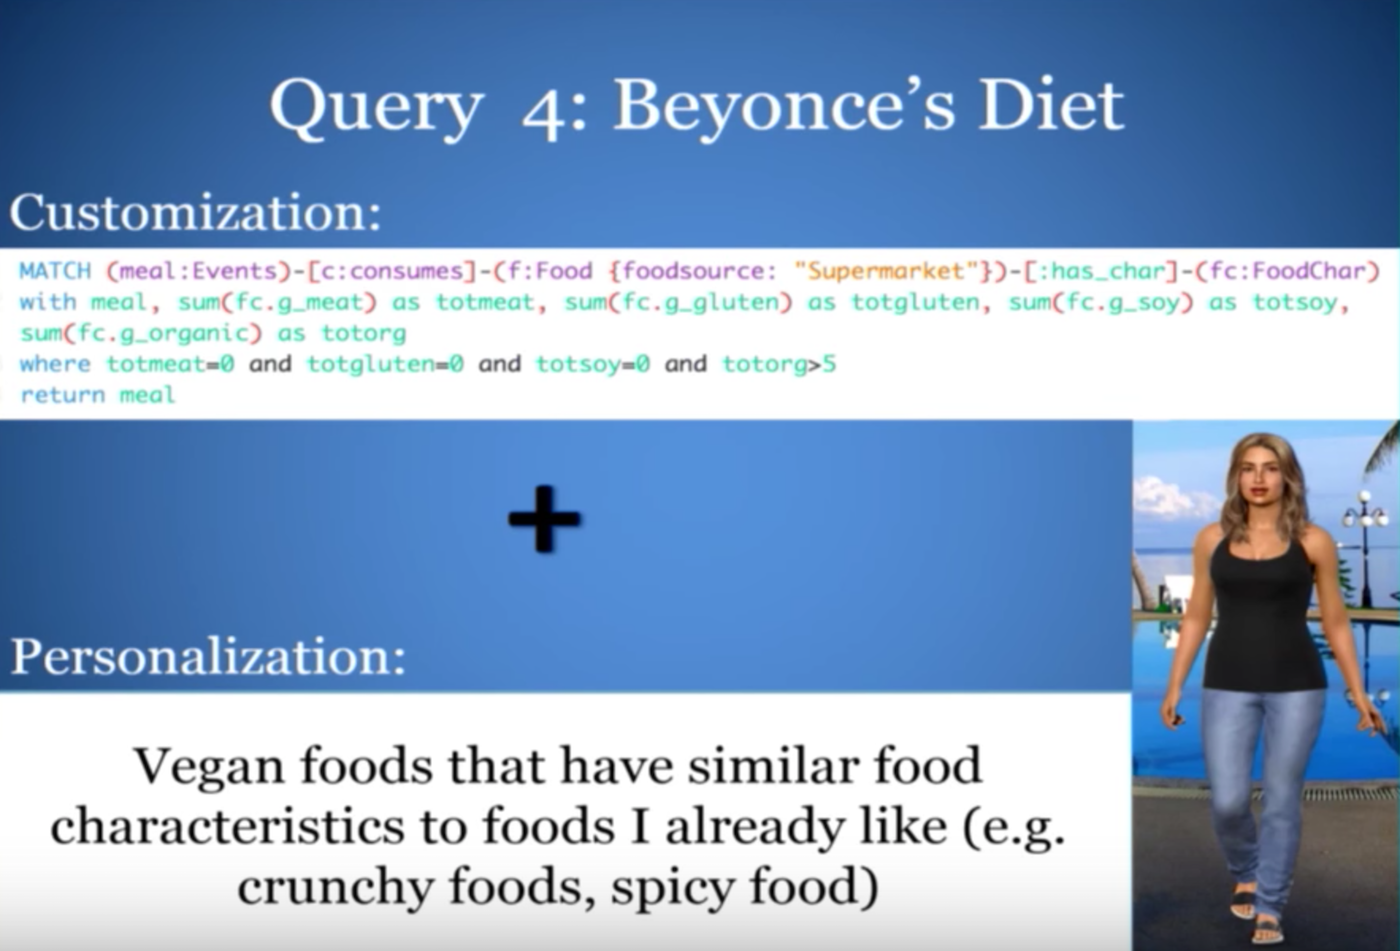
We also might be able to recommend some vegan foods that have similar food characteristics to the types of foods you like, such as crunch, that would make food substitution a bit easier.
It’s clear that there’s power in this connected data, which is made possible by using Neo4j. It allows us to understand how people truly eat, and then make recommendations that are actually helpful.
Share Article


Explore
Related Articles


How to Improve Multi-Hop Reasoning With Knowledge Graphs and LLMs


