Charting Neo4j 3.0

Head of Product Innovation & Developer Strategy, Neo4j
7 min read
Chart, Not Graph
Today I want to show you how easy it got with Neo4j 3.0 to pull data from the graph into your JavaScript code and for instance create pretty charts from it.
As you probably know, we people at Neo4j really want to discern graph
from charts.
It’s too easy to mix the two up in spoken language and the term “graph paper” doesn’t help.
If it’s a chart like a bar, pie or line chart then it’s not a graph but a visualisation of data across multiple axes (mostly two axes, typically x and y).
Fortunately the creators of chart.js didn’t call their impressive JavaScript “not graph.js” 🙂
How Did We Get Here
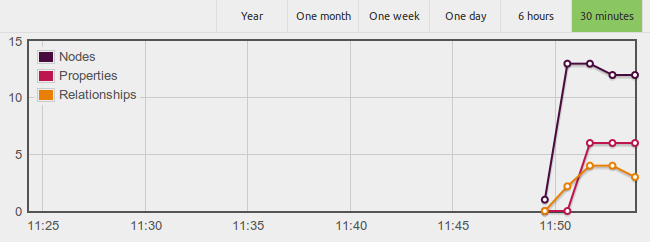
Some of you might still remember webadmin our first web-based Neo4j interface which was pretty awesome for its time and had a number of cool features. One feature many people loved but left everyone confused was the chart at the beginning showing the growth of data volume (nodes, relationships and properties) in your graph over time.
That’s especially nice to see progress when your importing data or have your production app running.
But it was also confusing because it didn’t actually show the counts of entities but the total storage file size, which can contain empty segments if you delete data. So people were always wondering, “Why does this thing grow (or at least not shrink), when I actually delete data?
Or why doesn’t it grow when I create data?”
With Neo4j 3.0 we finally removed webadmin (RIP) but there are still a few things missing in Neo4j Browser.
New Features
As there are some cool new features which come together, I thought it would be nice to give people back the charting of graph data volume while also combining those nice new features:
- Fast Entity Counts
- User Defined and Built-In Procedures
- Binary Protocol
- Official Drivers (incl. JavaScript)
Fast Counting of Entities
With Neo4j 3.0, we provide counts of entities from Cypher no longer by actually counting them but by inspecting our transactional database statistics. Many databases have database statistics, but few keep them transactionally up to date in order to always have accurate and reliable counts.
So now when you issue Cypher statements like the following, you’ll get the results back in milliseconds.
MATCH ()
RETURN count(*);

MATCH (n)
RETURN count(*);

MATCH (:Person)
RETURN count(*);

MATCH ()-->()
RETURN count(*);

MATCH ()-[:FOLLOWS]->()
RETURN count(*);

MATCH (n)-[:LIKES]->(m)
RETURN count(*);
Built-in and User Defined Procedures
Calling procedures from Cypher is another really cool feature in Neo4j 3.0. You can use the built-in procedures to get information about procedures (how meta), indexes, constraints and entity meta information like labels, relationship types and property-keys.
CALL db.relationshipTypes();

// integrated call
CALL db.labels()
YIELD label
RETURN label
ORDER BY label;

CALL dbms.procedures();

// complex call, list procedures by package
CALL dbms.procedures()
YIELD name
WITH split(name, '.') AS parts
RETURN parts[0..-1] AS package, count(*), collect(parts[-1]) AS procedures
ORDER BY count(*) DESC;
It’s much more fun to write your own procedures or actually to contribute to the large collection of procedures we created in the APOC procedures community project. But I digress.
So we can use the built in procedures to get information about labels and relationship types. Nice! Combined with the counting queries, we can not only get total counts but also fast counts by label and relationship type.
Binary Protocol and Official Language Drivers
The next big thing with Neo4j 3.0 is our binary protocol – Bolt – which is based on PackStream, an extension of MessagePack.
With the binary protocol, we also provide officially supported drivers for .NET, Python, Java and JavaScript (detailed documentation) which are all Apache v2 licensed and can be found on GitHub.
Our awesome contributor community also provided Bolt drivers for PHP (thanks to Christophe) and is working on versions for Ruby and Go.
To integrate with chart.js, I just needed the JavaScript driver, which works both with node.js and in the Neo4j Browser. It’s available via Bower and NPM.
Goals
I want to provide an auto-updating chart of all the nodes in total and by label as well as the relationships in total and by relationship type. Also, the user should be able to run free form queries to be charted.
The source code is available under the MIT license.
Implementation Database Statistics
I haven’t used chart.js before and my JS skills are pretty bad, so bear with me. Here are the basics of what I did: I pulled all JavaScript libraries and CSS files from their CDNs. For the Neo4j Javascript Driver, I used the CDN of rawgit. So I actually don’t need Bower or any other hipster JavaScript build setup that downloads a Gigabyte of stuff onto my disk.
These are my dependencies:
- neo4j-driver
- Chart.js
- JQuery
- Bootstrap
I started with a basic bootstrap template and added a bunch of form fields and a button for the database connection, refresh frequency and to toggle the auto-updating.
I just followed the tutorial for chart.js starting with a <canvas> element that’s turned into a line chart. For the statistics view, I wanted to use a logarithmic scale for the counts and a time scale for the measurements.
Here are the steps that I do:
- Button is pressed
- Get the URL and password from the form fields
- Instantiate a driver with those credentials and get a session
- Use the session to query for the total counts with
MATCH () RETURN count(*)and use a promise to receive the results and update the chart with the new information - The chart updater is a separate function which I reuse for all the named updates of information that happens at the same time
- Query for all label names via the
db.labels()procedure - Create a second session and get the count for each label
- Do the same for relationships
- The chart update also includes picking a color and making sure we only display 25 results in total, moving them to the left

Here is the code:
Statistics Queries
        function stats() {
            var neo = neo4j.v1;
            var driver = neo.driver($("#url").val(), neo.auth.basic("neo4j", $("#password").val()));
            var session = driver.session();
            var session2 = driver.session();
            var d = Date.now();
            session2.run("MATCH () RETURN count(*)").then(function (result) {
                update(d, "nodes", result.records[0]._fields[0].toNumber());
            });
            session2.run("MATCH ()-->() RETURN count(*)").then(function (result) {
                update(d, "rels", result.records[0]._fields[0].toNumber());
            });

            session.run("CALL db.labels()").then(function (result) {
                result.records.forEach(function (r) {
                    var l = r._fields[0];
                    var stmt = "MATCH (:`" + l + "`) RETURN count(*)";
                    session2.run(stmt).then(function (result2) {
                        update(d, l, result2.records[0]._fields[0].toNumber());
                    });
                });
            });

            session.run("CALL db.relationshipTypes()").then(function (result) {
                result.records.forEach(function (r) {
                    var l = r._fields[0];
                    var stmt = "MATCH ()-[:`" + l + "`]->() RETURN count(*)";
                    session2.run(stmt).then(function (result2) {
                        update(d, l, result2.records[0]._fields[0].toNumber());
                    });
                });
            });
        }
Chart Update
        // from https://colorbrewer2.org/ via https://www.zingchart.com/blog/2015/12/09/color-charts/
        var colors = ['#d53e4f', '#f46d43', '#fdae61', '#fee08b', '#ffffbf', '#e6f598', '#abdda4', '#66c2a5', '#3288bd'];
        function update(time, label, value) {
            var labels = statsChart.data.labels;
            var datasets = statsChart.data.datasets;

            var title = "# of " + label;
            var insert = labels.indexOf(time);
            // new timestamp
            if (insert == -1) {
                // too many samples, remove first entry
                if (labels.length > samples) {
                    labels.shift();
                    datasets.forEach(function (ds) { ds.data.shift(); });
                }
                insert = labels.length;
                labels[insert] = time;
            }
            // find dataset
            var idx = datasets.findIndex(function(ds) { return ds.label == title});
            // add new dataset
            if (idx == -1) {
                idx = datasets.length;
                datasets.push({ label: title, data: labels.map(function(){return 1;}), borderColor: colors[idx % colors.length], fill: false});
            }
            datasets[idx].data[insert] = value;

            statsChart.update();
        }
The chart update code is a bit awkward because of the data structures chart.js uses and the way it handles updates. I spent two days figuring out a bug that was caused by initializing a new data array with zeros (1s work).
Implementation Free Query
As a bonus feature, I wanted to allow free querying (i.e., you enter a Cypher query that returns a stream of values where the first column is the x-axis value and all subsequent columns are Y-axis values). So I added that in a similar fashion.
Results
As it is only a single HTML page, I was not sure it was worth a repository, so just put it in a GitHub Gist, which I can host with rawgit.com which is a pretty neat service to host HTML/CSS/JS/JSON files with their correct mime-types. They even have a CDN.
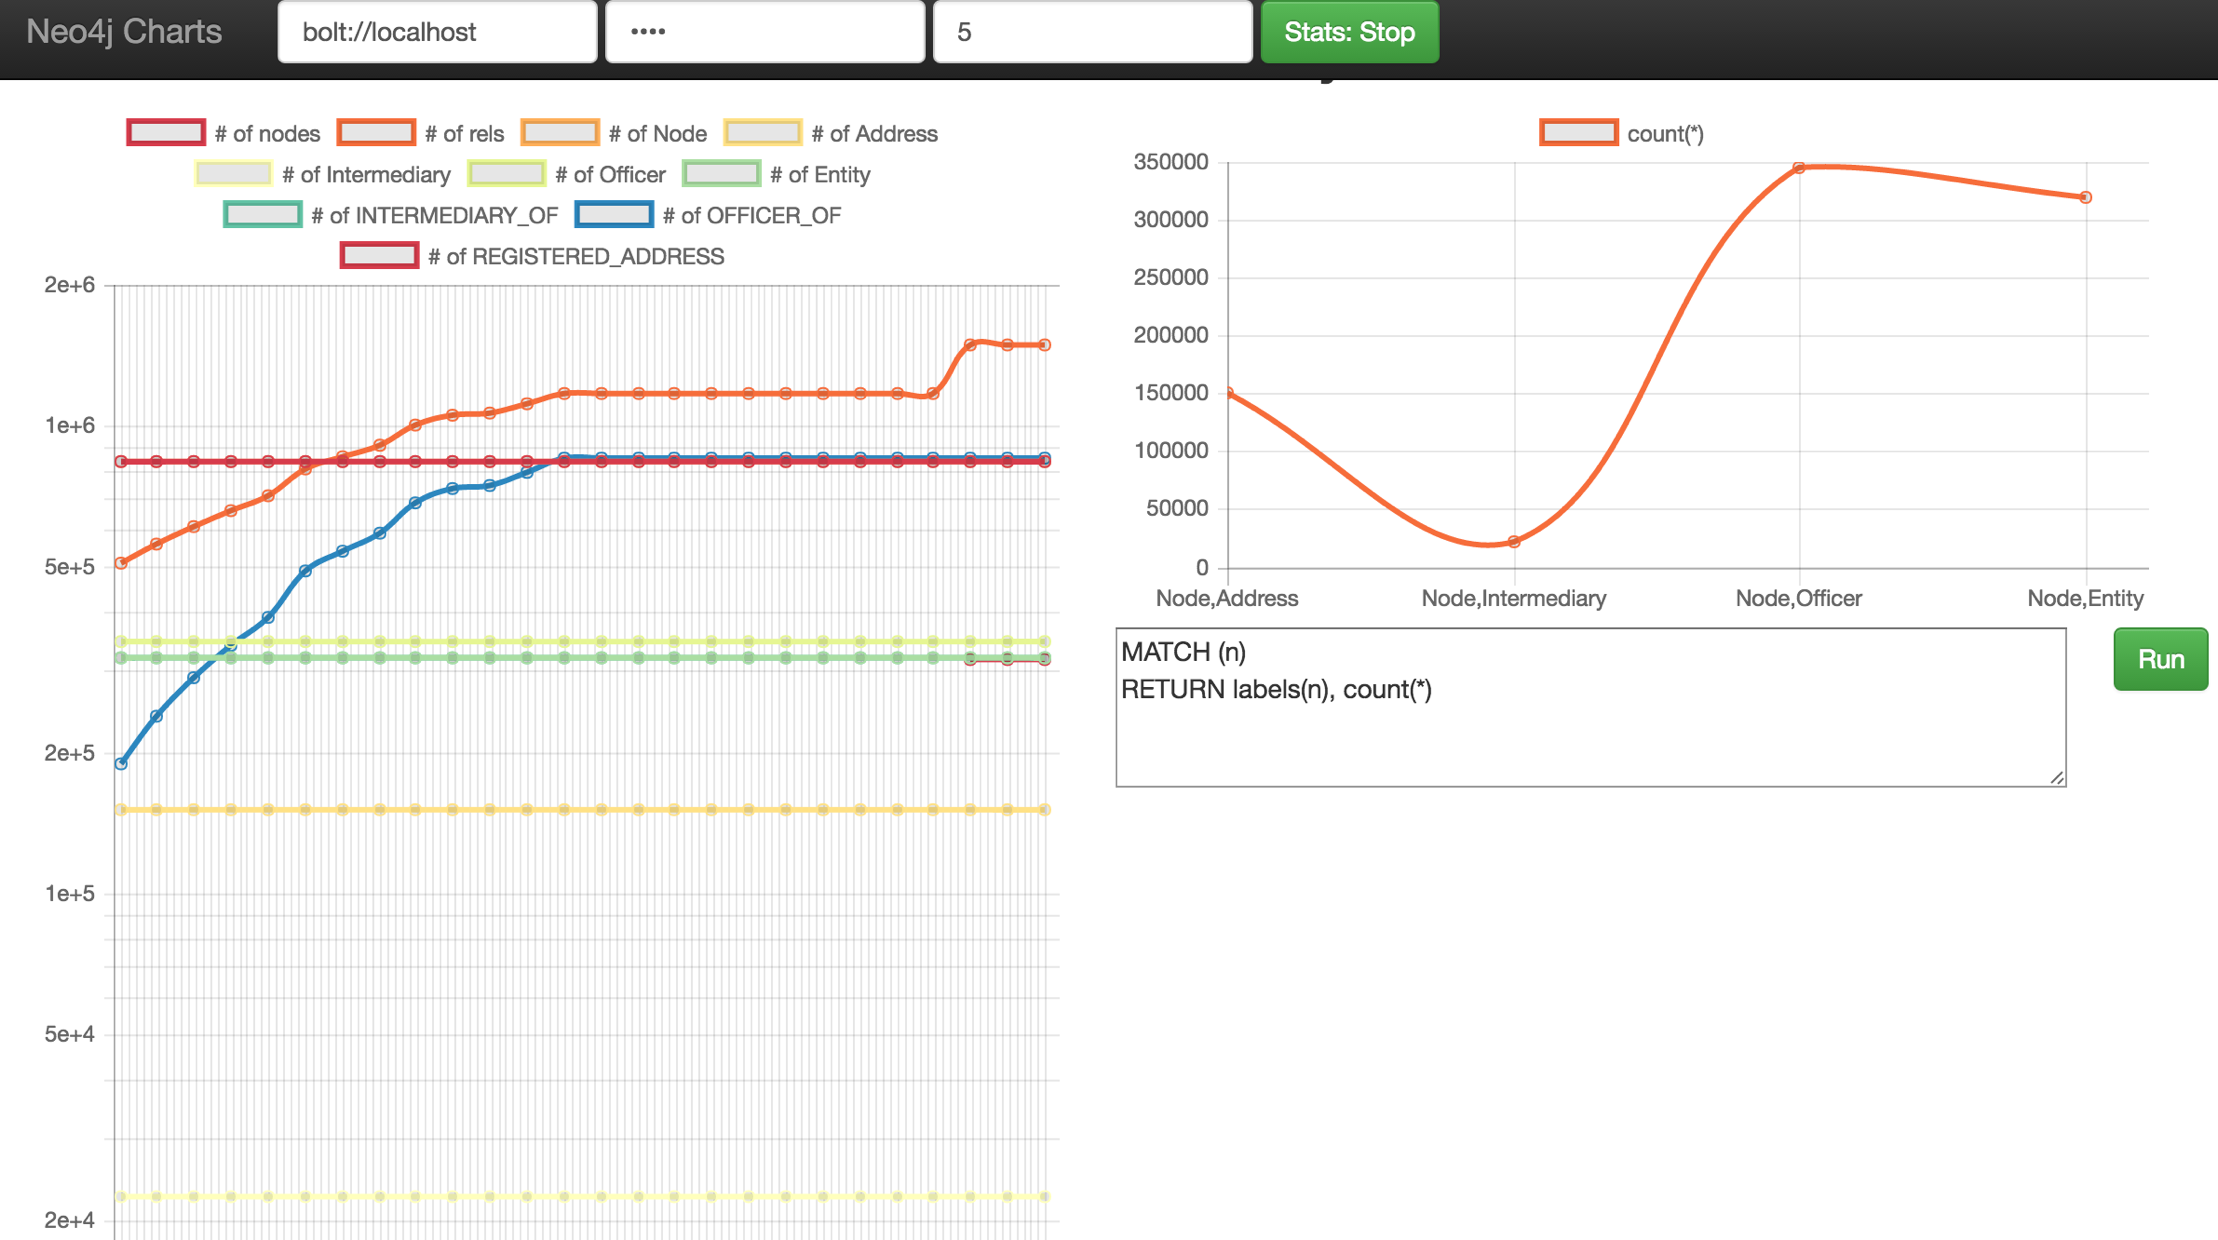
As the driver connects via websockets, there are also no CORS issues. Just provide the password and URL of the Neo4j installation you want to query, and you’re ready to go.
Visit https://rawgit.com/jexp/ to see it live and in action. The results below stem from importing a subset of the Panama Papers dataset. 🙂
Want to take your Neo4j skills up a notch? Take our online training class, Neo4j in Production, and learn how to scale the world’s leading graph database to unprecedented levels.
Share Article


Explore
Related Articles

Text2Cypher Across Languages: Evaluating Foundational Models Beyond English


Integrating Neo4j With Symfony: Profiling Queries and Centralized Logging