
Enabling the Cisco Decoder Ring with Neo4j

Technical Program Manager, Cisco
11 min read

Editor’s Note: This presentation was given by Andrew Chappell at GraphConnect San Francisco in October 2016. Here’s a quick review of what he covered:
–
What we’re going to be talking about today is the Hierarchy Management Platform within Cisco’s enterprise data services organization:
Hopefully you’ll be able to relate to what we’re doing at Cisco and end up feeling inspired by what we’re doing with our decoder ring.
What Is a Decoder Ring — and Why do You Need One?
As a typical data steward, I found three definitions for decoder ring which I melded together to create this definition: a decoder ring is a mechanism by which you can provide a mapping from one thing to another in order to translate something from cryptic to sensible.
A decoder ring really is a graph — so why don’t we just call it that? Well, if you’ve ever tried to have a conversation about graphs with a business user, you know that metaphors are very useful because it helps them conceptualize a customer’s experience from end to end.
And while every company has a decoder ring, not everyone knows the different ciphers (in this case, not to be confused with Cypher) that go into that graph. With a Hierarchy Management Platform (HMP), the hierarchies are ciphers and the decoder ring is just a collection of those ciphers.
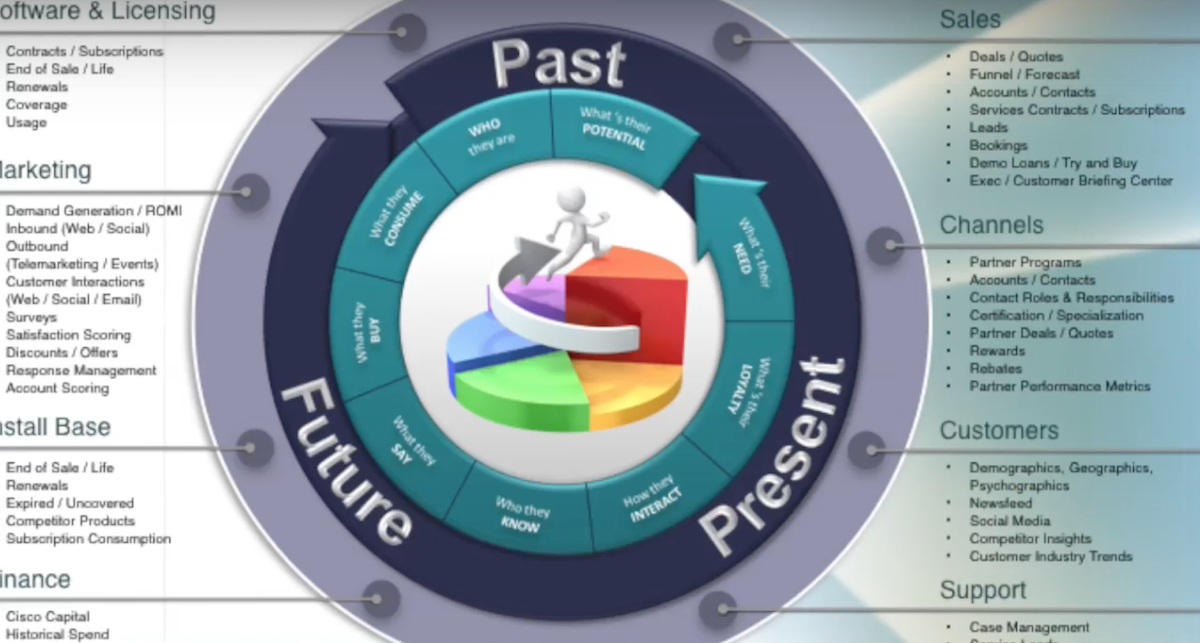
In the above image you can see how the decoder ring works: you turn one knob one way and another knob the other way and you can decode your question into an answer.
Similarly, once we started getting our hierarchies into the decoder ring — our Cisco graph — we can traverse from one type of hierarchy to others using unique identifiers: customer, supply chain, manufacturing and so on.
The Power of Hierarchy Management Platforms
Before we get into some of those examples, I’d like to go over how we developed our Hierarchy Management Platform in the first place. Cisco is both a mature company and a company that has new acquisitions almost every other month. Because of this, we’ve created a number of processes, systems, tools and policies — and in so doing, proliferated a number of hierarchies:
We have hundreds of hierarchies that include enterprise, derivative and splinter. But one of the glaring things we noticed is we had 21 different customer hierarchies and 16 different product hierarchies. We saw an opportunity to put the tacit tribal knowledge that already existed within those hierarchies into a graph.
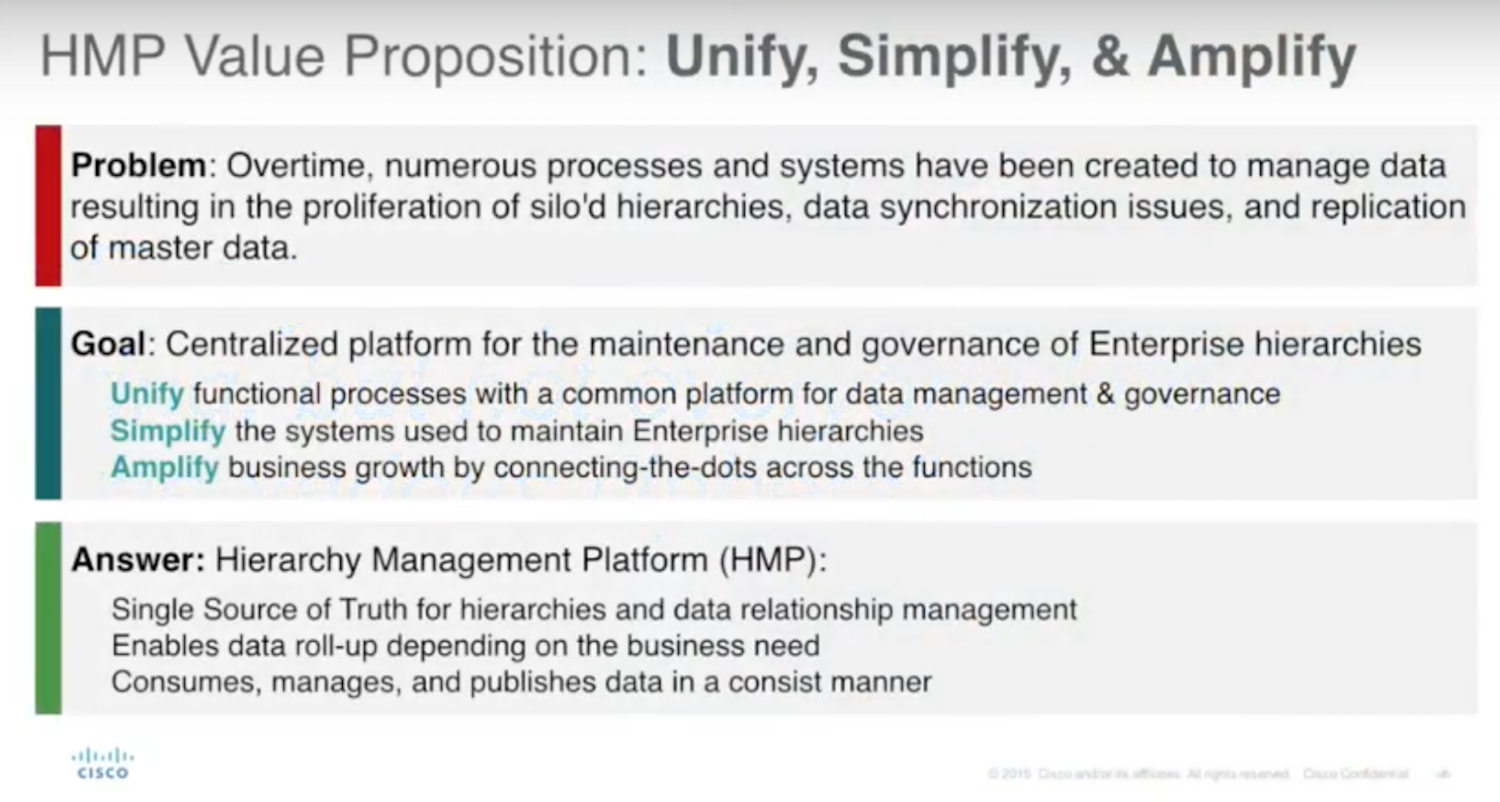
The first stage in our value proposition was to unify the hierarchies, which is where the Hierarchy Management Platform came from. The second stage was to simplify the number of systems currently managing the enterprises, and the third one resulted in the decoder ring, which amplifies business growth by connecting the dots across functions.
Something I’ve always wondered is how the team knew that putting all of these ciphers in one place, and then traversing them, would lead to untold business growth? Especially in the last year and a half, the decoder ring has allowed us to not only answer long-standing questions but has also illuminated questions we didn’t know to ask.
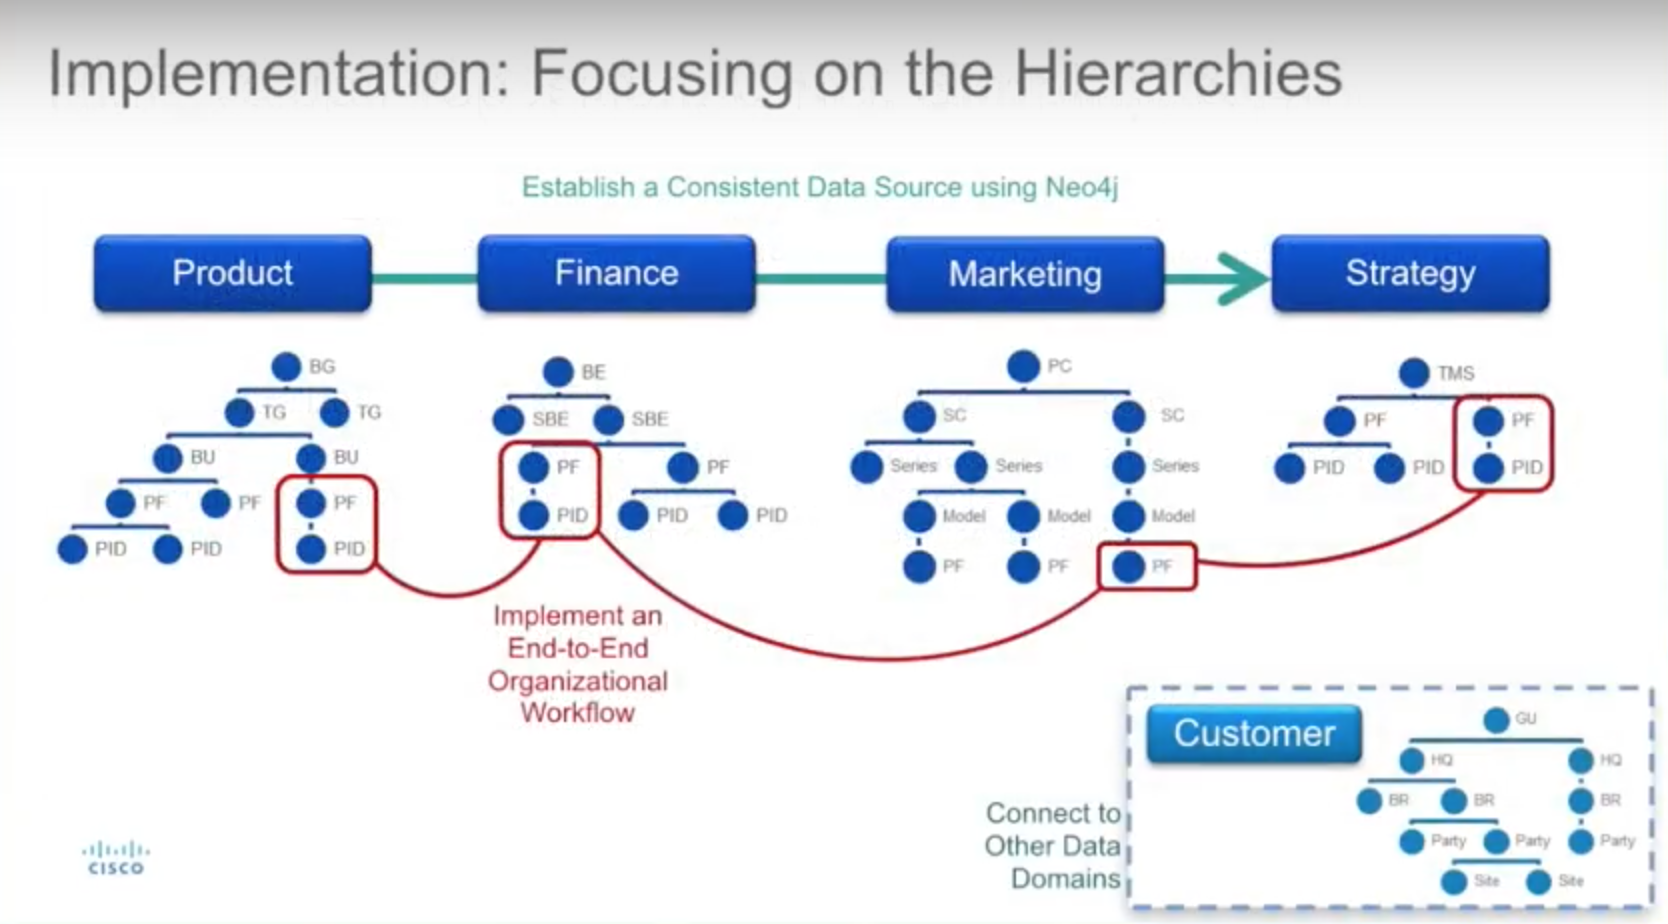
When we implemented the HMP we focused on four different different hierarchies. Each one of these hierarchies is a cipher with an associated expert:
Picking Neo4j was the easy part. Back in 2009 when we were looking for a solution, we needed something very conducive to data relationships and Neo4j was the best game in town — and still is.
While Neo4j was the easy part, the middle layer was the challenging part. Luckily, since we are a mature company, we have quite a few processes built up that are followed to a T, making us one of the best supply chain companies on the planet.
We took all of our policies and processes and put them into a system, then built in system logic and implemented an end-to-end workflow. For example, when our product development team goes through the new product introduction process, they create ten new PIDs that immediately notify finance, marketing strategy and any other team that would find that data useful.
As we consolidated these processes into our graphs — our decoder ring — our teams in product development started understanding what was happening over in finance. People in finance were able to see what strategy and marketing were doing, and so on.
That has enabled us to do a variety of things, the most important being automation. Very simply, we took Neo4j and threw an app layer on top of it. The automation piece came from us adding a business rules engine, which got us to 50% to 80% automation. We also threw a workflow tool in there to catch anything the business rules couldn’t and included a many-to-many relationship.
Our teams typically know their starting point, so we’ll narrow down our product inventory from 28 million records to five or ten, which essentially allows us to semi-automate these based on historical mappings. We can even provide an associated ranking based on historical information, so you can default to that as well.
Along with that, the business rules have only been built out to the next generation because we could actually see what everyone wanted to do within their workflow.
For example, finance will look at our data and say, “Hey, I need to do specific allocations for a variety of different use cases.” Then they can go to what the software reporting team is doing upstream and say, “Hey, I don’t actually need to do that anymore because it was redundant — I’ll just use whatever you had.” It helps automate some of their process, and it allows for each team to see what the others are doing.
So these examples have been from the product domain — but what happens when we go to the customer or supply chain domain? We started to see a variety of use cases in which data held by one team was helpful to other teams as well.
Below are six of our hierarchies, highly-simplified for the purposes of this slide:

Let’s start with the hierarchy in the middle: our Product & Services hierarchy, also known as an ERP hierarchy. This is how we differentiate our products into hardware, software, services or a combination, which describes our internal product hierarchy.
To the left of it, Cisco.com is our ecommerce version — or how the world sees our products from an external perspective. Continuing to the left you have the business entity hierarchy used by finance for financial rollups.
Under this hierarchy we have something that says business entity, while under the ERP product hierarchy it says business group and unit. And what is really the difference? If you can imagine a diagram where these hierarchies overlap, there would probably be about a 50 to 80% overlap.
Something I’d like to point out is that we are not in the business of maturing the business process. We take the stance that our teams will mature and simplify their processes for preserving data integrity, and our data model is going to be organizationally agnostic. As long as we can traverse the graph, you can bring your IDs and plug them in, and we’ll let you transverse in. We think that an organizationally agnostic data model is a best practice.
Continuing on to the bottom left of the image, we have our sales compensation hierarchy, which is how we compensate our sales agents globally. Jumping to the top right we have our sales territories hierarchy, which starts at regions all the way down to the district level.
To the left of that we have our primary customer registry hierarchy, which is a conglomeration of customer hierarchies that provides our business units with the ability to use whatever contract they want. And then we end up at the green nodes which are our connectors, our traversal nodes. This includes support services, warranty, sales agents and booking numbers.
A Deeper Dive into HMP Example Use Cases
Let’s dive into some examples. The first is one of our most requested use cases:

I was formerly a product manager in our supply chain organization, and the cipher that I knew really well was our ERP product hierarchy. I had my known, and my known unknowns — but we needed to find the unknowns unknowns, which is really where the value came in.
We see Product & Services traversing down through their hierarchy asking what customers currently have their products installed. A few weeks ago, one of our product managers wanted to know in real-time which customers were buying a newly-launched product. When we ran the report for them, they were really surprised to see that rather than the product being used in biotech and high tech, it was being used in real estate, retail, media and entertainment.
If they actually want to have a conversation about any of these users, we can link them with the sales agent for that particular territory to find out what those customers are really interested in. And by learning that other companies similar to Disney were using those products, they were able to completely redo their product road map.
In example number two, we put together our finance and web marketing hierarchies:
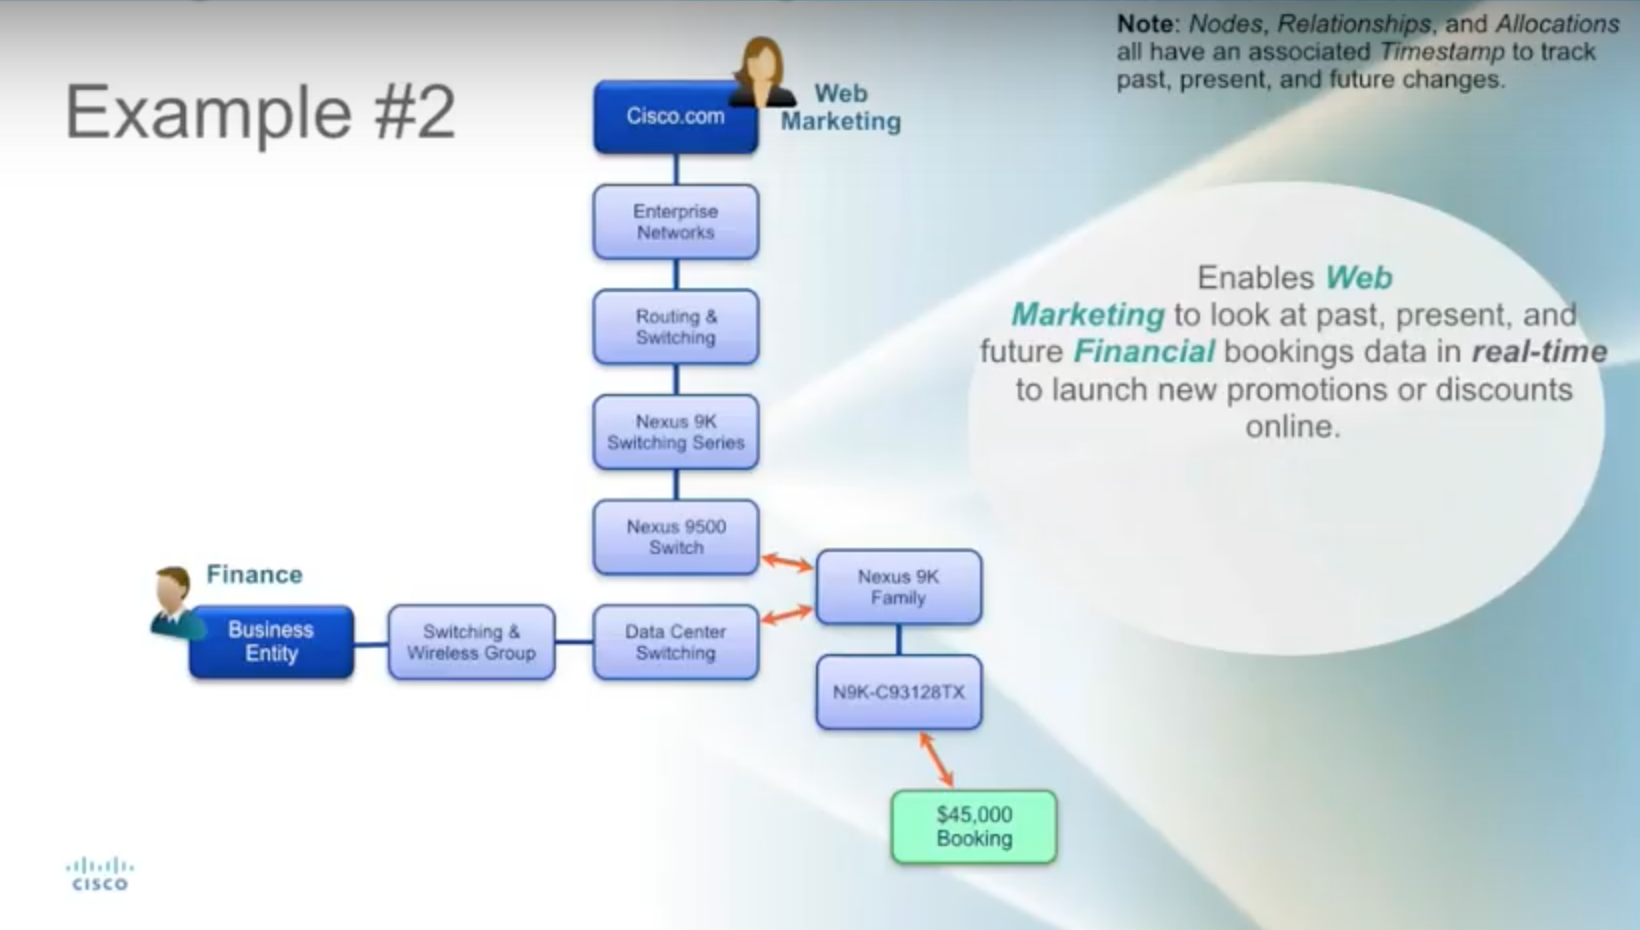
Remember, finance does a lot of our financial rollups, and I would say this group is one of our most sophisticated functions at Cisco. They do automation and algorithms beyond what you could possibly imagine.
Once we had all of this in our Hierarchy Management Platform, the web marketing team suddenly had access to the financial team’s forecast trends. When they noticed downward trending forecasts, the marketing team asked finance to set a trigger so they could initiate campaigns to counteract those trends.
Marketing shares their data with the finance team as well. For example, if they are going to offer certain promotions, they let finance know so that they can factor this into their existing algorithms.
Next, whereas example one is probably our most requested, number three is probably the most fun:
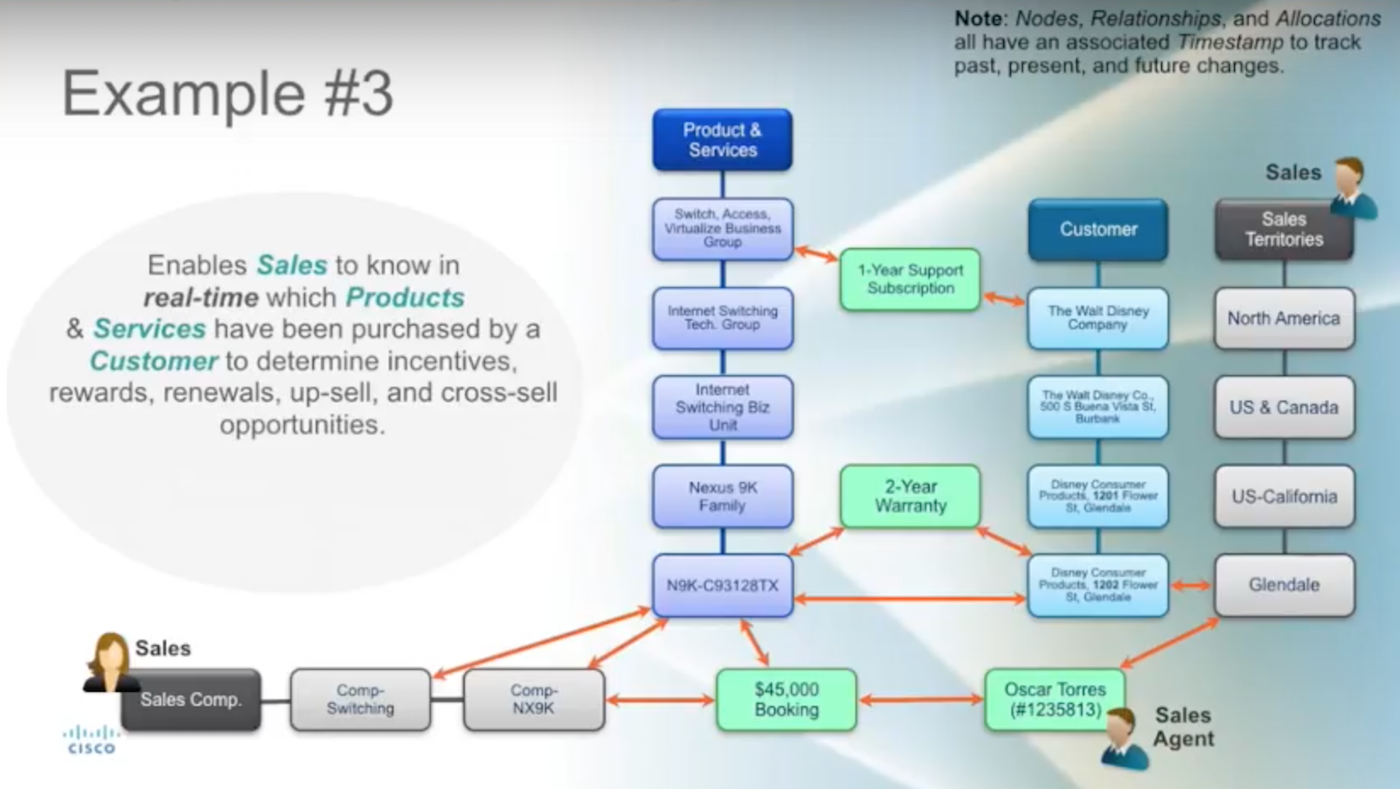
In this particular example, we have sales and are looking at which products and services customers have installed. This is a situation where we could potentially take a sales agent off the street and — utilizing some of our Cisco sales mobile applications — give them a full profile on some of our customers. That would allow them to tell a customer, for example, what kinds of renewal opportunities are available to them.
They could see, also from a market segment point of view, that other like companies have additional products installed, which provides a potential sales lead as well. And when you add to that the fact that you know their install base, their warranties and support services, you can bundle that together for upsell and cross-sell opportunities. It’s a grandiose use case, but it’s something people have been requesting with the advent of our sales mobile applications.
Sales compensation has been a challenge for the past six months because we just recently onboarded it into the Hierarchy Management Platform. Interestingly, if a product team decides to stop supporting a certain product, it pulls the incentive from sales agents. Obviously they’re not going to sell something they can’t make money off of, so the sales compensation hierarchy is used for incentives and to figure out how to create future goals and forecasts.
What’s Next and Decoder Ring Lessons Learned
Below is the top of our decoder ring:
The ciphers are what live within our decoder ring, and they are groups that are actively engaging with us. While we don’t have all of these in our decoder ring today, each one of these groups offers a cipher that we can add into our graph that will allow our stakeholders to look into the past, present, and future.
No only will this allow our teams to traverse from each other’s data; they are also able to answer questions they originally wouldn’t have even thought to ask.
I’d like to close out with the following thoughts:
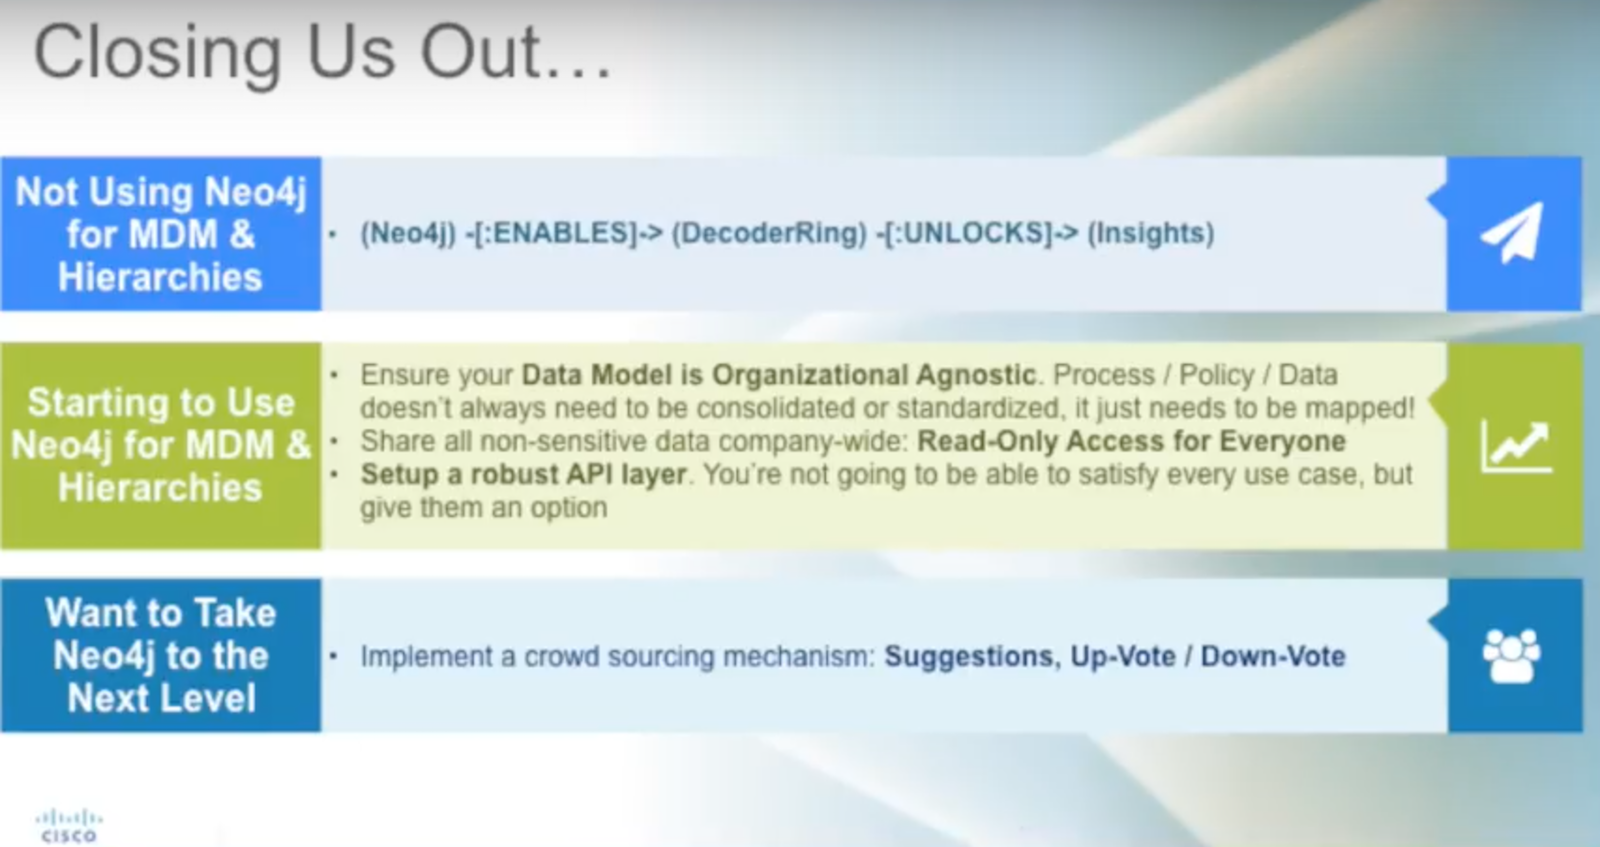
Start using Neo4j
You all may be in various stages of Neo4j usage, and I would say we fall in the middle category (in green, above). If you aren’t using Neo4j, I encourage you to set up a POC; it’s an amazing technology.
As I’ve mentioned before, keep your data model organizationally agnostic. Don’t try to enter the slow struggle of maturing your business processes at the same time you’re trying to grow your technology architecture. And make sure that when people come, plug in the IDs to ensure everyone can benefit from your company’s tacit tribal knowledge and allow other people to traverse.
Avoid Data Territorialism
Another thing I’d like to mention is that “data territorialism” is a disease for any company that’s trying to grow. I’m not advocating making all your sensitive data available for people to read, but make sure that anybody who’s tapping into your graph data model can see everything. They’re going to learn not only from their own data domain, but they’re going to learn from the other data domains as well.
Build a Robust API Layer
The third lesson goes hand in hand with the second one – build a robust API layer. We learned this too late in the game and in a lot of cases are trying to catch up.
You’re not going to be able to catch all the different use cases into your Neo4j instance because of different BI platforms and applications that are going to come to the table. But by having a robust API layer, you provide options for your teams. Make yourself a column with your Neo4j architecture.
Implement Crowdsourcing Mechanisms
And finally, if you want to take Neo4j to the next level — and we are nowhere near ready for this at Cisco — implement crowdsourcing mechanisms, which has been the bread and butter for some of my other applications.
In terms of governance, I think you just have to trust people. We have about 70,000 employees, and I made a very simple application under the premise of a crowdsourcing workforce planning resource.
Anyone can contribute to it and anyone can learn from it, and it snowballed from there. It went from 22 users to half a million unique views every single month, and these users are continually making changes and adding data. That’s more than I would be able to analyze in my lifetime.
We’ve also been trying to figure out how to determine which of these different customer hierarchies is the right one. Take Berkshire Hathaway, one of our key customers, as an example.
This holding company has a huge number of affiliates and licensing companies — how are you going to view that in a standard view for your entire enterprise? You can rely on the account managers. Let them go in and determine a thumbs up or thumbs down, which will actually help you figure out what is good data and bad data in a lot of cases.
Download this white paper, The Top 5 Use Cases of Graph Databases, and discover how to tap into the power of graphs for the connected enterprise.
Share Article


Explore
Related Articles

Mastering Fraud Detection With Temporal Graph Modeling


Text2Cypher Across Languages: Evaluating Foundational Models Beyond English


