
Collaborative Technology Intelligence Platform

Principal Data Scientist, DuPont
11 min read
Editor’s Note: This presentation was given by Fan Li at GraphConnect New York in October 2017.
Presentation Summary
Fan Li is a Principal Data Scientist at DuPont. Dupont began as a science company with a mission to deliver sustainable and innovative solutions to some of the world’s greatest challenges.
Today, DuPont has diversified that mission into other businesses such as nutrition, health, industrial bio-sciences, safety, protection and chemical manufacturing.
Because DuPont works within such broad industries, the company deals with many different end users such as scientists, engineers, researchers and national labs. The challenge that arises here is making sure all related data sources and insights are shareable and clear.
DuPont users require a platform that is able to ingest a lot of data from external sources and then make it readily available via connections clearly drawn for end users with over-arching missions. They decided to drop their attempt at doing so with a structured query language (SQL) and instead introduced a graph database.
The benefits of adding Neo4j include graph traversal capability, which involves starting at one publication and being able to follow the chain to other related publications.
Another big benefit is clearly identifying collaborating networks by moving along the lines of cluster analysis to identify collaboration networks.
Another important factor is having competency benchmarks in place to measure competency in specific technological domains.
Finally, DuPont values the ability to work alongside Neo4j, expand and enable end users to incorporate their personal knowledge and insights to the graph.
Full Presentation
Today, I’ll be talking about how our company uses Neo4j graph technology for our competitive intelligence platform.
A Brief History of DuPont
My name is Fan Li and I work for DuPont. DuPont is a science company, and our mission is to use science to deliver sustainable, innovative and market-driven solutions to solve some of the world’s greatest challenges.
We aim to make life better, safer and healthier for everyone.
That may sound very abstract. So I’ll specify.
First, let me emphasize that DuPont is a very old company. It’s perhaps one of the oldest in the United States. We started over 200 years ago primarily to manufacture gunpowder and explosives. That is what we did for the first century.
Then, about 100 years ago, we switched into the chemical industry.We have initiated the revolution of chemical manufacturing. This is especially so in the plastics space. We have a lot of well-known products such as nylon, Kevlar and Tyvek.
More recently, about 20 years ago, we have diversified our business into other spaces such as nutrition and health, industrial bio-sciences and safety and protection.
DuPont Today
Regardless of the specific industry we’re playing in, the core for us is still using science-based solutions to drive innovation and to deliver superior products to our customers.
At this moment, the main focus of our company is primarily to address increasing demands driven by the global population growth.
The demands included in this list are:
- A growing demand in food
- A growing demand in energy
- A growing demand related to urbanization
- Improving the quality of living
The approach we take to deliver science-based solution towards superior product is through our collaborations. We believe that we won’t be able to deliver fast solutions just by ourselves.
We want to be able to access both our internal talents and also talents from all over the world. The goal here is to connect our 9,000 scientists and engineers at DuPont with external researchers – globally in universities, startups, national labs, as well as other companies.
To promote more effective collaboration between our scientists engineering with the external researchers, we really need to have fast, quality and deep insights. Some of the key questions we are trying to answer are:
In addition, we have to do all of that faster and better than our competitors.
As the corporate information data science team, our goal was to develop such a technology intelligent platform for the entire user base in our company. This is to include scientists, engineers and the business users, and to provide insight for everyone.
The overarching goal is to be able to ingest a lot of different data from external sources. Next we want to process them and synthesize some actionable intelligence for the user.
We had some main objectives in place for the system as we started this journey three years ago.
The first thing we want is to be able to capture and ingest a lot of technical information from different sources.
Next, we want to be able to organize them.
Finally, we need to integrate them into a knowledge management system.
Based on these steps we should be able to deliver a faster and more accurate technical search and data discovery.
We want to enable holistic multilevel advanced analytics for the user. We want to start with the data and objectize the data into entities such as people and organizations. Based on that, we only extract the more in-depth insights such as technology business in a strategic level.
Data Sources
Now let’s get into some of the data sources that we have to deal with in terms of technology intelligence.
Some of the representative data sources include scientific publications, patterns, regulations, government funding, as well as news, media, and websites.
With each category, there are additional subdivisions.
For example, there are thousands of publications and scientific journals that are relevant to us.
There are over 70 countries of patents and regulatory information we need to keep track off. As for government grants, we all know there are millions of news, media and websites that could potentially be relevant to us.
At the beginning, some people ask the question, “If we are only interested in gathering this information, can we just use a general search?”
The answer is no, because we soon realize that – in the long run – the relationship between those entities are more important.
One example is the people. The common factors between publication, patents and government funding are the people who work on the research, the people who write the papers and the people who apply the patents. The link between the people is one key relationship we need to identify and capture.
Other examples would be links between entities and products or chemicals. Those are the factors that we need to identify and then link. We want to integrate them all together from those different data sources.
The Challenge
A big challenge for us is data integration. Since we’re dealing with such diversified sources of information, we have to put in significant effort to integrate data and also disambiguate the data of information from those sources.
That’s where we realize some of the issues with the structured query language (SQL) database that we initially set to use, especially related to the schema and the flexibility.
As we are pulling additional information, it’s very hard to set a good schema and then to relate all the diversified information. So, that was a big issue when we started using SQL for this purpose.
The even bigger challenge for us is on the analytics side. Once we have the data in the database, how do we make that available to the user and derive insight?
Some of the issue is it’s increasingly difficult for us to write SQL queries for some of the more open-ended questions ,such as who connects with whom?
Sometimes, the query does not have the capability of a database, and that could make the results impossible to obtain.
The most important thing to note is writing SQLs is not some inherent capability for our scientists and engineers.
We always know that – from the very beginning, once we collect the data – we have to make it available to our end user. Our end users are the domain experts in chemistry, biology and whatever other specializations. We have to provide the data, and then let them play with the data and add their own analysis.
The Introduction of Graph Databases
A SQL language is simply beyond reach for a lot of scientists. In searching for the right solution other than SQL, we set our eyes on the emerging graph database.
After some evaluation, we selected the Neo4j for this project, mainly for two reasons.
One, we like it, because it is a native graph technology.
Also, we really like it because it’s a very vibrant open-source project and has a big community behind it.
We started using the community version of Neo4j around 2015, and we really liked it. Then about January 2017 we became a customer for the enterprise solution.
The Benefits of Adding Neo4j
Here are some of the key benefits of using Neo4j graph database.
One is that it has a very natural flow for us to map the different data sources into entities and relationships. This is done in a way that’s very easy to analyze by our end user and it’s accessible to the domain experts.
Also, the graph data schema is very flexible. It is very easy to add new entities and new relationships, so that we’re not limited in that front.
A look into mapping scientific publications.
We map scientific publications, authors, patents and domain spaces into a coherent graph. The graph is organized in a way that’s very easy to our end user to understand and for them to explore by themselves.
The Present with Neo4j
Fast forward two years, from the beginning of using Neo4j toward where we’re at now. We’re building this graph-based platform for our corporate-level technology intelligence platform.
This platform will include publications, patents and government funding, as well as other business data that we gather from third-party data API providers.
Within the graph, we have a list of deliverables. You also see a list of services we have to our end users, including a search engine to allow people to search the existing information,alert systems, a dashboard for interactive analysis as well as reporting and the self-service analysis using common business intelligence (BI) tools.
This concludes the overall platform that we have been developing for about two years. I’m very excited about this work. I truly believe that once it’s complete, it will become a really good foundation for our next-generation intelligence system.
How DuPont Uses this Information
Let me jump to some examples of how we use some of the knowledge or insight we derive from the graph database. This information is used to drive business decisions or technology decisions. One thing we really like is simply just using the graph interface for visual analytics.
For example, if a researcher pulls a set of documents from the graph database, they immediately get a view of how the body of publications are interconnected together. The user sees:
- Who are the authors?
- Who are the top authors that publish the most papers?
- How the publications are divided by the technology domains?
- What are the emerging topics if you factor in the time dimension into the graph?
This is very simple. We haven’t done much other than just pulling the data from the database, and yet we have already provided a lot of insight for our end users just to explore.
Graph Traversal Capability
I also want to mention the graph traversal capability.
You start from one publication. The publication is cited by the other publication, and you just follow the chain. This is a very natural way for scientists to explore the technology domain, and it is done very easily done using graph database.
Identifying Collaboration Networks
Another thing we do is more along the lines of the cluster analysis to identify collaboration networks.
A strength of the graph database is to explore the relationships between the different entities. We have defined a specific side of the relationships including direct relationships or indirect relationships that we think are critical to reveal the collaborative nature between university and startups.
We have been using this strategy to help identify the university and startup ecosystems in order for us to identify the good partners.
Also, we find this cluster analysis is a very good way for us to identify a wide space, in a sense, faster and more accurate than could be done before.
Currently Neo4j does not have a self-service UI yet. It is possible to integrate with some of the existing BI tools, such as tableau, and allow the end user to do some self-service analysis. In this case, the end-user is happy that they will be able to access the data and to play with the data to some extent.
Competency Benchmark
One more example here is about competency benchmark.
Once we have all these very sophisticated diagrams including both internal researchers and external researchers, we denote some metrics to measure competency in specific technologies domains.
This is used in a couple of different ways.
One way is to identify our competency gap with regard to the specific project or the specific growth initiative that we have. So, that team may do some strategic hiring.
Another possibility is that we benchmark ourselves against our competitors, to see where the gaps are.
A third way to use it is to identify collaborators who provide complementary competencies in a way that has to potential to really drive us close.
Finally, ask open-ended questions using Neo4j. A very natural way for scientists to research is to ask these open-ended questions:
- What if A is connected with B?
- What are the connections between C and D?
- What are the possible ways to apply technology A into application B?
All of these options are very easily implemented using the graph query language, and therefore immediately get insights very quickly and efficiently.
Some of the things that we do really enable a hybrid technology growth to apply technology in one domain into an application space in other domain. This tool has been really helpful in that regard.
Expanding with Neo4j
As for the next steps, we aim to expand our knowledge base to incorporate internal technology data.
The next big thing we want to do is enable our end users to incorporate their personal knowledge and also their personal insight into the graph. Then really make additional connections and relationships.
Another thing we want to develop is some more advanced features such as recommendations within machine capabilities. We’re working with the Neo4j to evaluate the recommendation engine.
Lastly, we would like to incorporate other technology areas we’re working on.
We’re building our next-generation technology platform using Neo4J graph database. We aim to capture complex data from a lot of different sources including publications, patents, news media to create a coherent knowledge graph within Neo4J.
The objective of doing that is to help connect our scientists, engineers and external collaborators to deliver the most innovative solutions.
Share Article


Explore
Related Articles

What Is Data Lineage? Tracking Data Through Enterprise Systems
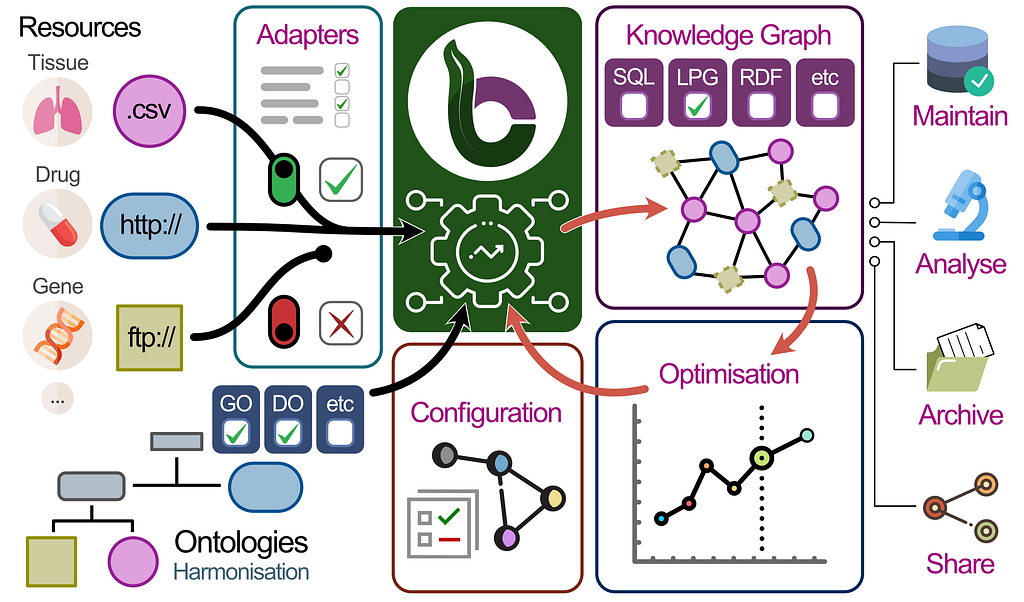
BioCypher: Unifying Framework for Biomedical Knowledge Graphs
Graph Data Science for Drug Discovery: The 5-Minute Interview With Ufuk Kirik


Graphs for Information Services: The 5-Minute Interview With Cyndi Streun
