Combining knowledge graph and graph algorithms to find hidden skills at NASA

Chief Knowledge Architect, NASA
16 min read

In this post, I’m going to give you an introduction to knowledge graphs and show you how we’re using them at NASA within the people analytics branch of human capital across the agency, particularly how we’re combining knowledge graphs and algorithms to find hidden skills.
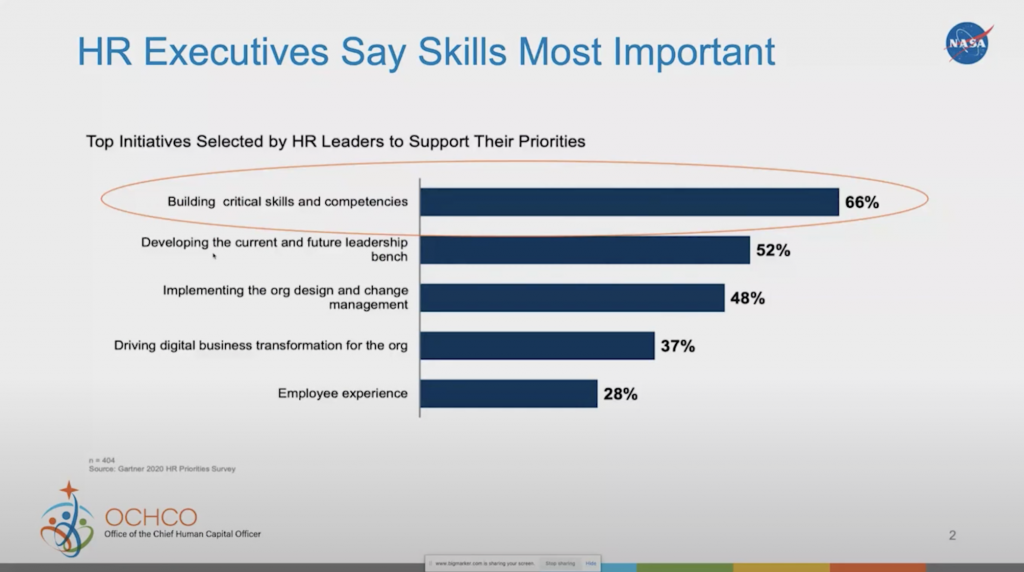
Why are we doing this? Well, various research and surveys have gone out looking at individuals’ skills or industries, and how we’re doing things. One of the things that HR leaders and CEOs, in particular, prioritize is building critical skills and competencies.
What we’ve noticed over the last year during these unprecedented times is that we really need to reconsider how we’re looking at our skills. We may have to retool our individuals, especially as they’re trying to find new ways of doing remote or hybrid work.
All of that is bringing across a transformation and looking at how we look at our skills and identifying the knowledge that’s out there within our organizations. So that started me in the journey of looking at how I can use knowledge graphs to be able to really combine the data we have around our peoples, our occupations and our training in order to truly identify what we have in our organization, what’s lacking, and how we can utilize this information.
First, what is a knowledge graph?
You can talk to many people, and you’re going to find different definitions. The way I look at it, especially for an enterprise, is a mechanism or a way to connect different data sources together via some type of common relationships. It can bring together both structured and unstructured data.
The beauty of a knowledge graph is that, unlike your traditional relational database management systems, you can add data very easily in and out of the data within a graph database. You can create relationships, remove relationships without really costing a whole lot of headache around your data model or your schema because they’re built for things to be changed around easily. You can really start to identify different clusters and find latent connections that may be in your organization. It provides a good way to identify information while looking at it both from a graph perspective and in a more traditional way through tables and lists. You can put the data in any kind of visualization tools that you may have.
There are also different algorithms you can look at. We use various types of text annotation within our datasets in order to identify skills within employees. When we start thinking about how we’re going to identify the structure of the network, we’re looking at path finding, centrality, and community detection – some of the built-in graph algorithms that are available within the graph data science library. We’ve also taken some of that data out to look at text rank, similarity, and sentiment analysis, and we utilized that information and ingested it back into the graph database, in order to enrich the knowledge graph.
Creating knowledge graphs
We use Neo4j, of course, and the graph algorithms that are in there. I’m gonna show how we use node similarity. We’re evaluating some of the graph neural nets that are starting to come out, and also looking at how we pull out the information and utilize our neural graph outside of that, maybe in AWS or GCP. We use a very simple common programming language Python/R to do some of the text similarity using Doc2Vec, entity extraction, or even using BERT, RNN, Spacey. All of them are capable of being used in your workflow, in your pipeline, to build your knowledge graphs with the Neo4j graph database.
I’m gonna go over a very high level introduction to building this knowledge graph, what I did and then show you some of the outputs that we get from that. From a knowledge graph model workflow, it’s very easy to start off. We started off with the occupations, inside of which contain information such as what type of knowledge, skills, abilities, and tasks are necessary for the occupation or role.
The knowledge graph model workflow
We take that information, build the vocabulary about those occupations, and feed that into a Doc2Vec model. All of that information is built into it via an existing database called OnDeck, which is from the Department of Labor that we’ve been able to use as the foundation for our taxonomy, as well as the information we’re using within our graph database.
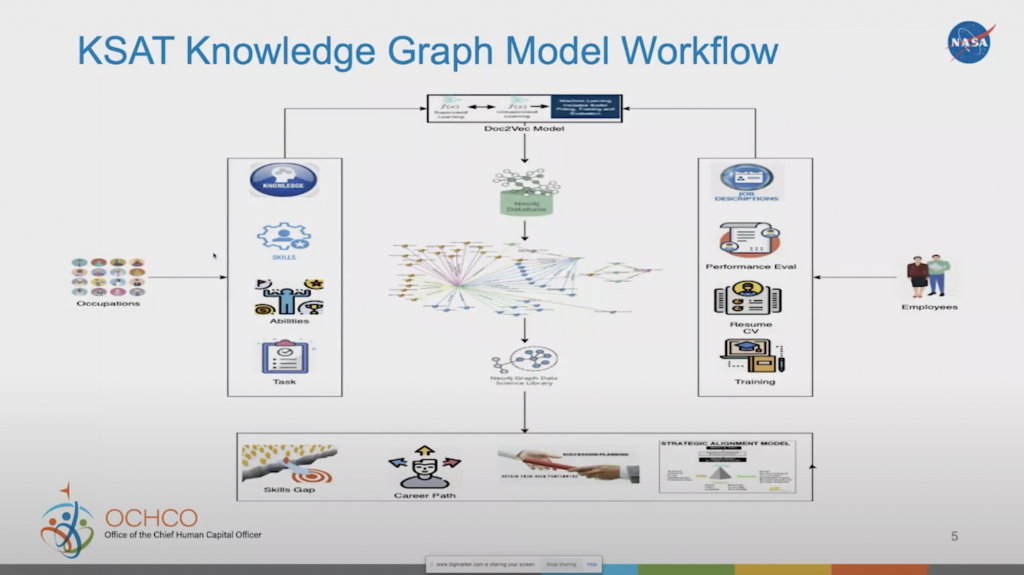
Once we built that vocabulary and created the Doc2Vec model, we can use that model to infer an employee’s information, such as their job description, performance evaluation, resume, and training. We can look at each of those sentences within that information and infer that against the Doc2Vec model to see how closely they may be related to one of the elements that is associated with the vocabulary of the occupation.
Now, we can put it into a graph database, run some graph data science capabilities, and we can take a look at skills gaps, career paths, succession planning, and maybe even how we’re strategically aligning our workforce across the organization.
Pull data from sources

Knowledge graphs are very simple once you break it down into the basics. I’ve got three different data sources here: Occupation, Training, and Employee. All of them could have their own data source and information. When you combine them together, you’re starting to build a knowledge graph across those three domains to see how they’re related.
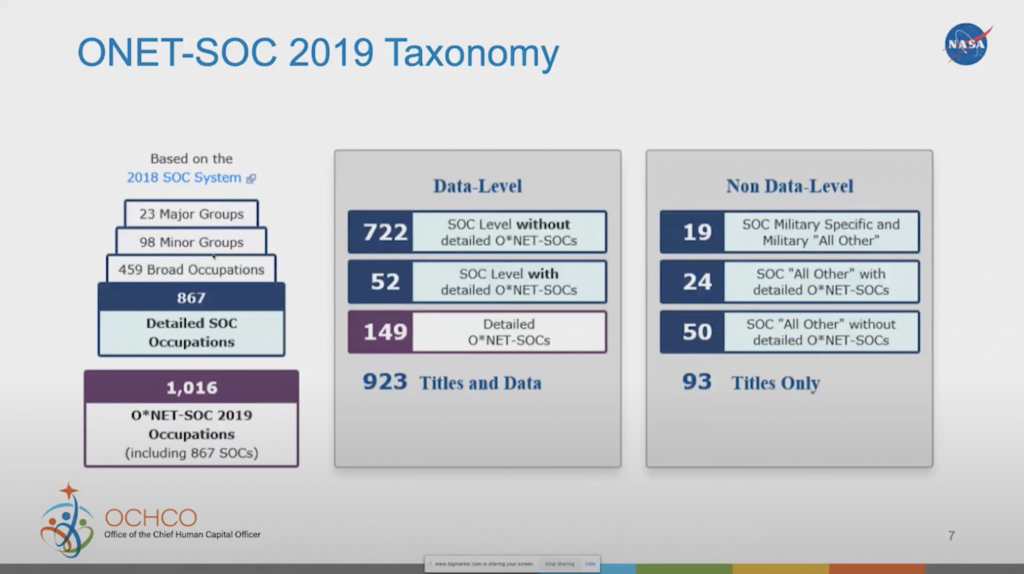
So we started with this ONET database, which has all these different occupations and elements. We took a look at this database from the occupation side and asked ourselves: What is it about these occupations that I can use to relate back to training or back to an employee?
Basic data model
As we break that down, we really came back to KSATT: knowledge, skills, abilities, tasks, and technology.
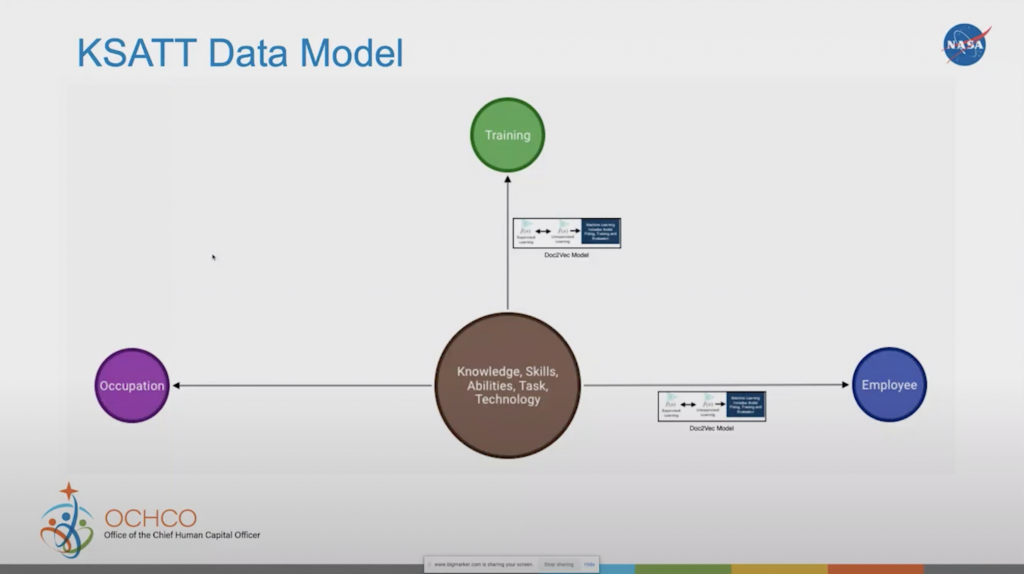
In every occupation, you need some knowledge. In order to do that work, you need to have some type of skill and be able to do some type of task. For example, I have knowledge on natural language processing. As I’ve shown in some of the work we’re doing with the Doc2Vec model, I have the skill to do text similarity within natural language processing, by comparing two different documents, to see how similar they are to each other. And I’ve done the task of running the Doc2Vec model to be able to come up with those similarities and those relationships.
Since I have these knowledge, skills and tasks, and the occupation requires these knowledge, skills, and tasks, I can combine the two together to find out how closely related I am to that occupation.
Similarly, Training has the same types of information in there. If you take a class in natural language processing, you’re gaining knowledge on the topic. Within that, there may be a section on text similarity, which could be a skill you’re looking for. And within that section, there may be exercises on running the Dov2Vec model, which shows you how to do that task.
Now I’ve combined Occupation to Employee and Training altogether through the connections of knowledge, skills, and tasks. So that’s how we developed the knowledge graph.
Expand model to create profiles
From there, we can start adding other things. Now we can create a job profile and employee profile based on all that information and really start seeing how we compare a job profile to an employee profile within our own internal talent marketplace.
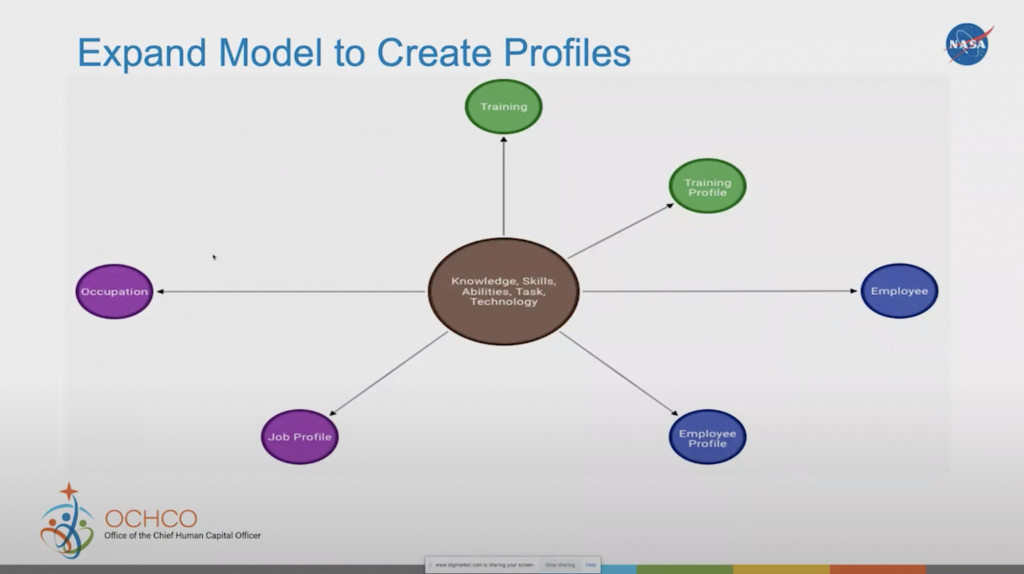
An employee can start to search for job profiles that need their skills, or a supervisor can look for employees that may match the skills they need. So we’re starting to be able to make recommendations, looking at jobs and skills, or recommend training employees may need to take in order to enhance their skills. Going even further, we can even start to look at how we can recommend mentors or find experts with specific certifications or licenses.
Connect to external data sources
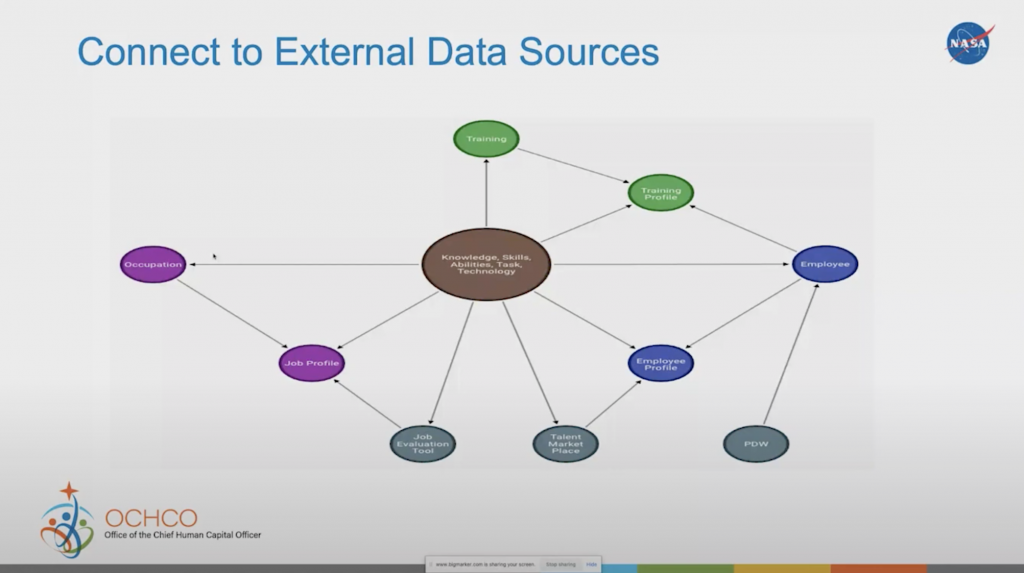
We can add even more data to further enrich our knowledge graph. We’ve added the information about the employee into the database of the PDW (personal data warehouse), the talent marketplaces, where we store the information about the employee and the jobs, as well as a job evaluation tool. The process just goes on to grow your knowledge graph.
Connect to mission data
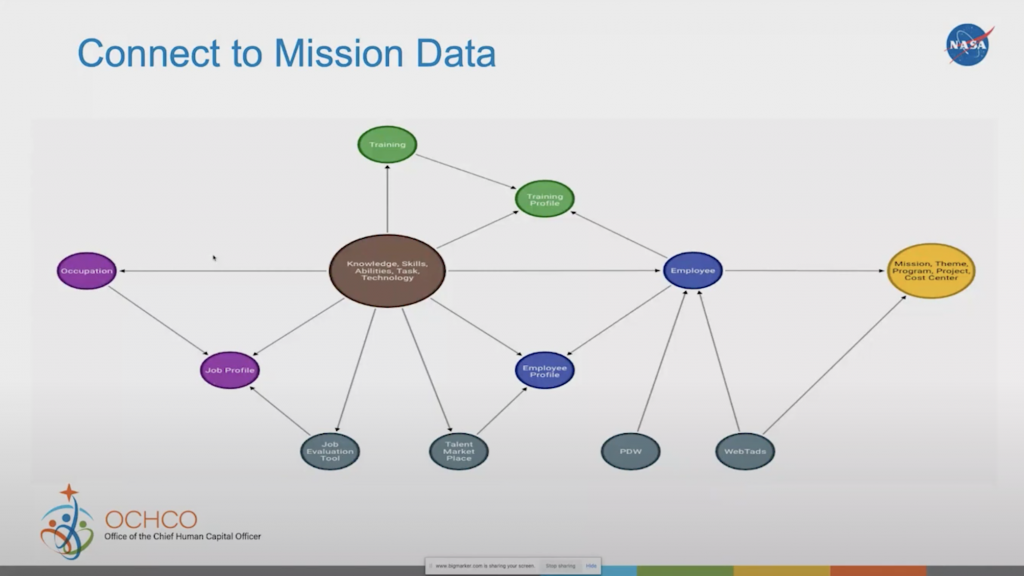
With that, we can then add who the employee charges to. It could be a particular cost center in a project in a program, mission and theme, etc. Now I know which employees are in what organizations, and then I can start answering questions for the organization, such as what skills are within my cost center or my project, what skills I’m missing based on the work roles that I have, what skills I’m losing due to attrition. Those are some simple questions that we can start answering based on this knowledge graph.
The final product
I don’t mean to scare you with this picture here, but this is using a recent release where I was able to reverse engineer the model using the Cypher workbench, connecting it to my graph database, pulling out the model, and showing you the data model that’s built into that.
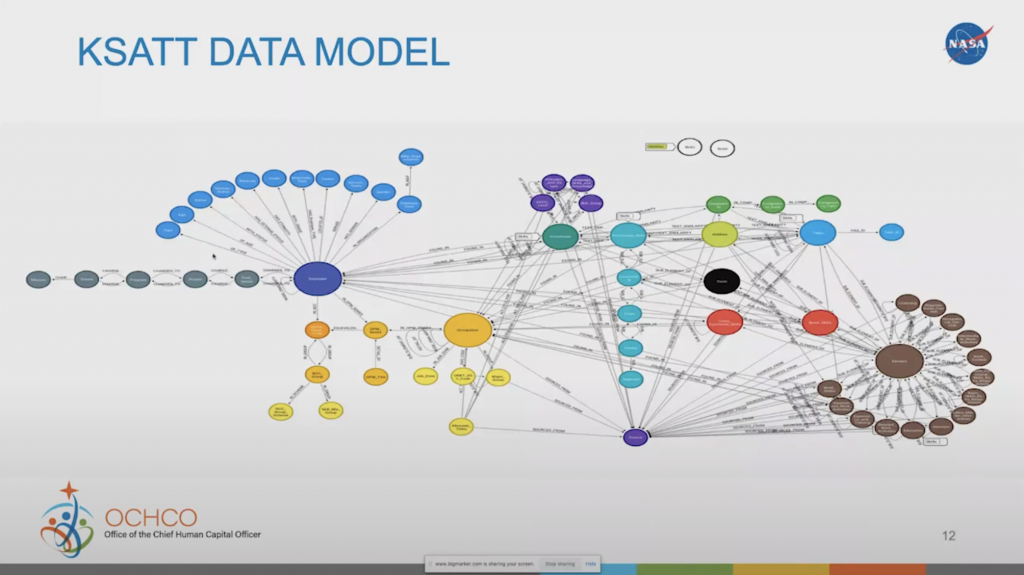
It’s got all the different elements, including the employee, the occupation, as well as the training involved. They’re all connected to each other, which gives you an idea of all the work that’s going on behind the knowledge graph. Taking a look really quickly here at the employee:
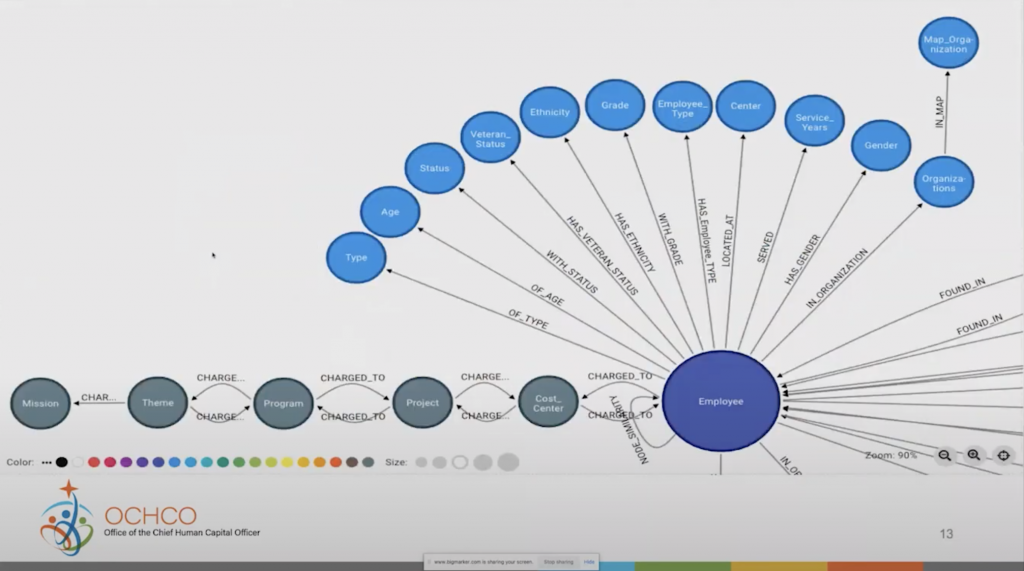
You can see the employee has various nodes connected to it, such as age, ethnicity, grade, the center they work at, how long they’ve worked, who they charge to. Those are the ways that we’re able to connect back and forth and just see how we can get information about employees, their characteristics, their skill sets, and different places that they’re charging to.
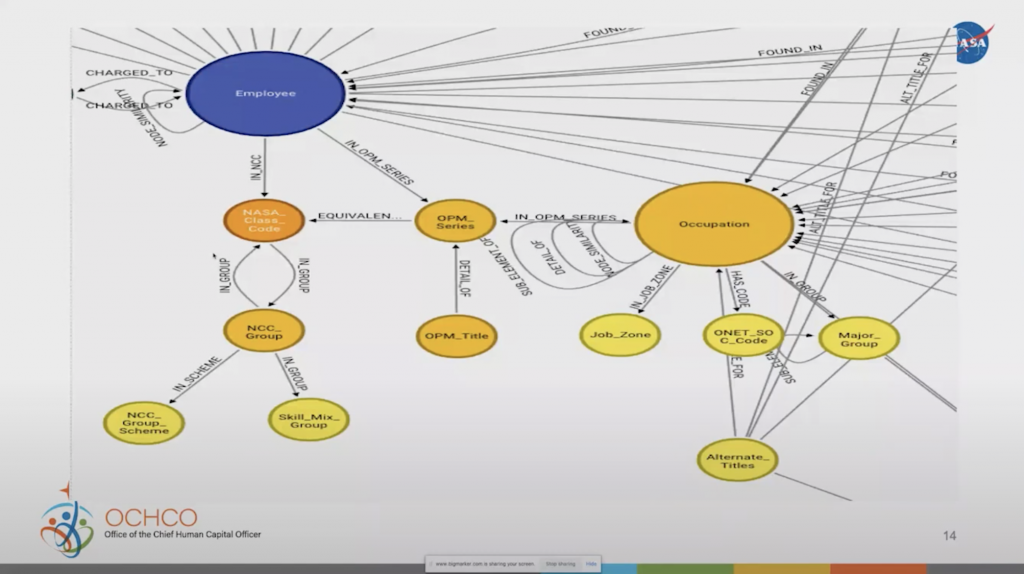
The employees are also connected to various occupations. As I mentioned earlier, we started with the ONET Department of Labor database of these occupations, but we also have other specific occupations that we need to look at within the government (OPM series), and NASA has their own NASA class codes as well.

Those have all been cross walked around. So now we can get more specific information on NASA-specific jobs, such as what group or what skill mix we’re looking for. All this information is added into the knowledge graph, and it just keeps growing to provide richer information. As you start playing around with models, you’ll see how those things can develop very easily.
So that’s our knowledge graph. Now, let’s talk a little bit about graph data science.
What is Graph Data Science?
Graph data science really started to take off in the last few years. Where does graph data science fit in the entire ecosystem within the graph universe? It’s somewhere in the middle of utilizing different types of techniques to get insights and make predictions from your data. I won’t dive a whole lot into this. I’ll let somebody smarter than me, like Dr. Alicia Frame, talk about that. Instead, I’m going to show you how we utilize graph algorithms to get some of our answers.
Node similarity algorithm
In this particular case, the algorithm we use is called node similarity. It basically compares a set of nodes based on the nodes they’re connected to. Two nodes are considered similar if they share many of the same neighbors. It gives you a Jaccard similarity score telling you how closely they are related to each other.

In order to run this algorithm in Neo4j, you first have to do a projection of the data you’re looking for (the first line of green code). I’m using the Graph Data science Library to create a Cypher projection of the graph I’m looking for. I’m pointing out all the occupations that are tied next to a particular OPM classification. Here, you’re seeing GS-2210, GS-0080, GS-0340, and GS-0343, all of which are related to IT occupations and how they compare to a management analyst. This particular algorithm is used for a career change. If I’m a management analyst but I want to go into an IT field, it will show me what jobs out there are closely related to that and what would I need to learn in order to upscale myself.
The second part of the code here is to stream the results back to the browser. In this case, we pulled it back out and put it into a table. It compares the management analyst occupation to all other occupations. The result looks like this:
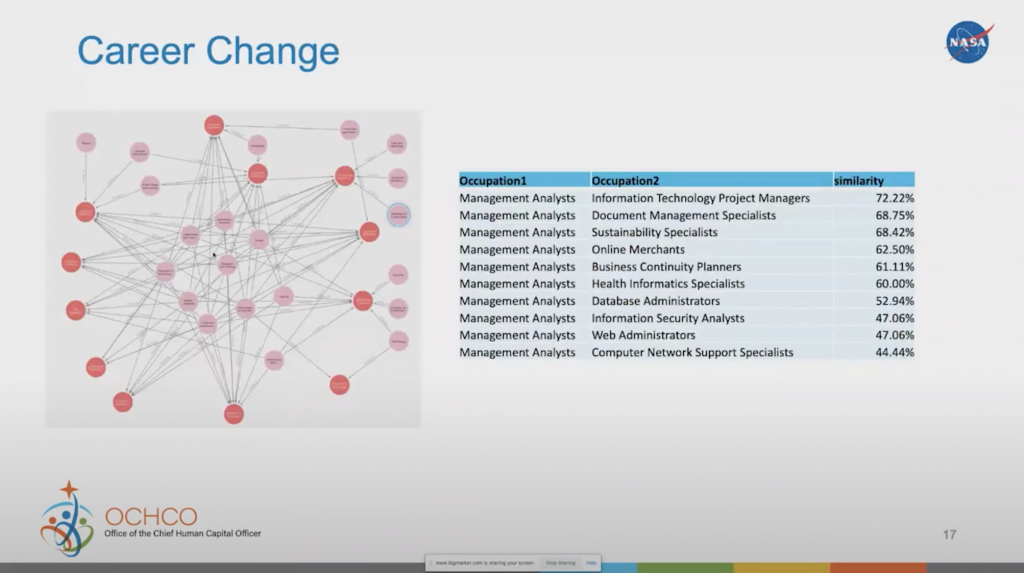
On the left-hand side, there’s the graph. Everything in red there are the actual occupations, and everything in pink there are the different elements that are similar within those various occupations. Right in the center, you can see the whole cluster of elements that are common to all of the occupations, while on the side there are some elements that are unique to some occupations.
If I’m a management analyst and I’m looking to change my career to go into IT, I can clearly see what my options are. As the table on the right shows, a management analyst is 72% similar to an information technology project manager. From that, we can also pull out what’s necessary for you to upscale in order for you to get the occupation that you’re looking for.
Discovering connections
We can also try another approach: discovering connections. In this particular case, we’re looking at our core center, the earth science core center where we’re charging to. And we want to look at who’s charged to it and what work roles are in them.
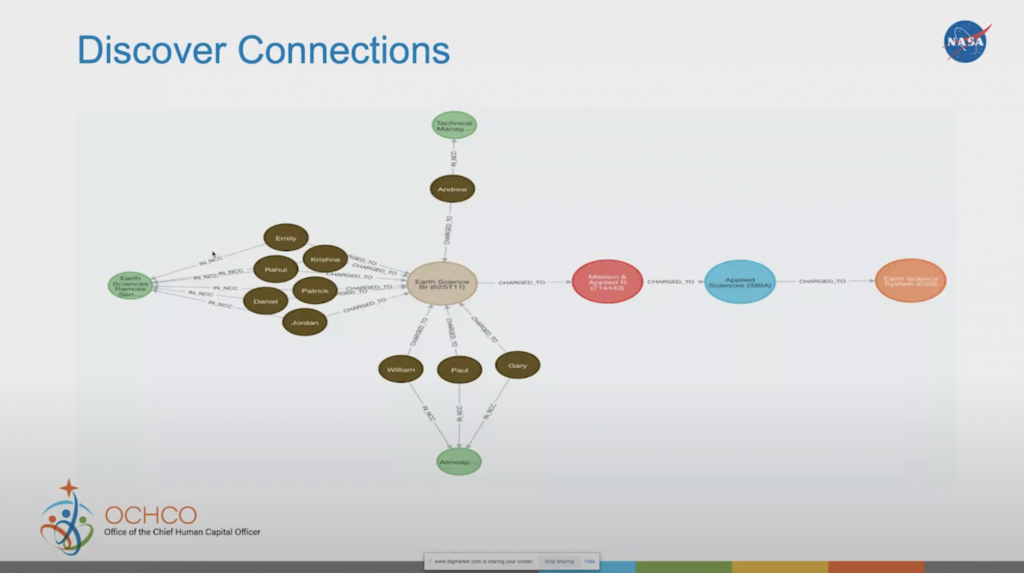
Imagine a recruiter coming to me and asking if we could pull out all the different work roles within the earth science theme, because they’re getting ready to go to a recruitment fair on Earth Day, and they want to see what jobs are related there. We can start from figuring out who’s working there. And if I know who’s working there, then I know what kind of skills they have, so I can start aggregating the skills related to an occupation or to a project earth science.
Supporting DEI initiatives
Under this current administration, we’ve gained a lot of interest in diversity, equity and inclusion initiatives. We’re starting to look a lot into diversity in our organization. Are we equitable in how we’re providing our training or promotions? Are we equitable in who gets what opportunities? Are we including the right individuals within different types of classifications here? This is a simple chart showing the breakout of gender across this particular charge code.
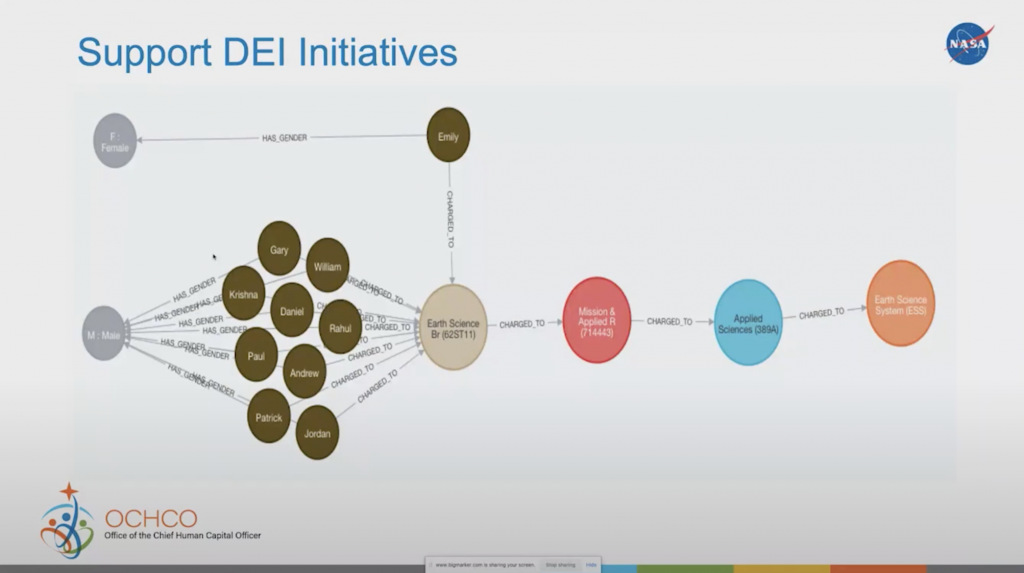
As you can see in the graph, there’s a higher male proportion to female. This is just a rough sample that is not everything, but just to show how you can break that out. All of this can be aggregated into a table, and you can do some different analysis to see the metrics that you’re looking for, and if you’re being diverse as compared to other organizations in the industry.
Ranking skills by occupation
Let me now get a table view that you can always pull out of Neo4j. In this case, I’m going to rank skills by occupation. I want to find out what are the most important skills for a particular occupation.
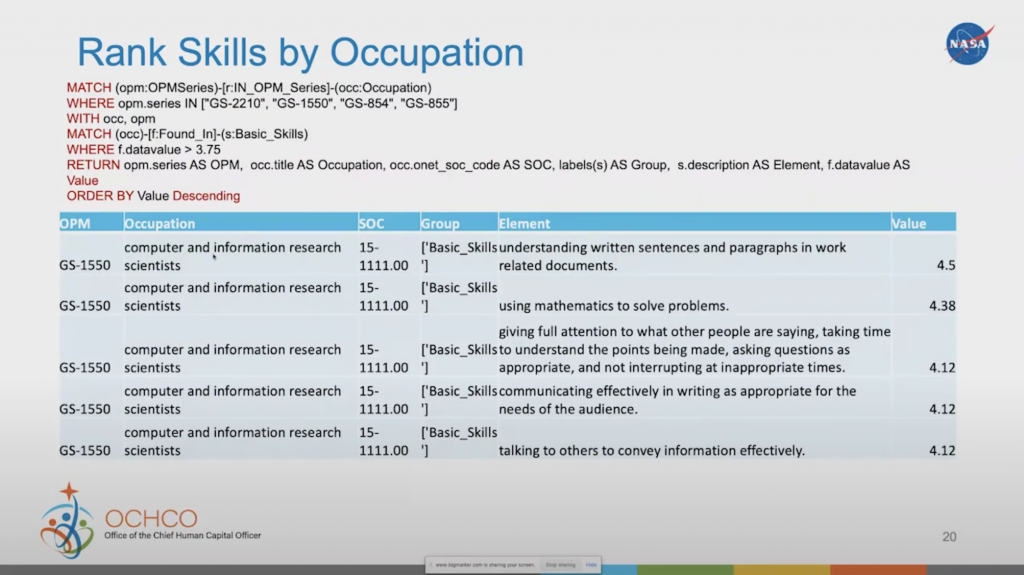
In this case, we’re looking at a computer and information research scientist. Because we’ve got assessments within the owner database that tells us how important the basic skills are to this work role, I can then start bringing those out based on that level and then order it in ascending value.
The most important basic skill for a computer and information research scientist is understanding written sentences and paragraphs in work-related documents, which is much higher than using mathematics to solve problems. It shows you how communication is even more important than being able to do the math in many cases as a basic skill in this particular job. So that opens up the doors for us to be able to use that metric or that value as a weight in many of our algorithms and our models.
Employees similar to an occupation based on abilities
While looking at employees and their abilities, we can use the same node similarity algorithms to compare an employee to an occupation. How similar is an employee to an occupation? If I’m looking for somebody that meets certain requirements, I can use this algorithm to find the employees that are highly similar to the particular work role that I’m looking for.
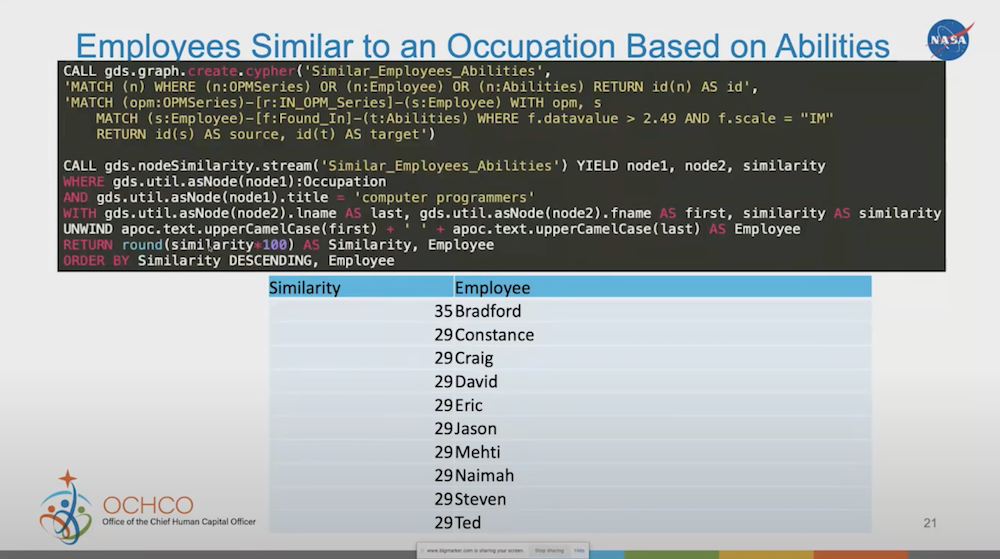
As we start fine tuning our work roles, through all the additional information we put in different classification, this will make it a lot easier for us to find the people that really match our goal, or at least understand when we’re missing goals or skills that we need to increase.
Conclusion
There are still a lot of other ways we can utilize knowledge graph and graph data science to find talents. There’s a lot of questions, as well, within people analytics of human capital that I think can be answered with graph databases. It’s a growing field, and I look forward to seeing what we can do with these types of new technologies.
Share Article


Explore
Related Articles

Neo4j Named “One to Watch” in Snowflake’s 2026 Modern Marketing Data Stack Report


1 of 3: The difference between a graph, a knowledge graph, and a context graph

2 of 3: Why graphs, knowledge graphs, and context graphs matter to customers