
Content Is Still King: How We Use Neo4j at Packt Publishing

Senior Data Analyst, Packt Publishing
8 min read
‘Content is King,’ Bill Gates famously said twenty years ago, making his prediction that soon ‘anyone with a PC and a modem can publish whatever content they can create’.
As time has gone by, this has only become more true. In 2016, the web hungers for more and more new content. Content marketing has become one of the most important parts of any digital business’ marketing strategy, regardless of industry. Whatever your business provides, publishing engaging, relevant content will increase the number of entry points for interested people to find you.
This is nowhere more apparent than in the industry I work for – digital publishing – where your content is your business. Once you have a visitor on-site, how do you keep them moving on down the ‘funnel’, and towards a recurring relationship with your business?
The key to solving this challenge is relevance.
So how do you provide relevance to visitors?
Having an array of similar pieces of content present somewhere on the page provides real value in terms of boosting engagement. This is essentially a recommendation based on one piece of content.
The more information you have about a user, the better the recommendation will be. If you have no data for a particular user (a cold start) you can bolster the list with new and popular results which are more likely to pique the interest of the ‘average’ visitor.
Centralised ‘hubs’ where you organise your content in a categorical and/or hierarchical manner provide the user with lots of content with a high degree of relevance. This approach originated in printed newspapers, but has become a widely used tool both for publishers and content aggregation sites.
Great examples of this can be seen on sites like Reddit (where the categorisation is done manually by the users) or Netflix (plenty has been written on the subject of their metadata generation process!).
At Packt Publishing, we have decided to pursue both of these avenues. We aim to make a more compelling experience for users discovering us for the first time and to boost engagement and retention amongst our existing user base.
It’s not just products either: We have a vast range of freely available technical blogs, editorial pieces, tutorials and extracts to categorise too. Six months ago, we began to recognise the benefit of the above forms of content linkage. The benefits to user engagement and satisfaction were obvious, but the way to achieve that goal was not.
The rest of this post is about how we approached this problem, which has manifested as our Tech Page Hub.
The Approach
Implementing categorisation and recommendation of content relies on having accurate metadata attached to all of your content. If you don’t have a robust strategy for generating metadata at the point of publication, manually tagging all your content can be a resource-intensive process and is prone to human error.
This is the position we found ourselves in when we embarked on this journey. Our category-level metadata was often too broad to really provide relevance to our users, and the keyword-level metadata was very narrow and often incorrect or simply unusable.
It was mooted that to do this effectively, and at scale, we would need an automated solution.
Put simply, any automated solution to this problem would start with some corpus of terms which represent with relations between closely connected topics. Then each piece of content would be scanned for mentions of those topics and tagged appropriately. Once this is done, you simply decide on the topics which will form your categories and decide on the hierarchy you will use to present the content within those topics.
Graph databases are a natural way to think about this problem, for many reasons. With a graph structure, you can represent arbitrary axes of information as nodes, and multifaceted relationships between those axes as edges.
Analysing connections between nodes becomes a trivial matter of defining traversals, and you are never constrained to think along only one dimension. Also, the extensible nature of a graph database schema means that you can add new dimensions of information in a very efficient way. You can prototype and test new parts of your schema rapidly and analyse the impact easily.
We opted to use Neo4j for this project for several reasons, two of the most important being:
- Query language: Cypher is an intuitive and expressive way to explore graph data
- Performance: To this day I am regularly astonished at the speed with which we can execute even very complex queries, and also the scalability of those queries to huge datasets
Methodology
The first thing we need is a domain-specific corpus of topics, with some notion of relation between the topics. Fortunately for us, an extensive, well-moderated and widely-used corpus already exists: StackOverflow.com tags.
Stack Overflow is the leading Q&A site for developers looking for answers to all manner of software problems. Questions on the site are tagged with one or more tags defining what subjects the problem covers.
This allows fantastic search, both for potential questioners and the community of experts looking to share their expertise. The tags are controlled by the community and moderated for consistency and usefulness.
There also exists a natural way to connect those topics. When two tags are tagged on the same question, that co-occurrence tells us those two topics are in some way related to each other (e.g., for the ‘neo4j’ tag, the most commonly co-occurring tags are ‘cypher’, ‘java’, and ‘graph-databases’). These relations are aggregated and available through the Stack Exchange API, making it a trivial matter to generate the entire network of topics in graph form.
We can make even more inferences about the domain by looking at the size of the nodes and edges. If the co-occurrence of two tags makes up 90% of the questions of tag A, but only 10% of tag B, we can infer directionality and start to build hierarchies and communities.
Putting the Pieces Together
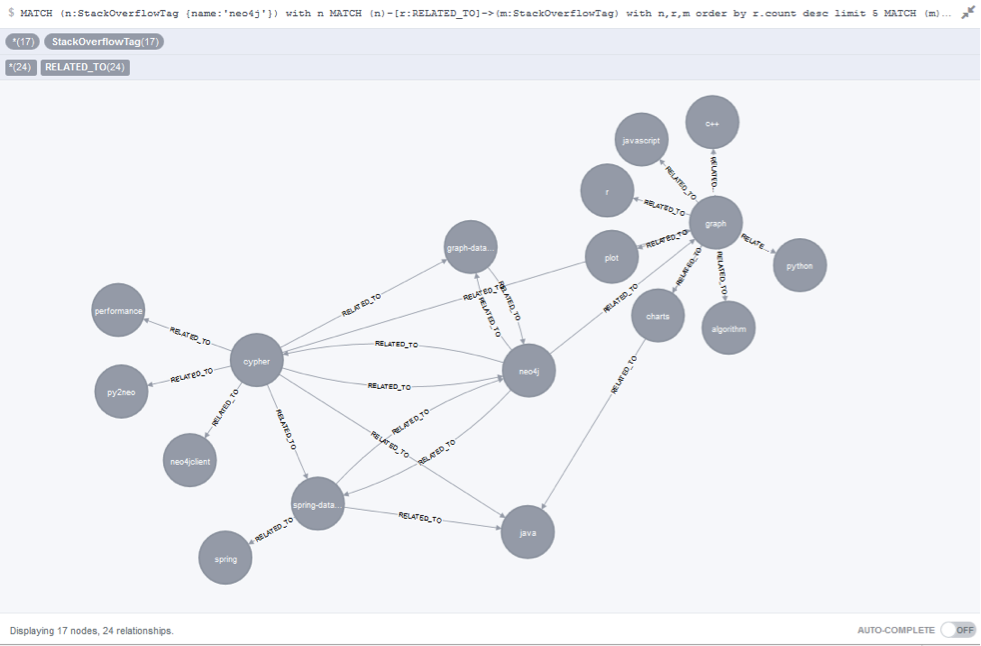
We used the API to get all the Stack Overflow tags into our graph as nodes, and their co-occurrences as edges:
A small extract of our Stack Overflow graph
The next step was to represent all of our content in the graph as nodes and represent all mentions of Stack Overflow tags as edges. I tried numerous different packages and solutions for this, and for now, I’ve settled on good old regular expressions in Python. Stack Overflow also provides lists of moderated synonyms for some tags, allowing us to capture even more information.
For a first pass, we used only the immediately available copy. For products, this was the copy on the website (already a keyword-dense summary), and for articles this meant the whole content of the article. Initially, we quantify the relationships by putting the raw term frequency onto the edge.
Just like that, all our content has domain-specific tags attached. We can immediately start doing traversals to look at how things are connected:

A subgraph of the local network surrounding our popular Learning Neo4j book
From what we have so far, we can immediately start making product recommendations and looking at how our content could be categorised. However, there are still some pieces missing.
Firstly, it would make no sense to generate category pages for all of the tags in our graph. The tags provide the basis for our categorisation, but we still need a cleaner, more hierarchical network in order to define specific areas of interest. For this we have implemented an ontology of Topic nodes, which sit alongside of the network of Stack Overflow tags. This allows us to extend the ontology by classifying the latent connections in the Stack Overflow network.
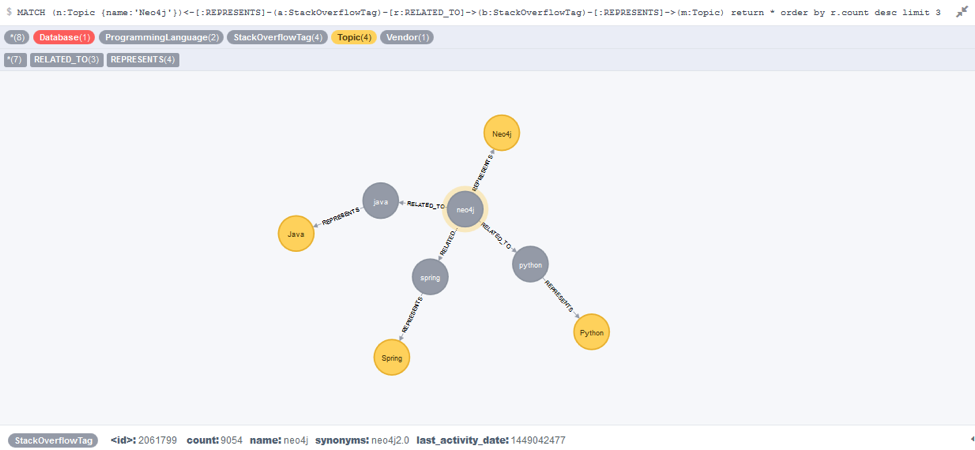
A demonstration of the ontology sitting alongside the Stack Overflow network
This provides us with the high-level categories we desire, and from there, it’s a matter of defining the logic which connects content to a topic.
Secondly, tag frequencies are famously bad metrics of information. We need to move from COPY_MENTIONS edges to IS_ABOUT edges. For this we turn to metrics such as tf-idf and topic size, as well as graph theoretic measures such as centrality. This gives us a much more fine-grained picture of what our content is about.
Finally, in recommendation terms, we have content filtering but we are yet to add collaborative filtering. We are still basing our relationships on what Stack Overflow views as connected, not usage patterns from our actual customers.
I’ll discuss the solutions to all of these new problems in my talk at GraphConnect Europe on 26 April!
In Production
Once we have all these pieces in place, we’re able to generate our category pages.
Our graph sits behind a web service, which gets called whenever a tech page is rendered. The web service calls a particular set of Cypher queries and returns a list of content IDs, in various blocks, as defined by the design of the page. This approach gives us flexibility in a number of key areas.
The graph replicates information from our CMS, so the queries can fully define what information to display and in what order. This means all the heavy lifting of dynamic recommendations is done by the graph, not by the CMS.
The construction of the web service is modular, allowing us to change the Cypher queries’ underlying blocks on the page easily, to test new ideas or weightings.
Editors also have control over ‘featured’ content, so we can give prominence to certain pieces. The beauty of this is that, for example, if we decide to feature an article about Machine Learning in Python, this will automatically be featured on the Machine Learning page, the Python page and the Data Science page.
That’s the central point of this post: Using graphs has allowed us to make everything dynamic right from the start. IF we so wished, we COULD make a category page for each and every Stack Overflow tag.
Most of them would be empty, and some of them would be far too full, but the website wouldn’t even stutter. The scalability of tech pages is only limited by the scale of our content, not by the technology we implement; this is a great place to be.
Conclusion
This post has described just one aspect of how we use graphs at Packt. Tech pages are a great demonstration of how the flexibility of a graph allows for very dynamic categorisation, but there’s a lot more to this story, and a lot of questions yet to answer.
The steps I’ve discussed above have been a catalyst for many more interesting ideas, and Neo4j has allowed us to develop really interesting solutions for our customers. Join me at GraphConnect Europe, where I’ll be talking about the journey we’re on at Packt, and the ways in which graphs have revolutionised the way we think about our customer experience.
Want to hear more from Greg Roberts on building a content recommendation engine? Click below to register for GraphConnect Europe on 26 April 2016 – and we’ll see you in London!
Share Article


Explore
Related Articles


Integrating Neo4j With Symfony: Profiling Queries and Centralized Logging

What Are the Different Types of Graph Algorithms & When to Use Them?
