Posts By
Dan Williams
Product Manager, Cambridge Intelligence
Dan Williams works closely with Cambridge Intelligence customers who are building advanced graph applications, helping them to make the best possible graph visualization tools. He has a Master’s in Physics from Oxford University and a wealth of experience with a variety of software products across many different industry verticals.

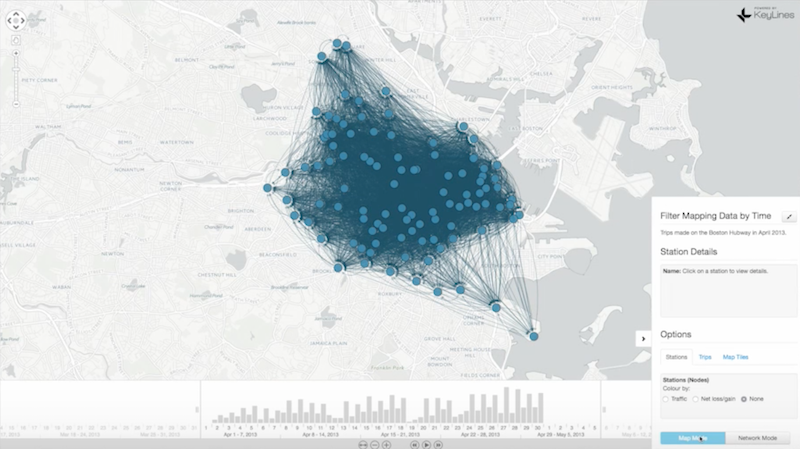
Graphs in Time and Space: A Visual Example
6 min read
Mapping a Connected World: The Value of Geospatial Graph Visualization
6 min read
5 Ways to Tackle Big Graph Data with KeyLines and Neo4j
6 min read