

A workbench for teams to query, explore, and visualize graph data
3 min read


15 best graph visualization tools for your Neo4j graph database
15 min read

NeoDash 2.4: Unleashing the power of Neo4j graph dashboards
5 min read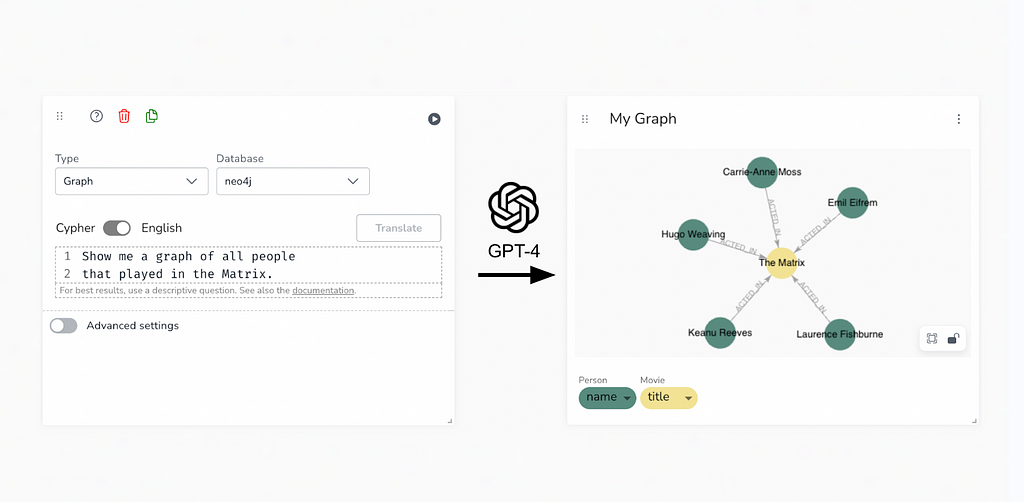
NeoDash 2.3: Create graph dashboards with LLM-powered natural language queries
6 min read
Using Neo4j Fabric for scalable fraud detection on graphs
3 min read
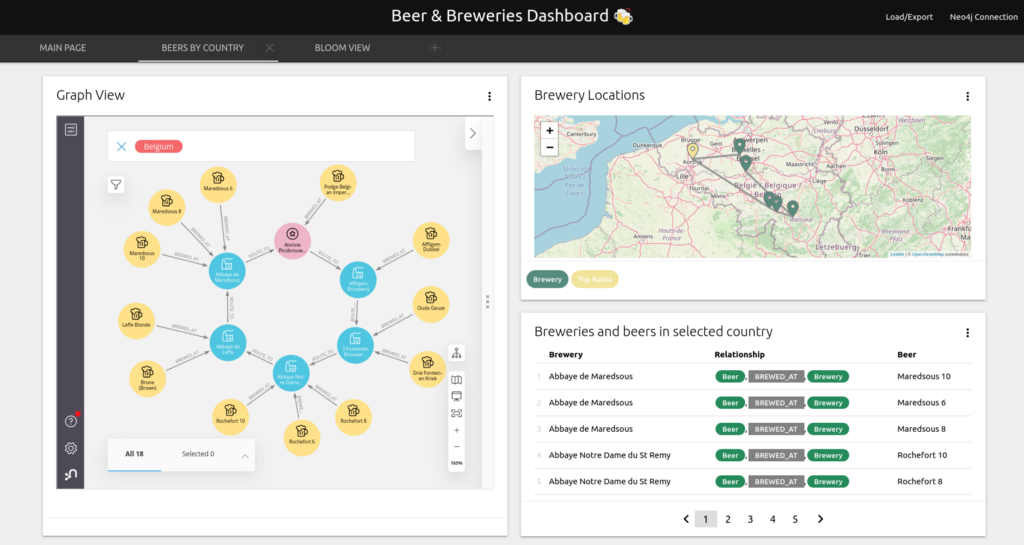
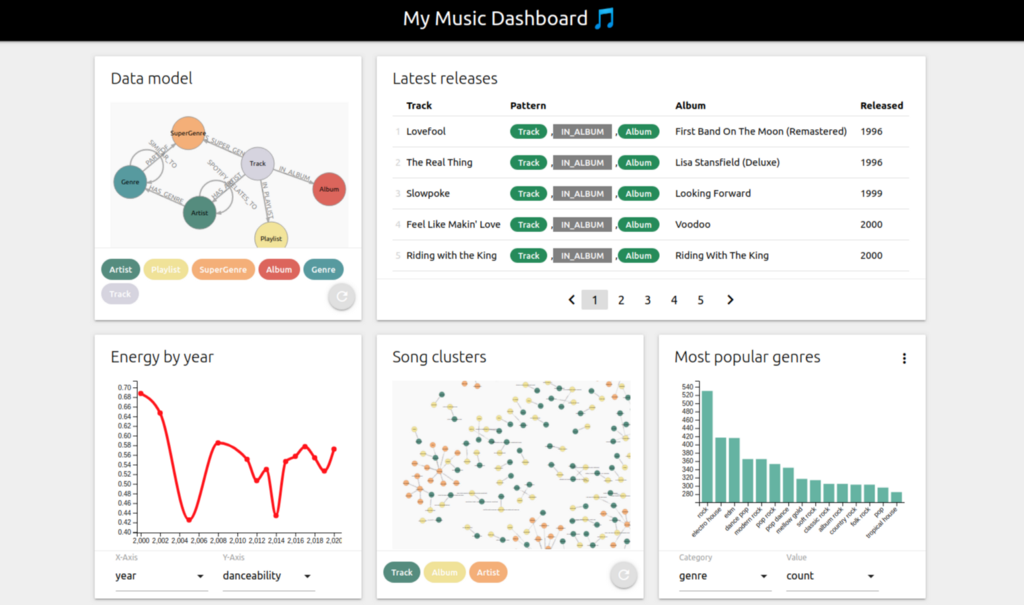
NeoDash: Build Neo4j dashboards without writing any front-end code
6 min read