
CyGraph: Cybersecurity Situational Awareness That’s More Scalable, Flexible & Comprehensive

Cybersecurity Researcher, MITRE
5 min read
Preventing and reacting to attacks in cyberspace involves a complex and rapidly changing milieu of factors, requiring a flexible architecture for advanced analytics, queries and graph visualization.
Information Overload in Security Analytics
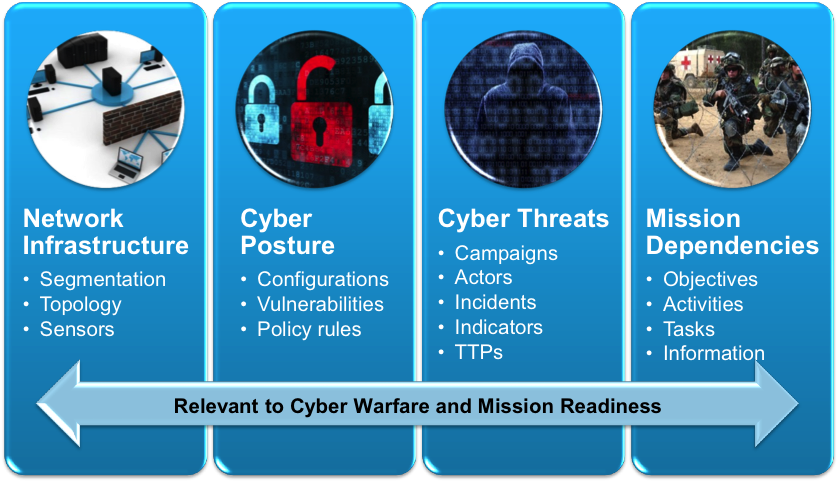
Cyber warfare is conducted in complex environments, with numerous factors contributing to attack success and mission impacts. Network topology, host configurations, vulnerabilities, firewall settings, intrusion detection systems, mission dependencies and many other elements all play important parts.
To go beyond rudimentary assessments of security posture and attack response, organizations need to merge isolated data into higher-level knowledge of network-wide attack vulnerability and mission readiness in the face of cyber threats.
Network environments are always changing, with machines added and removed, patches applied, applications installed, firewall rules changed, etc., all with potential impact on security posture. Intrusion alerts and anti-virus warnings need attention, and even seemingly benign events such as logins, service connections and file share accesses could be associated with adversary activity.
The problem is not lack of information, but rather the ability to assemble disparate pieces of information into an overall analytic picture for situational awareness, optimal courses of action and maintaining mission readiness.
CyGraph: Turning Cybersecurity Information into Knowledge
To address these challenges, researchers at the MITRE Corporation are developing CyGraph, a tool for cyber warfare analytics, visualization and knowledge management.
CyGraph brings together isolated data and events into an ongoing overall picture for decision support and situational awareness. It prioritizes exposed vulnerabilities, mapped to potential threats, in the context of mission-critical assets.
In the face of actual attacks, it correlates intrusion alerts to known vulnerability paths and suggests best courses of action for responding to attacks. For post-attack forensics, it shows vulnerable paths that warrant deeper inspection.

CyGraph incorporates an attack-graph model that maps the potential attack paths through a network. This includes any network attributes that potentially contribute to attack success, such as network topology, firewall rules, host configurations and vulnerabilities.
The dynamically evolving attack graph provides context for reacting appropriately to attacks and protecting mission-critical assets. CyGraph then ingests network events such as intrusion detection alerts and other sensor outputs, including packet capture.
It also incorporates mission dependencies, showing how mission objectives, tasks and information depend on cyber assets.

Leveraging Big Data Architecture
In the CyGraph architecture, the model schema is free to evolve with the available data sources and desired analytics, rather than being fixed at design time.
The data model is based on a flexible property-graph formulation implemented in Neo4j, a NoSQL database optimized for graphs. Model extensions are simply the creation of additional of nodes, relationships and properties in the property-graph data model, and they require no schema changes or other database renormalizing.

Relational databases work well for referencing fixed relationship patterns, e.g., bank customers to their accounts. But the relational model has difficulties when the relationships themselves are variable, as in cybersecurity.
Graph databases have been shown to be orders of magnitude faster than relational databases for such graph-centric problems. Unlike most NoSQL databases, Neo4j enforces the ACID properties for databases (atomicity, consistency, isolation and durability).
In CyGraph, REST web services provide interfaces for data ingest, analytics and graph visualization. Data in the wild are mapped to the common CyGraph data model.
This is a two-part process, in which data are first normalized and stored in a document-oriented database (MongoDB) and then represented as a graph in Neo4j.
The Neo4j native graph pattern-matching language supports a library of domain-specific queries as well as flexible ad hoc queries. CyGraph then provides a variety of clients for specialized analytic and visual capabilities, including graph dynamics, layering, grouping/filtering and hierarchical views.

Cyber Dynamics
CyGraph provides insight into the mission impact of cyber activities. In the CyGraph property-graph formalism, graph layers (network infrastructure, cyber defensive posture and threats, mission dependencies, etc.) define subsets of the overall model space, with relationships within and across each layer.
CyGraph clients can visualize these graph layers independently or can show layers combined. The visualizations also show the dynamic state changes of the model layers, e.g., through sensor log playback or simulation engines.
For example, cyber exploitation of a network machine is shown to have an impact on mission elements that depend on it.

Leveraging On-Hand Sources to Build a Common Operating Picture for Situational Awareness
In cybersecurity, each element of a network environment has the potential to impact many other things. Security scanning and monitoring tools give specific readings based on their own specialized focus.
But since everything potentially impacts everything else, CyGraph combines these disparate data points into a unified knowledge base for global situational awareness.
A key CyGraph design feature is to leverage existing tools and data sources for populating this knowledge base (e.g., topology maps, vulnerability scans, firewall configurations, sensor logs, packet captures and mission dependencies).
For example, CyGraph leverages the government off-the-shelf Topological Vulnerability Analysis tool for mapping vulnerability paths from network topology, vulnerability scans and firewall rules. It also leverages MITRE’s Cyber Command System and Crown Jewels Analysis for building mission dependencies.

CyGraph leverages various security standards such as Common Vulnerabilities and Exposures (CVE) for known vulnerabilities, Common Vulnerability Scoring System (CVSS) for vulnerability scoring and categorization, Common Weaknesses Enumeration (CWE) for software weaknesses and Common Platform Enumeration (CPE) for vulnerable software versions.
For example, many vulnerability scanners are CVE compliant, and the National Vulnerability Database maintained by National Institute of Standards and Technology reports CVSS scores, CWE weaknesses and CPE software versions for each CVE vulnerability.
CyGraph’s comprehensive knowledge base tells a much more complete story than that of basic attack graphs or mission dependency models. CyGraph includes potential attack-pattern relationships that fill in gaps between known vulnerabilities and threat indicators.
This ability to discover vulnerability paths between alerts is especially important because often only portions of overall adversary activities are alerted. In this way, CyGraph addresses the problem of missing alerts and extrapolates observed attacker presence to trace attack origins and next possible steps.
This context gives the best options for response, especially for protecting cyber key terrain, providing global awareness of security posture and mission readiness.
The CyGraph knowledge base provides a rich framework for exploring the full stack of entities and relationships relevant to mission readiness in the face of cyber threats. While the CyGraph knowledge base for an environment is potentially large and complex, it is not necessary to view the entire knowledge graph at once.
A key analytic strategy is to provide a library of common cybersecurity queries that answer specific analytic questions as well as support custom ad hoc queries that narrow analytic focus.
Learn More at GraphConnect San Francisco
Attend my upcoming talk at GraphConnect, and we will explore how CyGraph helps minimize organizations’ exposure to potential cyber attacks and optimizes their responses to actual attacks, all within the context of protecting their most critical cyber assets.
Learn more about my upcoming talk here.
Click below to register for GraphConnect San Francisco and join Steven Noel and many other graphistas at the world’s leading graph database conference.
Share Article


Explore
Related Articles


Top 10 Graph Database Use Cases (With Real-World Case Studies)

15 Best Graph Visualization Tools for Your Neo4j Graph Database

