
Data Management in Systems Biology and Medicine

Researcher, European Institute for Systems Biology & Medicine (EISBM)
9 min read

Editor’s Note: This presentation was given by Irina Balaur at GraphConnect Europe in April 2016. Here’s a quick review of what she covered:
–
What we’re going to talk about today is how the European Institute for Systems Biology and Medicine (EISBM) uses Neo4j for data management in systems biology and medicine:
EISBM is working to speed up the transfer of results obtained through systems biology approaches to industry and routine patients by studying life complexity through trans-disciplinary approaches. Our team is composed of biologists, computational biologists, physicians, mathematicians and engineers working together on a variety of joint, long-term projects.
Our focus is personalized medicine, meaning our research is participatory, predictive, personalised and preventative. We have partners in Europe from both academia and industry domains with whom we work to boost global public health.
Some of our recent projects include the Coordinating Action Systems Medicine (CASYM) project, Unbiased Biomarkers in Predication of Respiratory Diseases Outcomes (U BIOPRED) and a project I’m currently working on, European Translational Information and Knowledge Management Services (eTRIKS).
Integrating Data for Translational Medicine Informatics
Let’s start with translational medicine. Recently, there was a perspective paper in The New England Journal of Medicine about a $215 million initiative to collect genomics data from one million people. In the UK, an initiative is underway by Genomics England to collect multi genomics data and sequence 1,000 genomes with a focus on cancer and rare diseases.
These initiatives are motivated by the requirements of developing a new taxonomy of diseases. Different diseases are essentially seen as a collection of single conditions, when more accurately they represent a group of disease sub-type. And the new taxonomy proposes looking at disease based on molecular features rather than clinical symptoms, which is made possible due to the cheaper collection of genomics data. This will move medicine from reactive to proactive, with a new focus on identifying the transition between wellness and disease.
While it’s important to have translational medicine informatics, there are a some associated challenges, the first of which is integrating multiple genomics and clinical data, which could be helpful for the discovery of disease subtypes. For example, there are 100 subtypes of asthma, and we want to explore these subtypes to guide therapeutic intervention and treatment pathways that will allow for more individualised treatment.
One of the biggest challenges with translational medicine informatics is developing a platform that facilitates the storage, mining, analysis, visualisation and exploration of a large patient dataset. Without such a platform, there are a number of challenges, including: while sequencing a genome is affordable, the data analysis and interpretation is very expensive; it’s difficult for biologists and clinicians to share data; it’s more difficult to gain insights into subtypes of disease; and it’s more difficult to find hidden associations between different concepts:

eTRIKS is a large European collaborative project between research, academia and pharmaceutical companies. And while we are in the age of “big data,” the utility of bio-data sets depends on the appropriate methods for data collection, management, and sharing.
One of the main components of eTRIKS is as a repository for curated datasets as well as an ecosystem for data analytics, which focusses on disease and target identification. Additionally, eTRIKS pays close attention to ethical and legal issues related to patient involvement.
eTRIKS Data Architecture: Incorporating a Graph Database
Below is the eTRIKS data architecture:
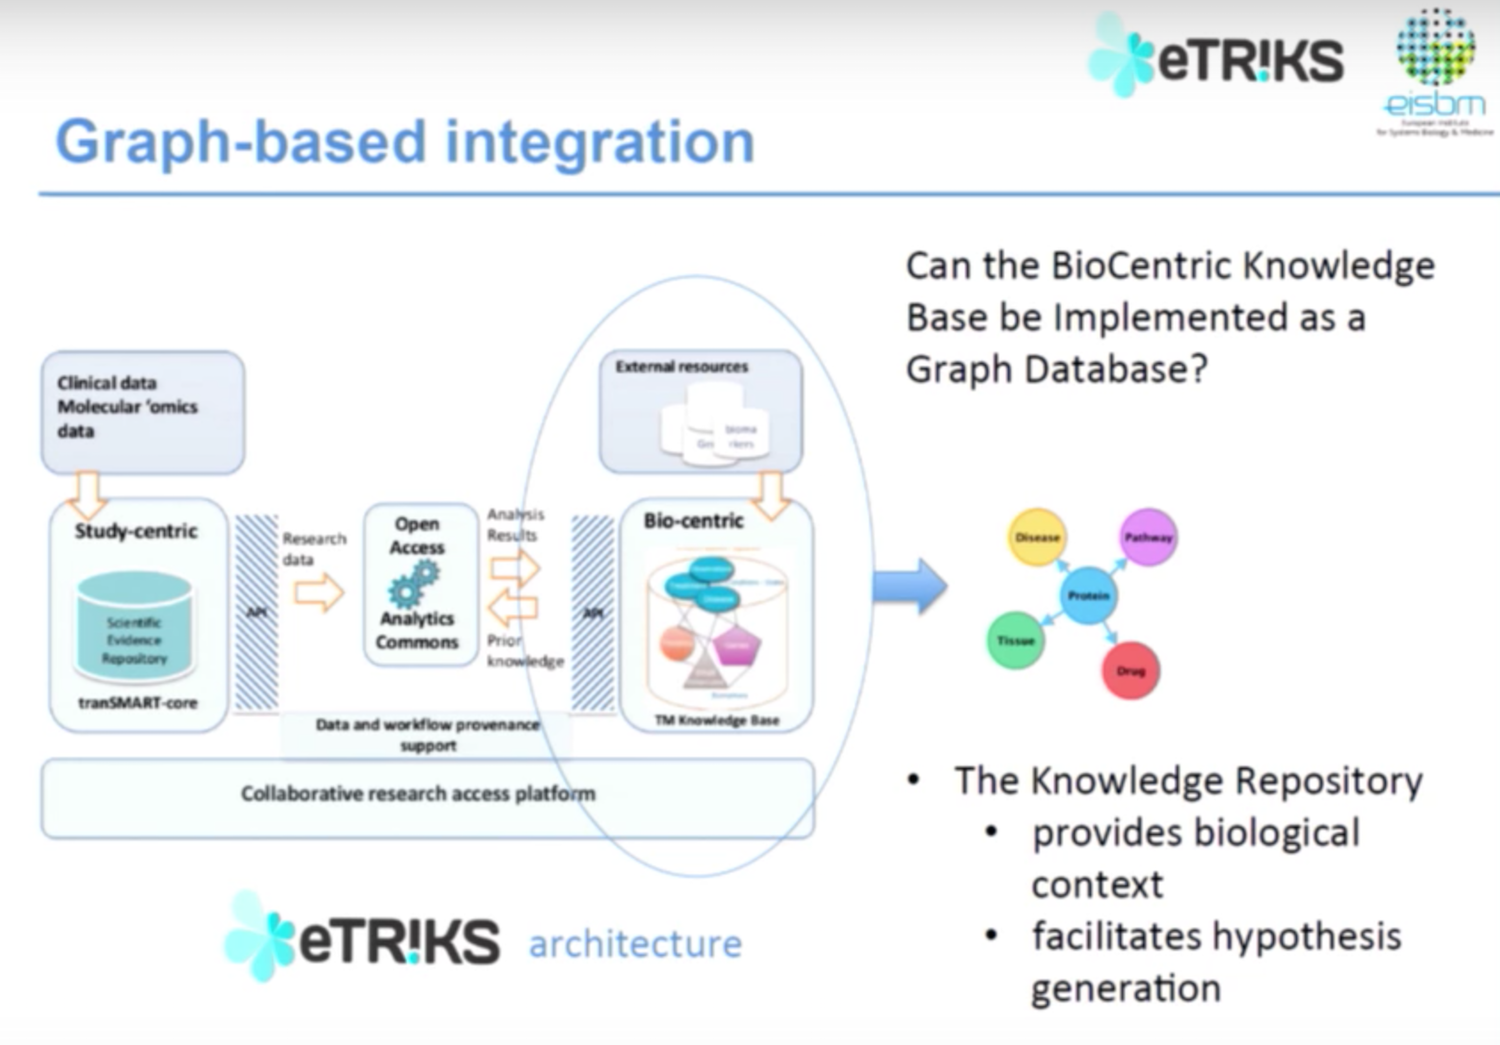
We have both clinical and multi genomics data, which is open access via different tools. These tools then communicate with the knowledge-based representation from external resources and brings data back into the system. Our question was: could we use a graph database approach to represent information in the biocentric knowledge database to give us information about biological context of diseases and facilitate hypothesis generation?
There are a number of advantages of graph databases for biomedical data, the first of which is that biomedical data is highly connected. There are many relationships, but the amount of information associated with any given entity is not uniform.
Biomedical data is also unpredictable; right now we’re working with genomics data, but who knows what type of data we’ll be able to collect in a few months or a few years. And finally, we need to infer associations between different concepts to move closer towards understanding disease mechanisms.
Below is an overview of how we arrange and develop an ecosystem for systems biology and medicine:
We follow a multi-scale approach, starting with what makes up metabolites, proteins and epigenetics, then up to disease, context and pathways; and finally up to patient information. We integrate data from major international research organizations like Reactome, Human Protein Atlas, Drug Bank and others. For the knowledge representation base we are using Neo4j and Cypher queries.
When I’m referring to data management, I’m not only talking about data integration; I’m also talking about data exploration and visualisation. We use Neo4j in combination with Java, R and NetworkX, and may share networks using NDEx, which is a platform for network community sharing. For biological and clinical standards, we work with SBML and CDISC.
The Data Model: Protein Framework
We call our data model the protein framework because it’s very protein-centric:

Each node represents a different concept. A protein can be a biomarker for a certain disease, or it can belong to a pathway, be the target of a drug, or can have an interaction or similarities with another protein.
Below is an example of how we use the protein framework for contextual information. We want to query and explore which drugs are associated with a certain protein that also have sequence similarity with asthma biomarkers. The below includes information integrated from a variety of sources, such as drug banks:

The node at the center represents asthma and the selected blue protein is a reported biomarker for asthma. That protein has a sequence similarity with another protein, which happens to be the target of certain drugs.
As a caveat, we can’t say with 100% certainty that these drugs will target asthma, but it is a reasonable hypothesis. However, the Cypher query at the bottom is very declarative, so people can understand it: where is asthma, what type of relationships I’m looking for, and what concepts are involved.
Using Neo4j to Unmask Hidden Data Relationships
We also use the protein framework for link discovery:

To address the fact that there was a number of genes associated with asthma that had either no known function or no function that seemed to correlate with the disease, we consulted clinicians who are experts in respiratory diseases. They were interested to see the relationships and associations between clock genes, which control the circadian rhythm, and asthma.
In the above example, we are looking at the different biomarkers of asthma, which are highly well-replicated proteins. This also shows the protein-protein association with its “clock gene” neighbours.
As I mentioned earlier, the graph database accommodates new types of data. We had already developed a protein framework when we saw the Cornish 2015 paper, which contains information on cell-specific interactions. With this new information available, we added it to our graph database.
Integrating New Types of Data
In the below example we have a genetic PPI, protein-protein interaction. While here, for example, I had more information taken from this paper about what is the protein-protein interaction in a specific epithelial or macrophage cell:
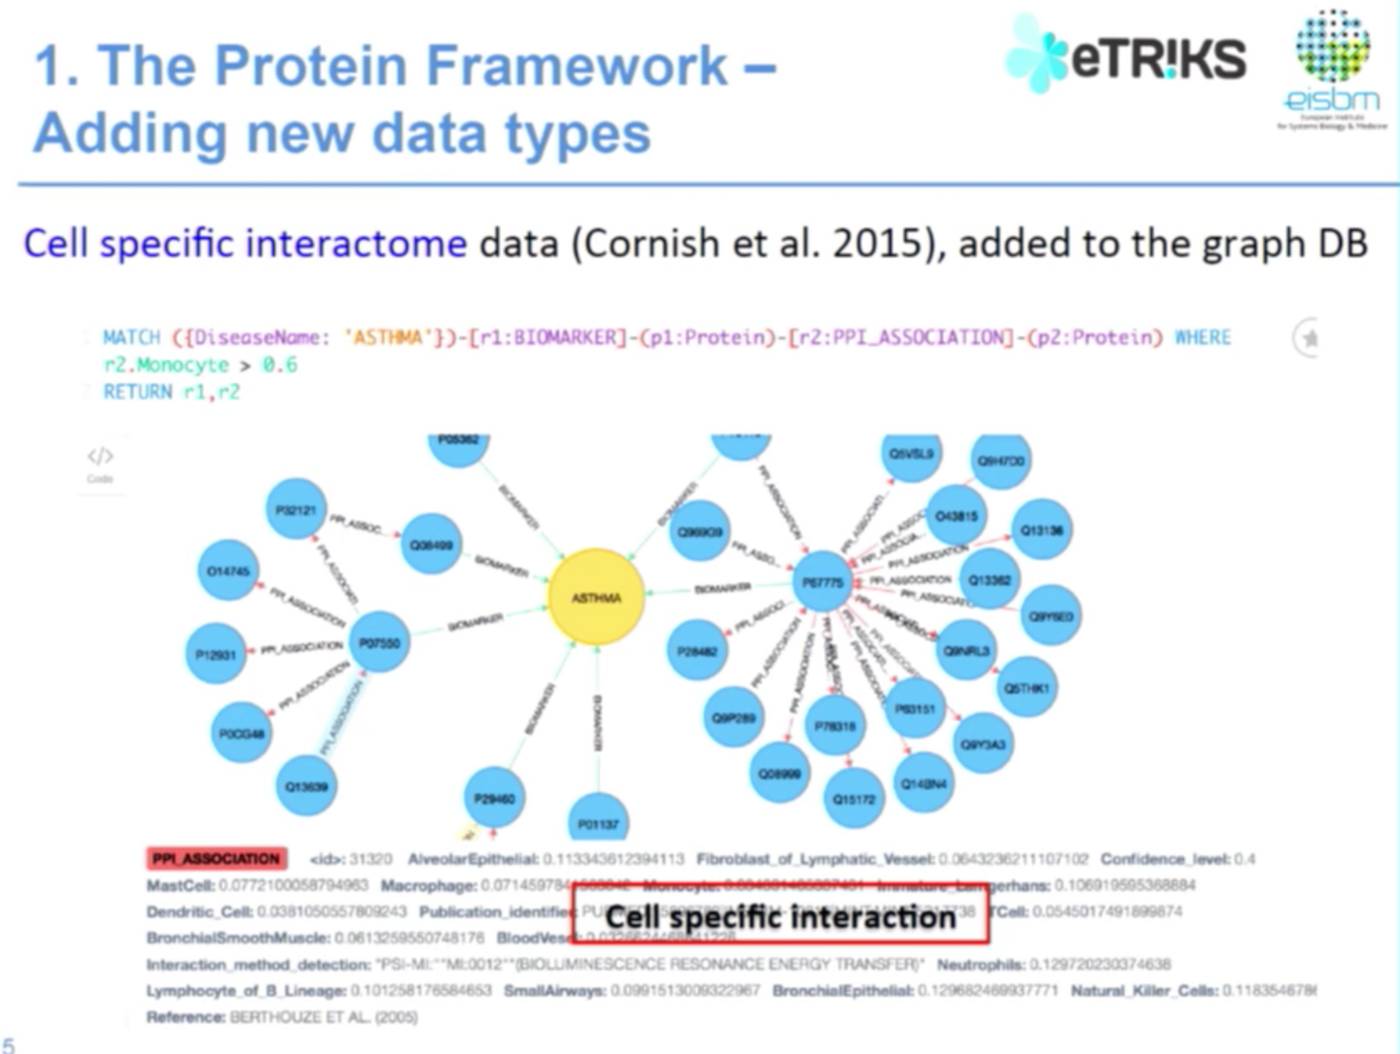
We use Java to develop, import and integrate data into the Neo4j framework. Currently we have approximately 20,000 protein nodes and 92,000 relationships, and Neo4j works really well.
Metabolic-Centric Framework: Converting XML Data
The second component of our database is a metabolic-centric framework, which has integrated data from ReconX — the most comprehensive human metabolism reconstruction information available in flat files stored in SBML standard format. However, in its XML format, it’s incredibly difficult to actually make use of the data.
Some of our colleagues were interested in exploring arachidonic acid, which is involved in respiratory diseases, so we created the following model by importing the data from SBML into Neo4j. This is a small example limited to 14 nodes, but we have 9,700 species each with their own proteins and metabolites:

Our colleagues were really happy with this model, so we shared it more widely in the community and eventually at conferences. Eventually our colleagues asked that we make the information available in CellDesigner, a well-established framework in the biology community. To do so, we developed a Java-based parser to take the JSON output from Neo4j, translate it back to SBML and import it into CellDesigner, which is displayed as follows:

In this more familiar format, our colleagues, clinicians and biologists were happier about sharing the information. From here we use NDEx, and we developed another component of the same parser that translates JSON format to NDEx, and then to Cytoscape.
Epigenetics Data: Exploring Conditional Probabilities
The third component of our work is data on epigenetics, which is the alteration in chromatin structure that affects gene expression but not the DNA sequence. This includes DNA methylation, histone modification and non-coding RNAs.
The StatEpigen database examines the conditional probabilities between genetic and epigenetic interdependence in Bayesian network format. So it’s basically saying that APC hypermethylated given MLH1 methylated is a probability of 0.89, for example, where I could look here in carcinoma stage of colon cancer:
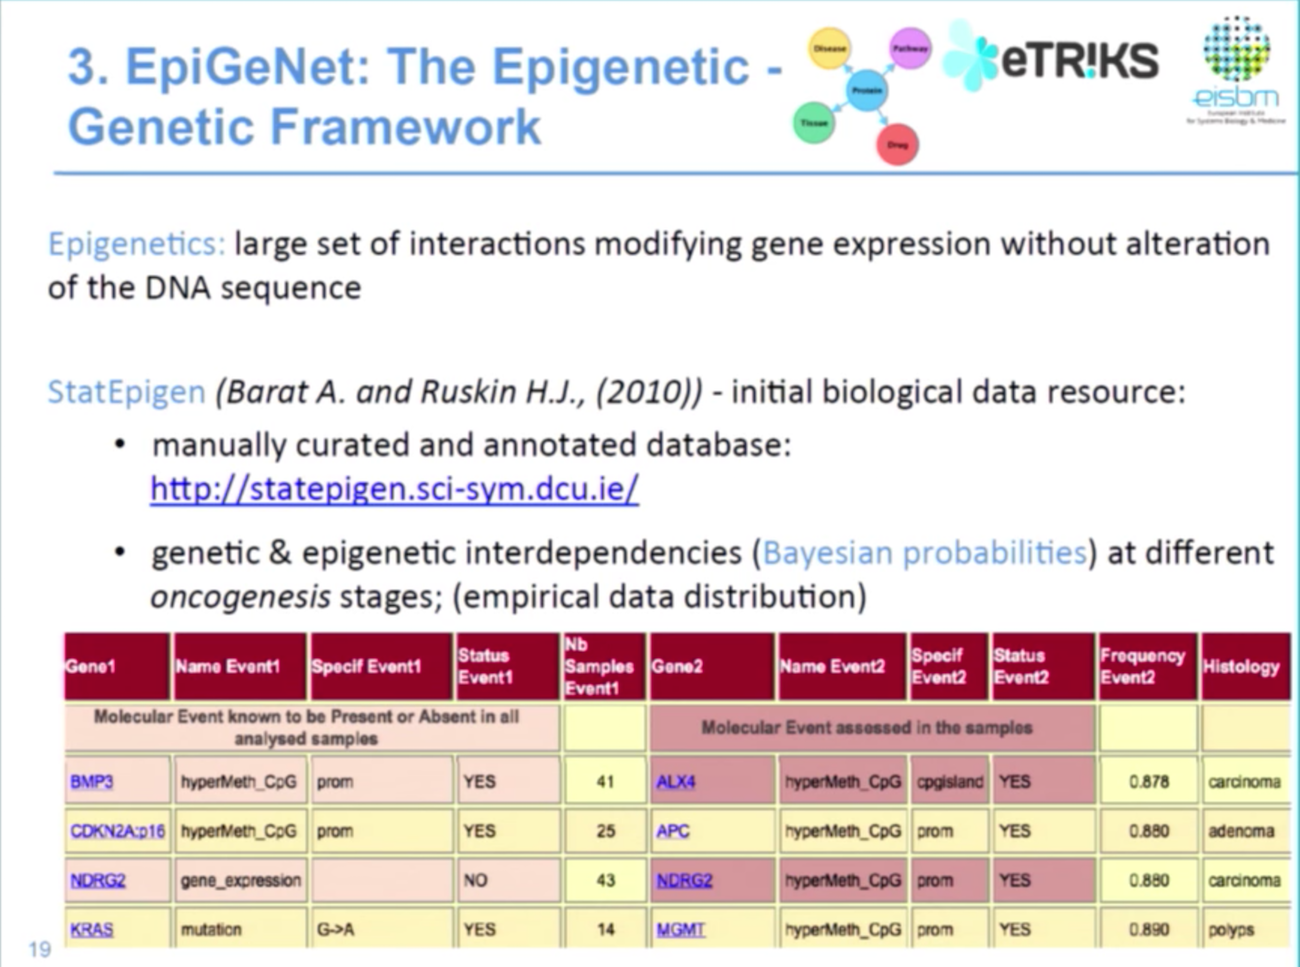
Because this is a conditionality data model, we wanted to see if we could do more to infer in future computational modelling. Below is a small sub-network that shows the probability for MLH1 hypermethylated to have a KRAS mutation.
The type of edge gives information on the oncogenesis stage, while the probability value is an attribute of the edge. And the epigenetic framework can be used to identify highly connected molecular events. So, for example, we know that MLH1, KRAS, APC are key genes in colon cancer development — but what about other genes?

This also allows us to do an exploration of the most plausible pathway connected to major events. We want to extend this framework with data on causality if such data becomes available. Such a representation can inform further computation modelling and Bayesian network-based approaches.
Using Neo4j for Data Visualization
The fourth component of our work aims to apply the graph database approach to represent clinical data in the clinical standard format in order to facilitate data visualisation and the exploration of clinical and biomarker data. We are exploring the therapeutic area of asthma, which will be used to generate hypotheses for the development of analysis data models.
We faced a number of challenges here because the clinical data is represented by a large set of parameters, which makes the graph model anything but trivial. We use an integrative approach and started with several domains, but we plan to include more domains like demographic, laboratory and medical history.
Below is a visualization that represents a laboratory test:

All of these labels are in CDISC terms in order to be in compliance with CDISC representation. However, there were no standard terms for relationships, so we needed to define those.
Conclusion
In conclusion, our work is all part of a multi-scale approach for using graph databases for data management in systems biology and medicine. I started with translational medicine, which — with respect to diverse multi genomics data — allows a scientist or clinician, with limited computational skills, to connect multiple layers of patient-specific information to arrive at a more informed prognosis. We then moved from epigenetics to metabolites, all the way up to the patient level.
We use Neo4j as well as Cypher, which we found very expressive. The graph also provides a nice visual data exploration; however, developing the graph database is not trivial because it involves connecting different layers of information about systems biology. It has also been somewhat challenging to provide accessibility for biomedical and clinician scientists.
I would like to acknowledge my colleagues from EISBM, our colleagues from Centre de Calcul in Lyon, and to acknowledge access to Neo4j and databases that we use for data integration. I would also like to acknowledge financial support for the eTRIKS Project (IMI n° 115446).
Share Article


Explore
Related Articles


Text2Cypher Across Languages: Evaluating Foundational Models Beyond English


