Data profiling: A holistic view of data using Neo4j

Field Engineer, Neo4j
9 min read
Summary
Data profiling is a widely used methodology in the relational database world to analyse the structure, contents and metadata of a data source. Generally, data profiling consists a series of jobs executed upon the data source to collect statistics and produce informative summaries about the underlying data.
As a general rule, data evolves along the time. After some years, the actual data stored and used in a database may vary significantly from what people think it is, or what the database was designed for at the beginning. Data profiling helps not only to understand anomalies and assess data quality, but also to discover, register and assess enterprise metadata.
The Neo4j graph database is the best for analysing connected, high-volume and variably structured data assets, which makes data profiling more critical as it would help us obtain better understanding of the data, identifying hidden patterns more easily, and potentially improving query performance.
This article will share practical data profiling techniques using the Cypher graph query language.
The following are system requirements:
- Neo4j Graph Database version 3.2.x, either Community or Enterprise Edition, Linux or Windows (I use Windows 10)
- Internet browser to access the Neo4j Browser (I use Chrome)
- A graph database. Here I imported data from the Stack Overflow Questions dataset, which contains more than 31 million nodes, 77 million relationships and 260 million properties. The total database size on Windows 10 is about 20 GB.
All of the Cypher scripts and outcomes – mostly screenshots – are executed inside the Neo4j Browser, unless specified otherwise.
1. Database schema analysis
Database schema analysis is usually the first step of data profiling. The simple purpose of it is to know what the data model looks like and what objects are available.
Note: for most of the scripts used in this section, you can find them in Neo4j Browser, under the menu Favorites > Data Profiling.
1.1 Show the graph data model (the meta model)
Cypher script:
// Show what is related, and how (the meta graph model)
CALL db.schema()
Outcome

Description
The Stack Overflow database has three nodes:
- User
- Post
- Tag
And it has four relationships:
- User
POSTEDPost - Post
HAS_TAGTag - Post is
PARENT_OFPost - Post
ANSWERanother Post
1.2 Show existing constraints and indexes
Cypher script:
// Display constraints and indexes
:schema
Outcome
Indexes
   ON :Post(answers) ONLINE
   ON :Post(createdAt) ONLINE
   ON :Post(favorites) ONLINE
   ON :Post(score) ONLINE
… …
Constraints
   ON ( post:Post ) ASSERT post.postId IS UNIQUE
   ON ( tag:Tag ) ASSERT tag.tagId IS UNIQUE
   ON ( user:User ) ASSERT user.userId IS UNIQUE
Description
Indexes tell us the properties that will have the best query performance when used for matching.
Constraints tell us the properties that are unique and can be used to identify a node or relationship.
1.3 Show all relationship types
Cypher script:
// List relationship types
CALL db.relationshipTypes()
Outcome
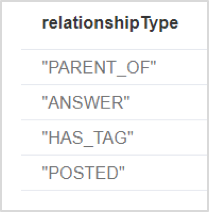
Description
A list of available relationship types.
1.4 Show all node labels / types
Cypher script:
// List node labels
CALL db.labels()
Outcome
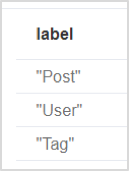
Description
A list of available node labels / types.
1.5 Count all nodes
Cypher script:
// Count all nodes
MATCH (n) RETURN count(n)
Outcome
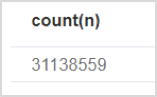
Description
It only takes 1ms for Neo4j to count 31 million plus nodes.
1.6 Count all relationships
Cypher script:
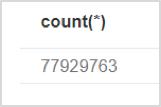
// Count all relationships
MATCH ()-[r]->() RETURN count(*)
Outcome
Description
Again, it only takes 1 ms for Neo4j to return the total number of relationships.
1.7 Show data storage sizes
Cypher script:
// Data storage sizes
:sysinfo
Outcome

1.8 Sample data
Cypher script:
// What kind of nodes exist
// Sample some nodes, reporting on property and relationship counts per node.
MATCH (n) WHERE rand() <= 0.1
RETURN
DISTINCT labels(n),
count(*) AS SampleSize,
avg(size(keys(n))) as Avg_PropertyCount,
min(size(keys(n))) as Min_PropertyCount,
max(size(keys(n))) as Max_PropertyCount,
avg(size( (n)-[]-() ) ) as Avg_RelationshipCount,
min(size( (n)-[]-() ) ) as Min_RelationshipCount,
max(size( (n)-[]-() ) ) as Max_RelationshipCount
Outcome

You may have noticed the first line of the script – MATCH (n) WHERE rand() <= 0.1 effectively chooses 10% (0.1) of the total nodes for sampling. Changing this value would change the sample size (e.g., using 0.01 uses 1%).
2. Node analysis
Node analysis is more or less similar to table and column analysis for the profiling of a relational database (RDBMS). The purpose of node analysis is to reveal facts about nodes, as well as properties of nodes.
2.1 Count nodes by their labels / types
Cypher script:
// List all node types and counts
MATCH (n) RETURN labels(n) AS NodeType, count(n) AS NumberOfNodes;
Outcome

Description
Node counting gives a clearer idea of the volume of each type of the node in a database.
2.2 Property analysis
2.2.1 List all properties of a node
Cypher script:
// List all properties of a node
MATCH (u:User) RETURN keys(u) LIMIT 1
Outcome

2.2.2 List all properties of a relationship
Cypher script:
// List all properties of a relationship
MATCH ()-[t:POSTED]-() RETURN keys(t) LIMIT 1
Outcome
There is no property for the relationship.
2.2.3 Uniqueness of the property
Cypher script:
// Calculate uniqueness of a property
MATCH (u:User)
RETURN count(DISTINCT u.name) AS DistinctName,
       count(u.name) AS TotalUser,
       100*count(DISTINCT u.name)/count(u.name) AS Uniqueness;
Outcome

Description
It seems 78% of the user names are unique. A property having unique values can be a good candidate as the ID.
2.2.4 Nullability of the property
Cypher script:
// Calculate nullability of a property
MATCH (u:User) WHERE u.name IS null RETURN count(u);
Outcome
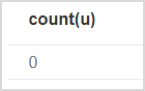
Description
There is no empty value for property Name of node User.
2.2.5 Min, max, average and standard deviation of the values of a property
Cypher script:
// Calculate min, max, average and standard deviation of the values of a property
MATCH (p:Post)
RETURN min(p.favorites) AS MinFavorites,
       max(p.favorites) AS MaxFavorites,
       avg(p.favorites) AS AvgFavorites,
       stDev(p.favorites) AS StdFavorites;
Outcome

2.2.6 Occurrences of values of a property
Cypher script:
// Find out most often used values for a property
MATCH (p:Post)
RETURN p.answers AS Answers, count(p.answers) AS CountOfAnswers
ORDER BY Answers ASC;
Outcome
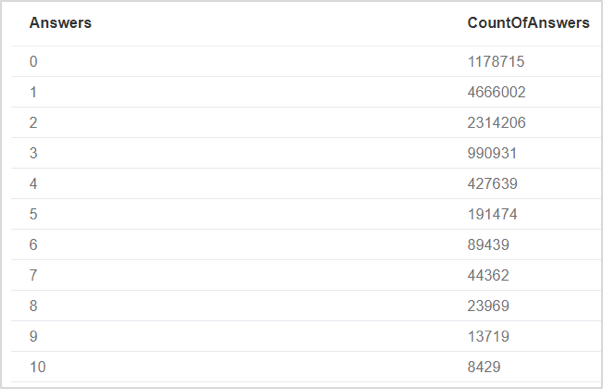
Description
From the results, there are 1.17 million posts that have 0 answers, 4.66 million have 1 answer, and so on.
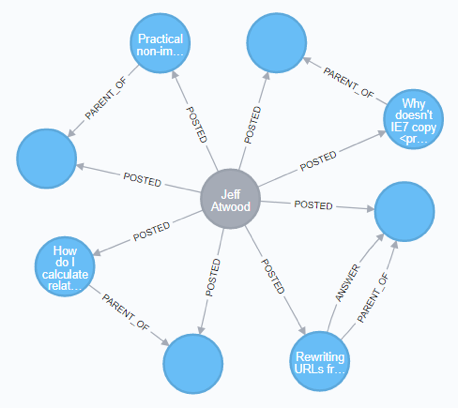
2.3 Node rank (centrality)
2.3.1 Importance of a user
Cypher script:
// Calculate node rank / Centrality of a node
// i.e., the relevance of a node by counting the edges from other nodes:
// in-degree, out-degree and total degree.

MATCH (u:User)
WITH u,size( (u)-[:POSTED]->()) AS OutDepth, size( (u)<-[:POSTED]-()) AS InDepth
ORDER BY OutDepth, InDepth
WHERE u.name STARTS WITH 'T'
RETURN u.name, min(OutDepth), max(OutDepth), min(InDepth), max(InDepth)
Outcome
… … … …
Description
For a user, the max(OutDepth) represents the max number of posts he/she has submit. When max(InDepth) is 0, it means there is no relationship ending at the User node.
The user who has the most OutDepth per post can be considered to be more important within the community.
Note: as this is a heavy query, make sure there is enough heap size (specified by dbms.memory.heap.max_size in the neo4j.conf file). Alternatively, use a filter to limit the scope of the query as shown in the sample, which only looks for users whose name starts with “T”.
2.3.2 Importance of a post
By looking at which post has the most number of answers, we can tell the importance and/or received attention of the post.
2.4 Orphan nodes
Cypher script:
// orphans: node has no relationship
match (u:User)
with u,size( (u)-[:POSTED]->()) as posts where posts = 0
return u.name, posts;
Outcome

… … … …
Description
These are users who have never submitted any post or answer.
3. Relationship analysis
Relationship analysis focuses on relationships in a graph database. It can help us understand the completeness, integrity and density of certain relationships between nodes.
What is unique to graph databases – compared to normal RDBMSs – is the powerful analyses available to reveal the hidden knowledge of connected data. One example is to find out the shortest path between two nodes. Another one is to identify relationship triangles.
3.1 Statistics on relationships
Cypher script:
// Count relationships by type
match (u)-[p]-() with type(p) as RelationshipName,
count(p) as RelationshipNumber
return RelationshipName, RelationshipNumber;
Outcome

Description
Display the total number of each relationship type in the database.
Another query to get similar results is given below, however it takes much more time to complete:
MATCH ()-[r]->() RETURN type(r), count(*)
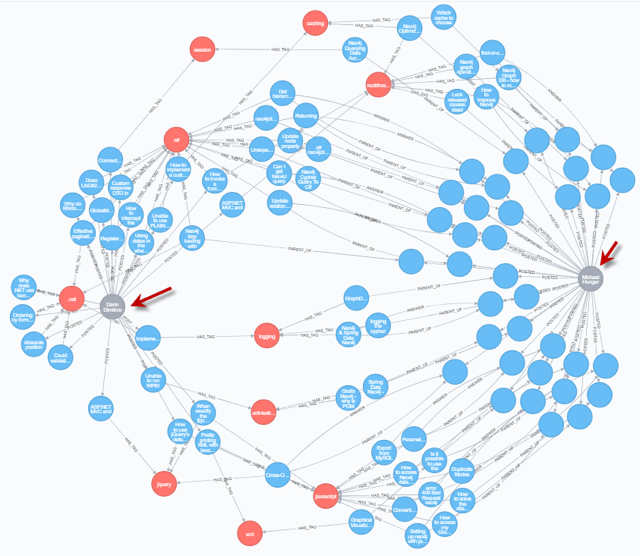
3.2 Find the shortest path between two nodes
Cypher script:
// Find all shortest path between 2 nodes
MATCH path =
      allShortestPaths((u:User {name:"Darin Dimitrov"})-[*]-(me:User {name:"Michael Hunger"}))
RETURN path;
Outcome
The shortest path between the two chosen users is 6.
Description
The shortest path between two users – highlighted by red arrows in the diagram above – tells us the two users are connected by posts having the same tags (red nodes). These are not necessarily the only paths, as users may post to answer each other’s questions or posts, but in this case, connection through the same tag – i.e., a common area of interest – are the fastest way to connect the two users.
In a large graph like this one, it may not be viable to calculate the shortest path between any two users. However, it may be valuable to check the connectivity among the most important people or among posts having the most interest.
3.3 Triangle detection
Cypher script:
// Triangle detection:
match (u:User)-[p1:POSTED]-(x1),(u)-[p2:POSTED]-(x2),(x1)-[r1]-(x2)
where x1 <> x2 return u,p1,p2,x1,x2 limit 10;

// Count all triangles in the graph
match (u:User)-[p1:POSTED]-(x1),(u)-[p2:POSTED]-(x2),(x1)-[r1]-(x2)
where x1 <> x2 return count(p1);
Outcome
Description
Triangles are another key concept in graph theory. Triangles are represented by three connected nodes, directional or uni-directional. Identifying triangles – or lack of triangles – provide interesting insights on the underlying data asset.
Triangles are also referred as Triadic Closures, as per Graph Databases, 2nd Edition (O’Reilly Media):
A triadic closure is a common property of social graphs, where we observe that if two nodes are connected via a path involving a third node, there is an increased likelihood that the two nodes will become directly connected at some point in the future.
Putting this concept into our daily life, it’s a familiar social occurrence. If we happen to be friends with two people who don’t know one another, there’s an increased chance that those two people will become direct friends at some point in the future.
By discovering the existence of triangles in a graph database, we can create more efficient queries to avoid circular traversal.
4. Using the APOC library
Since Neo4j 3.0, users can implement customized functionality using Java to extend Cypher for highly complex graph algorithms. This is the so-called concept of user-defined procedures.
The APOC library is one of the most powerful and popular Neo4j libraries. It consists of many procedures (about 300 at the time of writing) to help with many different tasks in areas like data integration, graph algorithms or data conversion. No surprise, it also has several functions for analysing the metadata of the graph database.
To enable APOC in Neo4j 3.x, there are a few simple steps:
- Stop Neo4j service
- Download and copy the most recent version of the APOC JAR file to the
pluginsfolder under the database, e.g.,graph.dbplugins - Add the following line to the
neo4j.conffile:dbms.security.procedures.unrestricted=apoc.* - Start Neo4j service again
The out-of-box functions for profiling are all under apoc.meta.*
Below are some samples:
• CALL apoc.meta.data()
This will list all nodes and relationships as well as properties of each.
• CALL apoc.meta.graph()
This is equivalent to CALL db.schema() (refer to section 1.1 above).
• CALL apoc.meta.stats()
This will list statistics of nodes and relationships. It also shows the cardinality of each relationship by node types. For example, the following stats communicate the fact that the INTERACTS relationship is between the nodes of label Character:
{
  "labelCount": 1,
  "relTypeCount": 1,
  "propertyKeyCount": 3,
  "nodeCount": 107,
  "relCount": 352,
  "labels": {
    "Character": 107
  },
  "relTypes": {
    "(:Character)-[:INTERACTS]->()": 352,
    "()-[:INTERACTS]->(:Character)": 352,
    "()-[:INTERACTS]->()": 352
  }
}
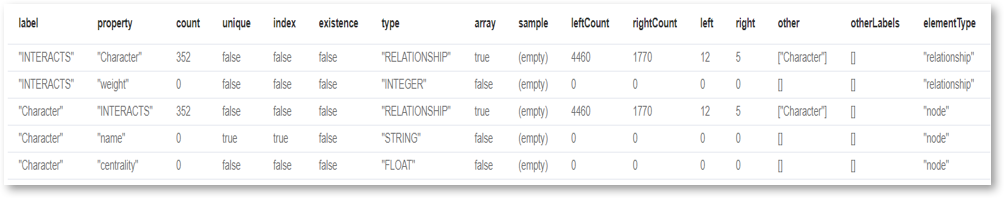
• CALL apoc.meta.schema()
This will return metadata of all node labels, relationship types and properties.
• CALL apoc.meta.subGraph({labels:['Character'],rels:['INTERECTS']})
This is a very useful function especially for a very large graph, as it allows you to analyse a subset of nodes and relationships (subgraphs). The complete specification looks like this:
CALL apoc.meta.subGraph({labels:[labels],rels:[rel-types],excludes:[label,rel-type,…]})
5. Further discussion
There is huge advantage to storing data as a graph. The graph data model enables us to do much more powerful analysis on relationships over large amount of data, and unearth buried connections among the vast amount of individual data elements (nodes).
Data profiling on a graph database like Neo4j gives us more insightful understandings of the actual data we are working on. The results obtained can then be used for further detailed analysis, performance tuning, database schema optimization and data migration.
As a native graph database, Neo4j provides native graph data storage and native query processing through the Cypher query language. Some of the most useful data profiling tasks can be easily done using Cypher, as shown in this article.
There are also extensions that support more complex and advanced graph analysis; for example: Betweenness Centrality and Connected Components. Neo4j graph algorithms is the one I’ve been using to perform more complex data profiling. Once installed, the functions can be called directly as part of the Cypher query and results visualized inside the Neo4j Browser. I plan to cover more on this in coming articles.
Learn how relational databases compare with graph databases:
Download this ebook, The Definitive Guide to Graph Databases for the RDBMS Developer, and discover when and how to use graphs in conjunction with your relational database.
Share Article


Explore
Related Articles


1 of 3: The difference between a graph, a knowledge graph, and a context graph

2 of 3: Why graphs, knowledge graphs, and context graphs matter to customers

3 of 3: The graph ecosystem: Bringing connected context to enterprise AI