Demographics master data at Citigroup

Director, Citi Private Bank
26 min read
Editor’s Note: This presentation was given by Walter Trotta at GraphConnect New York in September 2018.
Presentation summary
Walter Trotta is the Global Head of Data Services at Citi Private Bank.
In this talk, Trotta sets some context surrounding the world of private banking. He defines private banking as an industry that provides a full rate of financial services to those who hold a certain range of wealth. The amount of wealth an individual holds impacts the complexity regarding the individual – this extends to their relationship with the bank.
He discusses a bit about the data domain. The data domain is what’s actually being put into the graph at a high level. Data domain can also be described as “party entity.” The party is known to be individuals, organizations or groups of organizations you need to hold and organize information about. This information is kept in a master data system.
Trotta then explains the problem that Citigroup is working to solve and how graphs are an integral part of the solution they arrived at. When dealing with a single client, a cast of characters come out with varying levels of involvement. A single client may have a spouse, children, grandchildren, lawyers, accountants, family offices and more. Each relationship holds a varying degree of influence concerning the client and the best way to understand this information is via a graph structure.
Finally, Trotta shares some of the learnings that he and his team had along the way, which include data challenges and data governance. Data governance has raised nuances to dealing with a graph structure. We have had to revisit old assumptions and completely rewire our thinking.
You’ll also learn the future opportunities Citigroup sees with potential of graph technology Neo4j. Data is the new oil, and using graph to understanding that data exposes value.
Full presentation
My name is Walter Trotta. I am with the Citi Private Bank. I head Data Reporting and Analytics for Operations and Technology. I am going to talk about some work we’ve been doing this year regarding demographics master data.
Private banking
For those of you who are not involved in the industry, let’s explain private banking just a little bit.
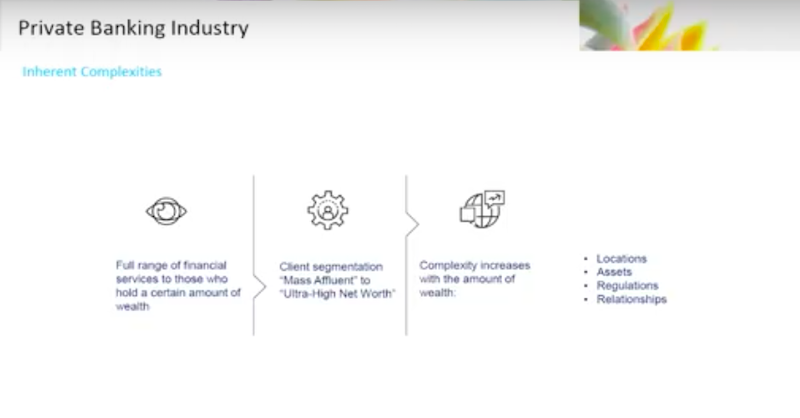
Private banking is an industry that provides a full range of financial services to individuals who hold a certain range of wealth. This wealth could be classified from in the hundreds of thousands, for what would be called a Mass Affluent Customer, all the way up through the tens of millions to billions for what we would call the Ultra High Net Worth Client.
This is pretty common across the industry, so these terms are fairly consistent regardless of what bank you’re talking about. Each bank tends to specialize in certain segments and certain sectors.
The consistent theme is this: With the amount of wealth the individual holds, the amount of complexity regarding that individual, their relationship with the bank and the things they’re doing tend to become equally complex.
You’ll have a diverse range of locations, holdings of every asset type. The regulations start to look a lot more interesting because of those asset types and the number of locations the clients tend to operate in.
This extends to the clients themselves, and their relationship with the bank become much more complicated.
I’ll dive a little bit into the types of assets we tend to see, ranging from the basic retail checking account all the way up through subscriptions, sophisticated hedge funds and alternative investments. These accounts go all the way up to lending and financing for things like companies, sports teams and real estate.

All of this diverse business we do with our clients is provided globally. We operate out of multiple locations because our clients tend to do the same. This brings a high level of complexity to each client.
We distinguish ourselves from a retail context or an investment banking context, in that we’re not about volume. We are talking about a smaller group of individuals, so the real interesting aspect of doing technology in this context is not flow business like you might see in an equities environment. Instead, we’re solving very complicated problems for our clients.
The data domain
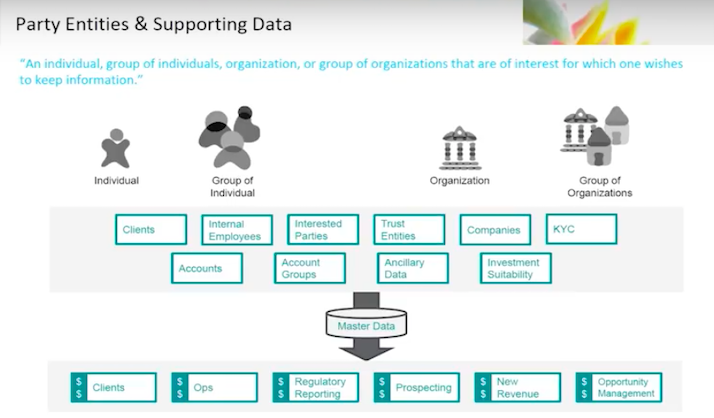
When we talk about data domain, we’re really talking about party entity. If you’re a classic data modeler and data governance person, you talk in terms of entities. We’re talking about the party. Party is known to be individuals, organizations or groups of organizations upon which you need to hold information.
This information is contained in a master data system. We take in information about our clients, employees, trust entities, companies – Know Your Customer (KYC)-related information – which hold the party and ancillary data that surrounds that party. We aggregate that information in the master data system, and then distribute it to all of our downstream consumers, applications, end users, et cetera.
Private banks tend to have many upstream sources of information, whether they be custodians, external reference data sources or systems that reside in other divisions where you’re handling assets on behalf of the client. This information comes from multiple sources that we then have to aggregate, normalize and persist for the purposes of doing business.
This is not a radically unique concept.
You will see party entities and master data in any industry. However, for every industry and every business and company, every line of business has unique variations on this theme, depending upon the type of business they do with the type of clients they support.
Our problem
In order to describe our problem, I need to explain a little bit about the private banking client. This is not unique. Every company will have their variation, and private banks will have their own variation on this.
However, I think it’s important to understand the private banking client to understand what we’re ultimately going to talk about: How we put all of our banking data into a graph database.
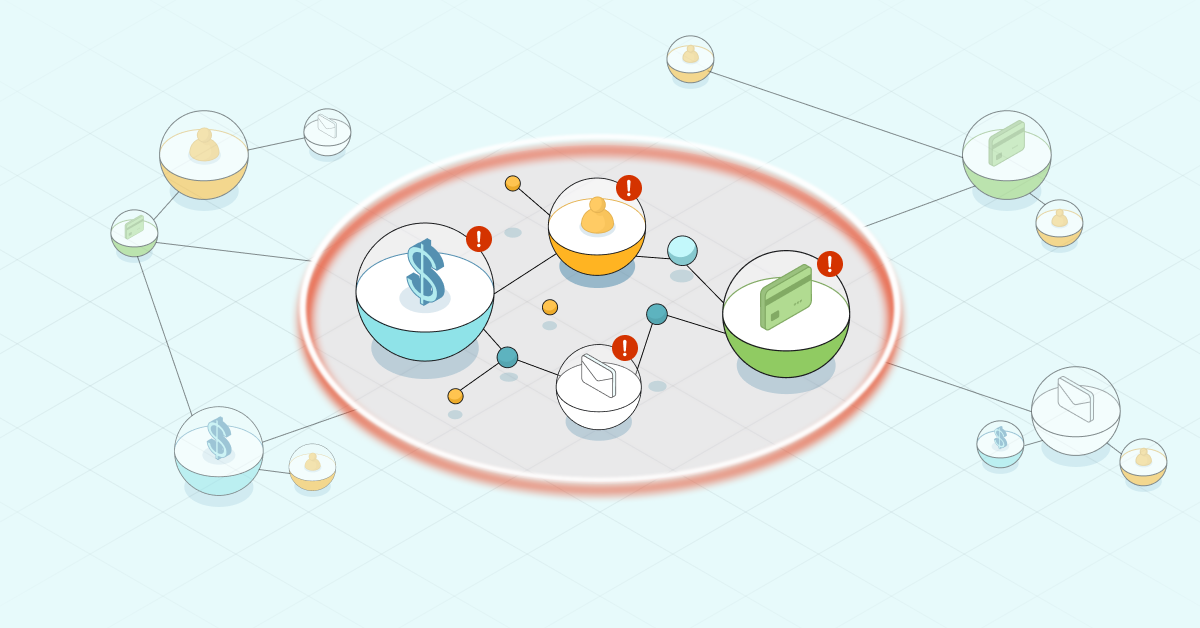
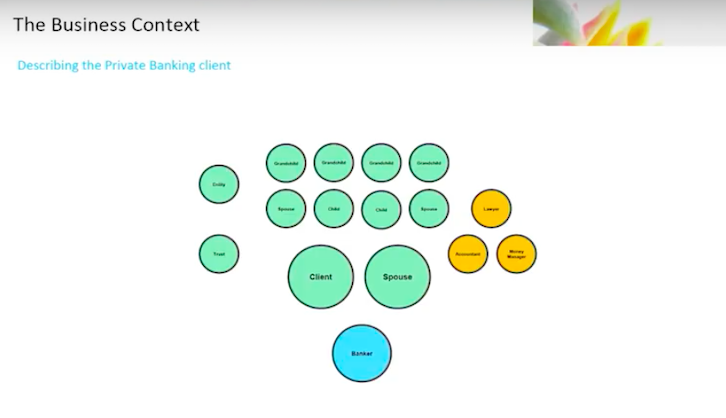
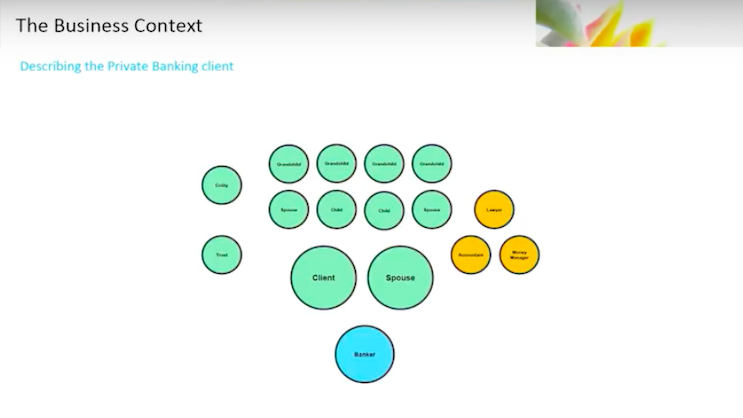
There’s the client.
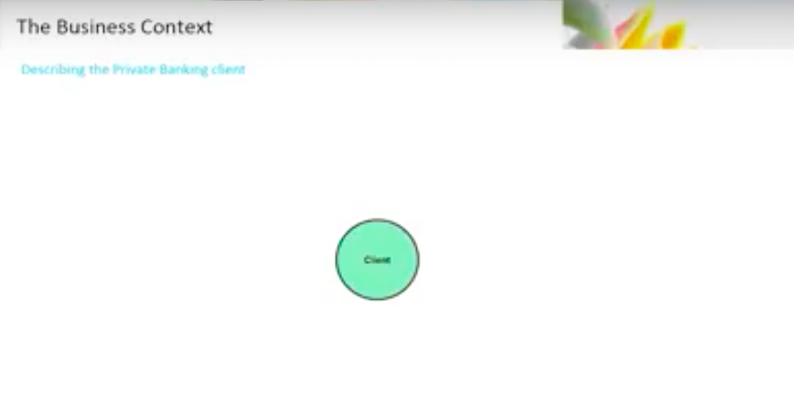
I’m a client, you’re a client, we’re all clients. When we start to explain that in the private banking context, the client is, in fact, not just the client but the client’s spouse, their children, their grandchildren.
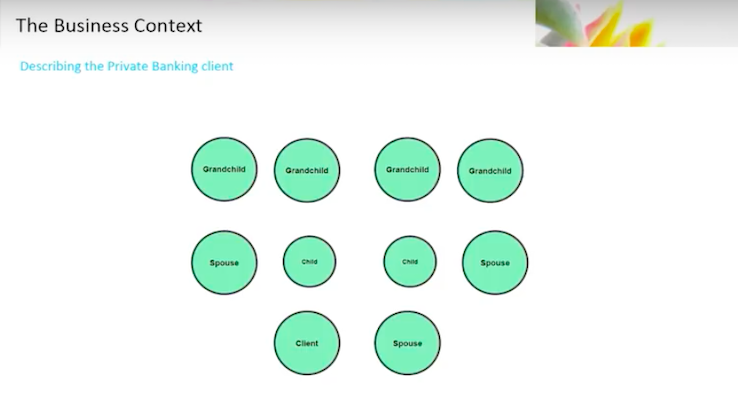
Now we are talking about multi-generational wealth. The grandchild is important, because we’re talking about the transference of wealth from one generation to another, and the bank’s involvement in that transfer.
We’re talking about a supporting cast of characters surrounding that family, whether it’s a legal entity that was set up, a trust that’s held, lawyers, accountants, money managers, family offices – it’s a pretty broad list.
Below, you’re seeing the overly simplistic view. That’s just on the client side.
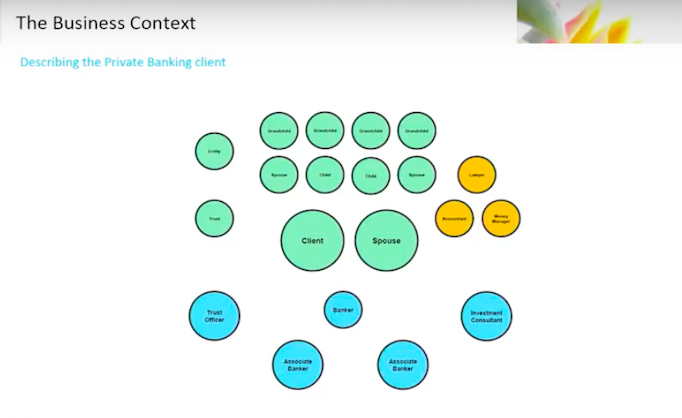
Now, we start talking about the bank.
You will have a banker – you might call it a banker, a relationship manager, an adviser – but you’ll have a primary point of contact. This is the individual that is responsible for the relationship with the client. It doesn’t end there.
I have one banker. For a private banking client, you also have an equally diverse set of individuals inside the bank who support that client.
In a front office context, you’ve got trust officers, and you have associate bankers or assistant bankers who support that client.
You’ll have investment consultants or product specialists who provide specialized advice on any given product the client might want to engage in.
Let’s continue with the middle and the back office.
We’ve got onboarding personnel who actually bring the client into the bank. They work with all the products the client wants to deal in. Someone will open those accounts and maintain those accounts. You’re going to need financing people who will open up loans and financing. You’ll have regional managers who have to maintain the view across the entire business in a particular region.
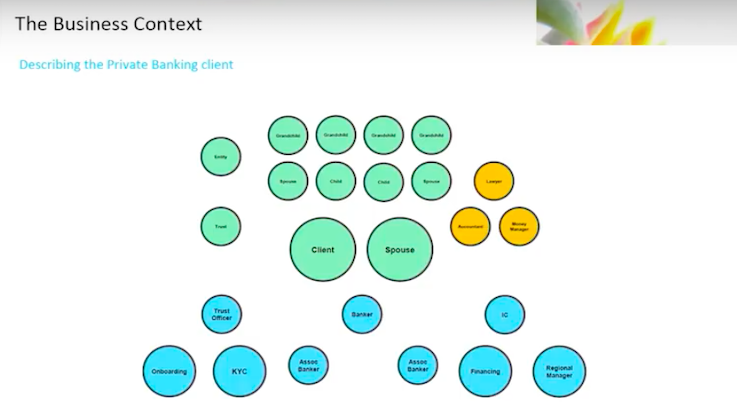
The cast of characters starts to grow rather dramatically.
This client hold assets with the bank. We have to represent the entities that hold those assets. We need to maintain groupings of those assets in order to portray a portfolio of assets.
You’ve got a range of ancillary data that supports all of this, like tax IDs, companies, employers, phone numbers, products, employee IDs, email addresses – the list is pretty broad.
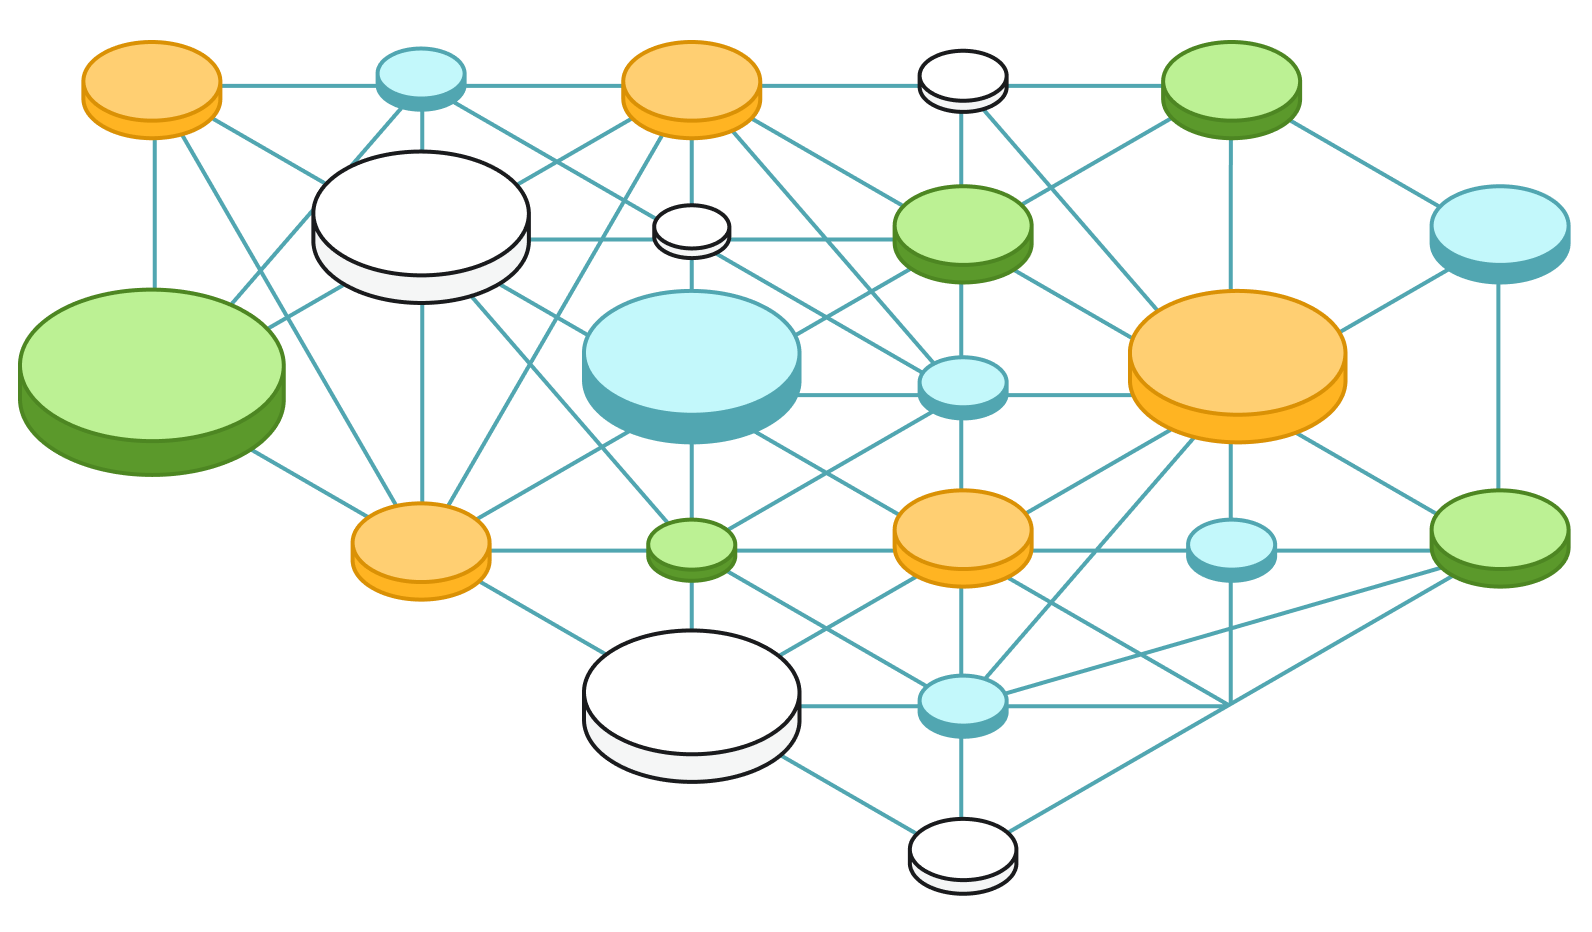
You end up with is something like this:
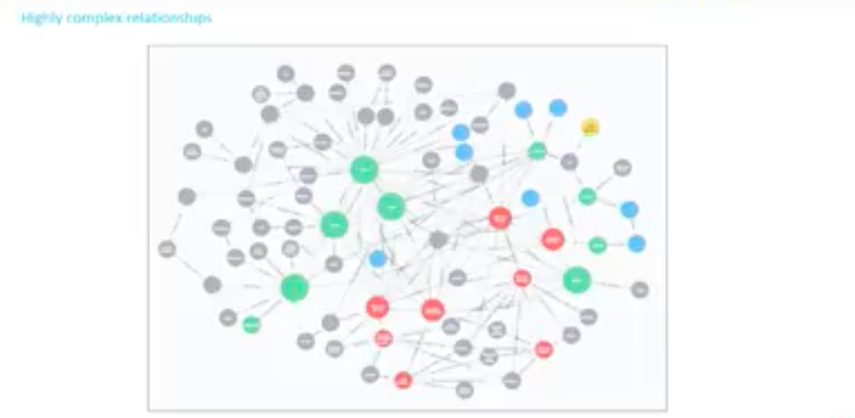
This final graph is over simplified and just represents one client.
We have been doing master data in private banking for a long time, but we’ve been doing it in a relational model. The relational model is many-to-many.
You’ve got multiple, multi-legged questions you need to ask the data in order to do business. When you try to model this into a relational database, with those multi-legged questions, you’ll talk about joints. Joints are expensive. Instead, you’d want to talk about denormalized databases.
You either end up in a situation where you’re correct and normalized, or you’re denormalized and you have flattened data structures to support queries with sometimes thousands of temporary transient tables that you’d have to deal with. To a relational database person, that is not an ideal condition to be in.
Because of this condition, fundamental changes to your data model are highly risky and costly in certain instances. You end up in an accretive state. Instead of making the fundamental changes to the database, as your business evolves or your understanding evolves, you add tables to deal with the additional attributes. If you could rip your graph all up and start it all over again, it would look totally different on day two.

The old system simply could not keep up with the business. When new requirements come in, that change comes in the form of regulations or new types of products. If your business goes from a strictly regional one to a global structure, these changes come quick. You would not be able to change quickly enough to keep up with the requirements.
We’ve been working on putting together a brand new system. We decided to start from scratch based on graph to persist and distribute this type of information.
For context, we are doing a broad transformation of data in Citi Private Bank today, and this is not the only thing that’s going on in my space. We are looking to take a golden source approach, make sure it’s performant, reliable and that it supports the entire range of products and services we have to deal with.
Some key concepts are consistent across all the aspects of what we’re trying to do. Certain principles are fundamental and that translates right into our master database.
Separate your data domains in separate repositories, then you are able to handle them appropriately. We’re separating the demographics-related information from our financial information, that way we have an opportunity to choose the right tool for the right problem.
We’re looking to make sure that we support all the regulations, compliance and risk concerns we have in a banking context. We’re going to be obfuscating all of the information that goes into the database and the data at rest. We’re tokenizing, that way we’re more free to use the data when and how we want to, while still adhering to those regulations.
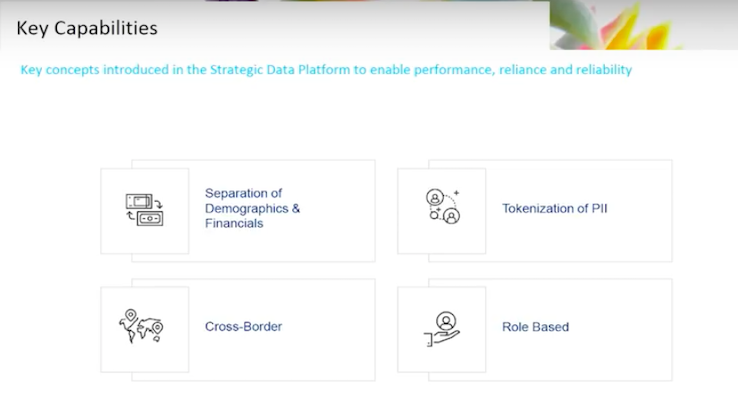
As a global bank we have global clients. We have to worry about cross-border issues. This is a fundamental concern. We’ll want to move from certain preconceived notions about how we represent our clients and individuals in our database, and take a role-based approach.
How we represent clients and individuals is very important, because there’s a lot of business rules driving what we do. We need to make sure those business rules are clearly described. We also need to know that when we answer a question, we understand why.
We have a multi-year journey ahead of us. There is a demand to synchronize with our legacy flow. Since they’re going to have to coexist for some time, we’ve got to be able to take information that’s being instantiated in the old flow and bring it into the new flow, or the new database.
We are using techniques to synchronize data from one database to the other. At the same time, we are making sure that, once it sits inside this new structure, we are representing it correctly rather than simply reproducing what sits inside the relational model.
We are multichannel. Whether our data sits inside of Neo4j or another database technology, the consumption of that data will be driven by what the consumers need. We will have RESTful services, Kafka messages and distributed object caches. The consumption will be appropriate to the consumer.
One key aspect is getting applications onto the system. We are building our system according to other transformational programs that will trigger the build-out of the plumbing. We need to ensure this system is function-focused and not built in isolation. This system looks at the problem we have to solve and maps how we’re planning to attack it.
The demographics information couldn’t be more tailor-made to our graph structure. We are building out this system. The system is global, it’ll be in every region that we operate in. The system will take in every bit of client information that we take in and distribute. Finally, it will be a representation of all of the business logic and business rules.
This is why Neo4j was so appealing. My business rules are hardwired into my data. Since these rules are so complex, it’s highly beneficial to us as a business.
The solution
In order to explain the solution, let’s go through some use cases.
We’ll focus on one problem that’s representative of the types of questions that we in private bank need to ask of our demographics data. A prime example is the concept called visibility.
Visibility, as a concept, asks what is the scope of clients, accounts and other data I should be interested in. It’s almost a super set of entitlements.
Visibility doesn’t talk about traditional entitlements topics. Generally, these rules are:
- I have a resource.
- I have a role.
- I have an action.
This is the common triple in an entitlements rule.
Instead, visibility is more at an individual level. I should be concerned with this range of information. Then the business rule comes into play.
We have taken the role-based approach, which defines questions around who am I, where am I, what function am I serving and what interest do I have. We will walk from role to role to explain how that rule is manifested at a data level and what answer it’s providing.
Let’s start with the banker or the adviser.
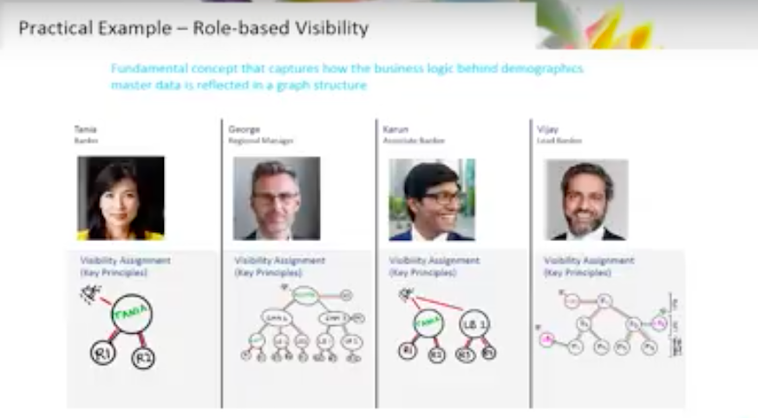
The banker has a fundamental interest in the clients for which they do business.
I’m a lead banker for this individual or group of individuals. These individuals are clustered, within our context, in a relationship.
For all clients, for which I am lead banker, I have access to these relationships and subsequently these accounts. It’s a fairly direct line.
Now that’s a simple condition, however, we operate in an organization. Lead bankers answer to a regional manager. That regional manager, by definition, should have access to all of the business that the bankers in his region do. This means that our graph is now hierarchical.
I am a regional manager, I have clients that report to me. I have access to the clients, relationships and accounts for which they are responsible.
We’ve already built a graph. Let’s continue with the roles that we talked about previously.
We’ve got the associate banker. The associate banker, I’m an associate banker, I support this lead banker and this leader banker, who in turn is lead banker for these relationships and clients.
We have lead bankers, they operate in multiple regions. We end up with relationships going across regions. We need to establish those relationships because by definition of the support I’m giving to a banker in another region, I should have access to those clients and accounts.
Then we have roles who have broad access to information. The information is not strictly about the client, it’s actually about the region.
I might be an operations person. I could be a KYC QA person. I could be an onboarding person. Because I’m supporting an entire region, my relationships are established not through the individual clients but by the region I’m supporting.
In previous incarnations, we might have assigned a certain class of visibility to an individual. Below, it’s modeled into the graph.

The visibility question is being asked starting at the region rather than at the client. The direct link is not put in place between that individual and every single client in the region.
Because of the business rule, I am an operations person and I am in this region, you walk the graph starting at the region and then work your way to the clients. The structure represents the business rule.
That is a brief overview of what we’re actually dropping into the graph and how the business rules manifest themselves.
There are other questions that one might need to ask – relationships to public figures is a good example.
There are certain questions, that when we dropped them into the graph structure, we were able to answer without ever really intending to do so from the onset. This was a remarkable thing to do. These questions weren’t a requirement, no one asked us to put that in place. But just because of the graph structure, we were able to answer them.
A bit more about the solution.
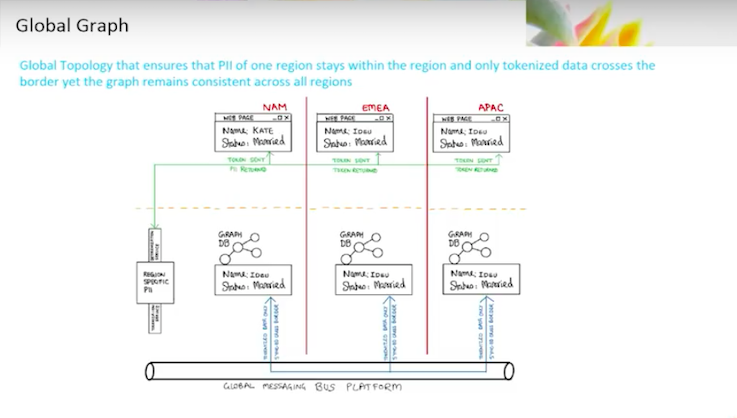
We are putting global data into the master database. We’re building clusters of Neo4j in multiple regions in order to support the requests that those graphs are receiving. One important thing to note, the intent is to always ask the question directly to the graph rather than having a cached version of it. This is because there are certain questions you might want to ask that are pretty straightforward to structure and Cypher.
Sometimes, things are more difficult to create when you have to get into a bit of Java code, create an object, make sure that the object has all the necessary attributes, and then push that code and push those objects out into your distributed cache structure. For that reason, an upfront requirement was always ask the graph first.
We will have latency issues. I have an application whose service has been spun up over in region A, the business application. We want to make sure that the data is close to it, because the alternative, if I go to a central source, is hundreds of milliseconds of latency. So we have to work hard to push the graph database globally and make certain the data is globally consistent.
The only reason we’re able to do this is because we are setting the bar at the highest point possible when satisfying things like personally identifiable information (PII), cross-border and privacy regulations. We picked the most stringent of those regulations and set the bar there. Then we tokenize that information to make sure that it’s non-identifying. That means we have a globally consistent graph.
The tokenization and consistency of our graphs are important because the balkanization of the information is highly complicated to maintain. If I have different representations and different locations of my master data, then it takes a lot of time and energy to synchronize what should be synchronized and leave local what should be local.
In the end, those rules end up being almost impossible to understand. The intent is to make the graph consistent and keep it simple. Make the decision on what one is able to see at the point of consumption. This is also a common approach.
If you go into many private banks, they will stitch in that identifying information when they run through the report. They paint the screen to make certain that it’s not available until the last possible moment when you know who you’re talking to and why they want access to the data. Then you make a determination on whether they should have it to begin with.
Once we’ve got the information tokenized at the point of consumption, we receive it from a custodian or we have an onboarding application that’s operating out of the region. Then we push that out over Kafka.
After that, the data is sent out to all of the databases and the clusters that reside globally.
When the user opens the screen, if it is deemed appropriate, we will detokenize and they’ll have access to the information.
We will have a repository of financial data. We’ll have our party master and identifying information from the financial data. At the bare minimum, you’ll have an account number to start with. That will be tokenized. Then there will be a link with globally unique identifiers with the tokenized ID itself.
Let’s say I put a portfolio viewer up onto the screen with a list of transactions. We’ll be able to identify which transactions are associated with which accounts based upon the tokens we put into the graph. Then de-tokenization occurs once we need to paint that screen.
Other aspects of the solution include business critical functions.
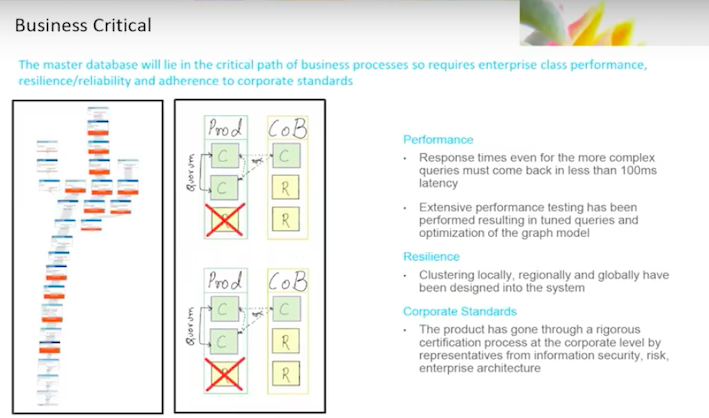
This is not some offline analytics tool. If the business critical tool goes down, people will notice.
When an individual opens a web browser and brings up the client portal, it will be performing a visibility check at that time. If that service is not available, we’ve immediately got an impact.
We’re trying to make certain that the solution is actually enterprise-ready, business critical and adequate.
We’ve been going through a round of performance-testing, both on reads, writes and nonfunctional requirements. We have always kept in mind that if I do a query, a user better had not noticed. Response time should be between a hundred milliseconds and 300 milliseconds, depending upon which bar you’re using, or under. Staying fast was a requirement.
We’re going to have right requirements where we are synchronizing from our Oracle database changes. Changes take place that the new applications are not responsible for, and that right condition is important because we do morning batch. If I’ve got a few hundred thousand updates that I need to make, it should probably complete before the batch cycle is done, rather than a day later.
We’ve also been very careful in resiliency. We have come up with approaches to the failover above locally, in data center, between data centers and across regions.
The good news is, since it’s globally consistent, the graph is going to have instances in every single region which should be reliable. If you lose an entire data center, you are still able to get an answer. You might have to wait a few hundred milliseconds to get it, but the system is always consistent and available.
We have to deal with CoB and typical failover conditions. The ability to handle this has been designed into the system.
When you work at a bank, getting new technology is interesting because banks have to worry about regulators, auditors and compliance people. Information security is a big thing. We’ve all seen the news on data loss and data leakage.
We need to make certain that the solutions we bring into the bank satisfy all involved parties. We’re interacting with compliance and legal to make sure they understand the solutions we’re bringing in, and that they agree with the approaches. We do our due diligence.
This has not been my first interaction with graphs. I have never been through this level of detail with graphs before. This is the same with my team. We’ve had a lot of learnings along the way that might be interesting.
The first lesson we have learned is: Don’t do lift and shift modeling.
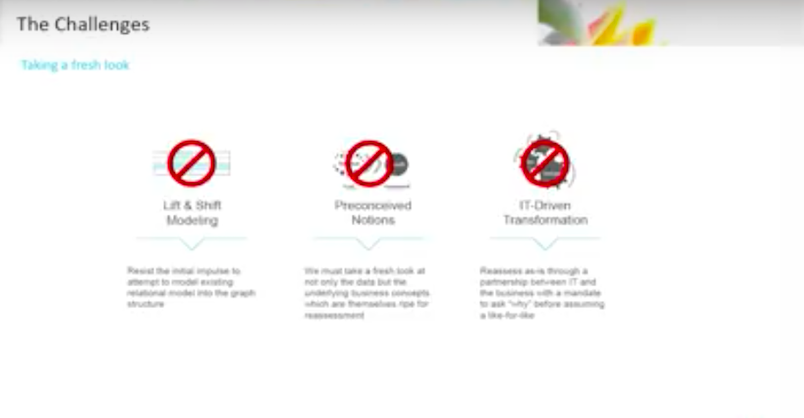
Don’t go into your relational database and try to shove it into a graph structure. It won’t work. You have to discard a lot of preconceived notions.
Take a fresh look and step back. This goes straight into the business concepts. Taking a fresh look is not just about the technology or the coding. This actually does cost you the time to take a new look at even certain assumptions from a business context. Everything needs to be revisited.
Because you’re going back to the original business concepts, you had better do this in close partnership with your business. For example, this is not how we were approaching role-based visibility before.
We had a solution that worked at the time. Now we’re taking a fresh look and saying, the business rule is actually key here so what is the business condition? Who are you? Why are you asking for access? Am I able to represent these questions in the form of a business rule?
If I am able to, that means it is more likely that I am able to model this in my graph.
Data challenges
Graphs helped us exposed certain data issues.
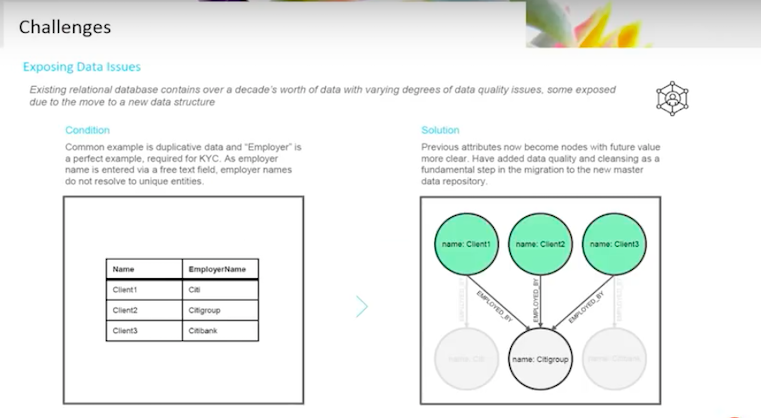
Deduping becomes a big thing in graphs. A perfect example of this was the employer node.
Let’s say you go in with an idealistic hat on, and you want one representation of a company. Employer is a Know Your Customer (KYC) question that you need to ask. Who are you employed by? The minute you ask that question, you start thinking about the company node.
Before, employer and company were thought of as an attribute. Attributes don’t need the same kind of controls, because they are just a field in the KYC workflow. I just need to capture that.
If you step into the graph role and start asking that same question, you need to know if you have a single representation of that actual company. There will be questions down the road. The first round of work that you’re doing might be very interesting. You will want one representation of that sitting inside of your graph.
We might call it the Citibank, Citi, Citigroup. We want to narrow it down to one. That will require a lot of data cleansing. Then we’ll have to go back, since we’re operating in parallel, and correct the validations performed in the older applications that aren’t even talking to my graph. We’ve got to do this to make sure that they don’t dirty our information all over again.
Data governance
If you do data, data governance should be a topic.
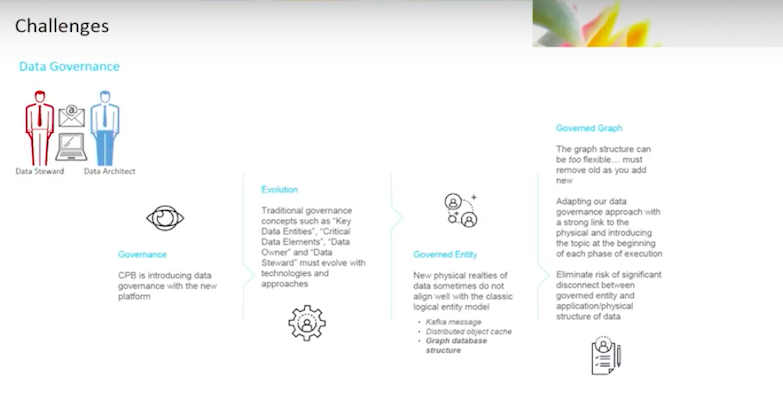
We are incorporating heightened data governance. We do data governance today. We have a Chief Data Office (CDO), we talk to CDO and we do monitoring. Ultimately, we’re looking to ramp up the amount of governance that we have, and we’re doing that from the beginning.
Rather than building the platform and going back and backing into governance, we’re starting from the beginning. Any entity that goes into the new repository by definition has to be governed.
This data governance has raised certain nuances to dealing with this in a graph structure. You have to go back to the old assumptions in data governance and revisit them as well.
You have to revisit topics like key data entities, critical data elements, what is an owner and what is a steward. This is all necessary when you’re talking about a Kafka message or an object that’s in a cache, or a graph database. You need to bring what was understood as a traditional governance process and bring it into this new world.
I have a classic logical data entity. How do I map this data entity to my physical structure when it is blown out in a graph? My one entity might have 200 attributes is now 30 nodes with a couple of properties and a bunch of relationships that actually don’t even fit into that original logical data model that looks like a table.
We’ve brought the dialogue back. Data governance people start talking at the very beginning, pre-implementation. As we go through that process, the person on my team responsible for governance is talking frequently with the folks implementing the graph structure and trying to understand what the connection is. This will be an ongoing process, but the dialogue has to be very active.
Conclusion
Finally, where is this all going?
We want to turn our data from a cost to an asset and actually provide value.
That use case I mentioned before, about the public figure, was a happy byproduct. I am able to tell you which public figure is related to which public figure through its relationship with our bank. That is at zero cost. It was a question you simply could not answer in the relational database structure.
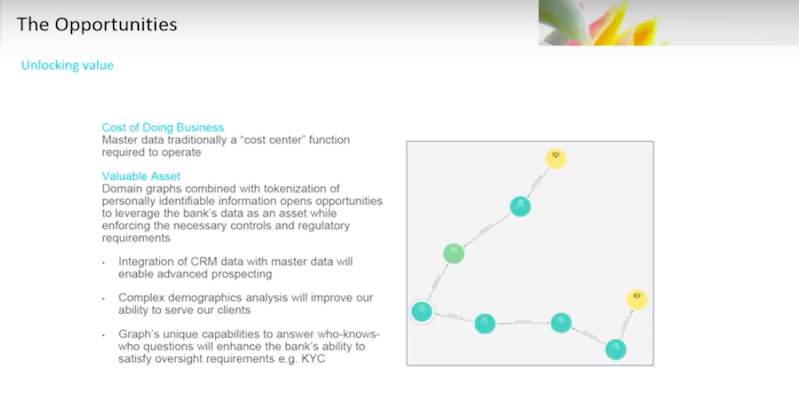
Once we bring the domain graph topic into play, then we’ll have things like, I’ve got my demographics master data and prospecting information. If you go with those unique identifiers and unique nodes, you are able to link my prospecting data to my demographics master data, and immediately you’re exposing value.
For example, finding out that our clients and bankers in this location have potential prospects working at the same company in the same location that participate in this philanthropic organization. Now it starts to get really interesting. In addition, it’s not hard to do.
It’s easier to accomplish than if we were trying to do this again in an Oracle database or relational database. They have their place, relational database aren’t going anywhere. However, for this type of problem, a graph database really helps.
Share Article


Explore
Related Articles

APRA just put the financial sector on notice over AI. Government agencies need to take notes.


Hey LLM, you’re using OPTIONAL MATCH wrong. Here’s the Cypher that actually works.