Boundary Graph: Exploring the IPL Through the Lens of Graphs

Developer Relations Lead, APAC, Neo4j
10 min read
The Season Before the Season
With the ICC T20 World Cup taking center stage through February and into the first week of March, attention briefly turns to national colors, form charts, and high-stakes knockouts on the global stage. Almost seamlessly, those conversations then spill over into franchise loyalties. Work deadlines give way to squad combinations, group chats erupt with debates on opening pairs and impact players, and the perennial question resurfaces — is this finally the year their team lifts the trophy? The Indian Premier League (IPL) does not just begin on opening night; it starts weeks earlier, in anticipation.
With IPL 2026 around the corner, I found myself asking a question that went beyond points tables and strike rates:
What if we could explore IPL not as static numbers, but as living relationships?
That question eventually became Boundary Graph, a project built to explore IPL data using Neo4j and graph thinking, rather than traditional tables and dashboards.
Why Another IPL Project?
IPL data is everywhere. Scorecards, leaderboards, season summaries — all neatly packaged and endlessly consumed. But most of these views answer obvious questions:
- Who scored the most runs?
- Which team won the most matches?
- Who hit the most sixes?
What they struggle with are relational questions:
- Which players consistently dominate specific bowlers across seasons?
- How do venues influence batting patterns across teams?
- What hidden partnerships emerge when you connect players, teams, seasons, and match situations?
These questions are not about aggregates. They are about connections.
And that is where graphs shine.
The Intent Behind Boundary Graph
Boundary Graph was built with a clear intent:
To demonstrate how graph databases specifically Neo4j are a natural fit for sports data like the IPL.
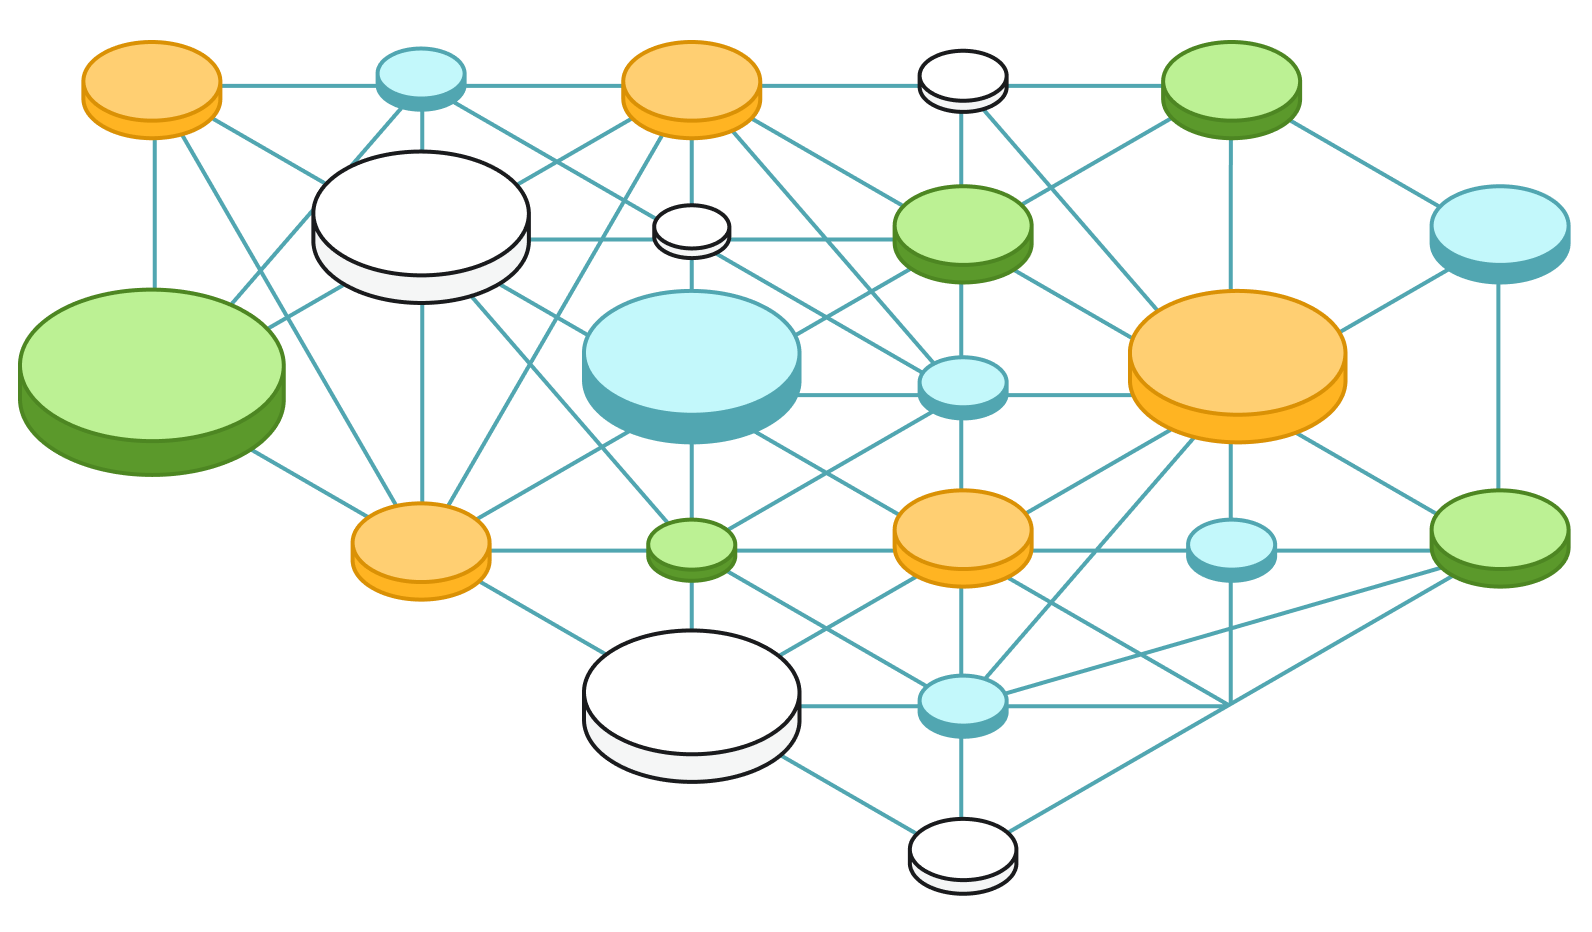
Instead of treating IPL as rows and columns, Boundary Graph treats it as a network:
- Players connected to teams
- Teams connected to seasons
- Matches connected to venues
- Deliveries connecting batters, bowlers, and outcomes
Once you model cricket this way, exploration becomes intuitive. You are no longer querying data, you are traversing a story.
Each player carries a career narrative, each team carries a seasonal arc, and each match becomes a self-contained storyline made up of hundreds of connected moments.
The graph does not just store these stories: it preserves how they intersect.
Choosing Neo4j: Graphs Over Tables
Traditional relational databases are excellent at enforcing structure and consistency. But IPL data is inherently connected and evolving. Consider a single boundary:
- A batter
- Facing a bowler
- In a specific match
- At a particular venue
- During a season
- Playing for a team
In a relational model, answering questions across these dimensions means multiple joins, complex queries, and performance trade-offs.
In Neo4j, these relationships are first-class citizens. Instead of joining, you walk the graph.
That design choice fundamentally shaped Boundary Graph.
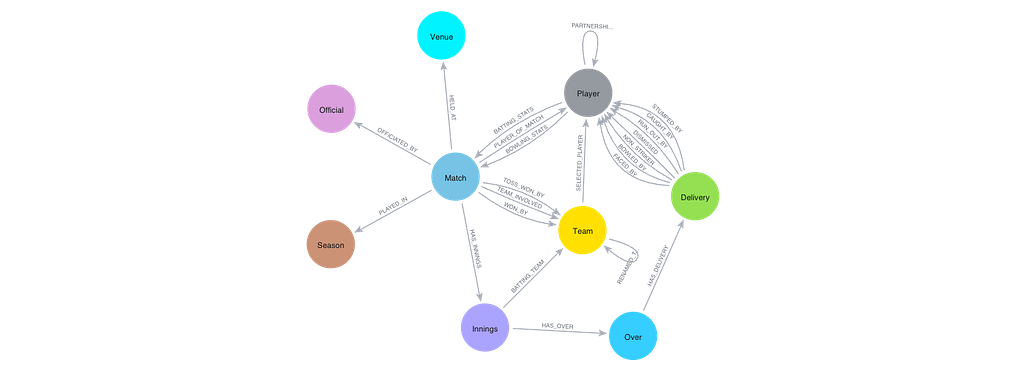
Modeling IPL as a Graph
At the heart of Boundary Graph is a deliberately simple but expressive schema — one that mirrors how cricket is actually played, ball by ball, rather than how scorecards summarize it.
Instead of flattening everything into match-level aggregates, the model treats deliveries as first-class citizens, allowing relationships to naturally emerge between players, teams, overs, and matches.
Core Nodes (with key attributes)
- Player (player_id, name, role, gender, strike_rate): Represents individual cricketers across seasons and teams.
- Team (franchise_id, current_name, old_name, team_type): IPL franchises, accounting for name changes and team evolution.
- Match (match_id, date, match_type, winner, outcome_type, outcome_margin): A single IPL fixture with its final result and context.
- Season (season, year): IPL seasons modeled explicitly to enable cross-season analysis.
- Venue (venue, city): Stadiums where matches are played, capturing location-specific trends.
- Innings (innings_id, innings_number, target_runs, target_overs): Logical partitions of a match, critical for chase vs set-target analysis.
- Over (over_id, over_number, balls_per_over): Over-level grouping to analyze phases like powerplay and death overs.
- Delivery (delivery_id, delivery_number, runs_total, is_boundary, is_six, is_wicket, extras_type): The smallest and most powerful unit of analysis — a single ball.
- Official (name, role, review_umpire): Match officials and umpires associated with games.
Key Relationships (with contextual properties)
- (:Player)-[:PLAYS_FOR {season, position}]->(:Team) : Captures player–team association and role in a given season.
- (:Team)-[:PART_OF_SEASON]->(:Season)
- (:Match)-[:PLAYED_AT]->(:Venue)
- (:Match)-[:HAS_INNINGS]->(:Innings)
- (:Innings)-[:HAS_OVER]->(:Over)
- (:Over)-[:HAS_DELIVERY]->(:Delivery)
- (:Player)-[:BATTED {runs_batter, fours, sixes, dots}]->(:Delivery)
- (:Player)-[:BOWLED {runs_conceded, wickets, economy}]->(:Delivery)
- (:Team)-[:BATTED_IN]->(:Match)
- (:Team)-[:BOWLED_IN]->(:Match)
- (:Official)-[:OFFICIATED]->(:Match)
Why Delivery-Level Modeling Matters
By anchoring the graph at the Delivery node, Boundary Graph can answer questions that are extremely difficult to express in relational systems:
- Boundary patterns of a batter against a specific bowler
- How scoring behavior changes across overs or match phases
- Venue-specific aggression trends over multiple seasons
Context such as runs scored, boundary type (four or six), extras, and outcomes are stored as properties on Delivery and its relationships, keeping the model flexible without unnecessary node explosion.
This structure keeps the graph semantically rich, time-aware, and highly traversable without becoming over-engineered.
Neo4j Browser and Bloom visualizations make these connections immediately visible, turning what would otherwise be complex joins into an intuitive, explorable network.
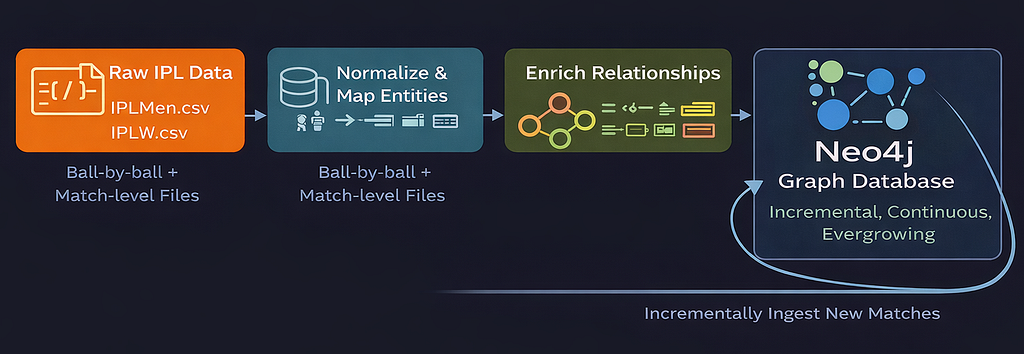
The Data Source: Where the Graph Begins
A graph is only as good as the data it is built on. Boundary Graph uses publicly available IPL ball-by-ball and match-level datasets, which provide:
- Match metadata (season, teams, venue)
- Delivery-level details (batter, bowler, runs, extras)
- Outcomes (boundaries, dismissals)
The ingestion process involved:
- Cleaning and normalizing raw JSON/CSV data from Cricsheet
- Mapping entities to nodes (players, teams, matches)
- Creating relationships that reflect real cricket interactions
- Enriching relationships with contextual properties
This pipeline ensured that once data entered Neo4j, it was immediately queryable as a connected system and not just stored information.
Importantly, the ingestion pipeline is designed to be incremental and repeatable. As new IPL matches are played and fresh data becomes available, the pipeline can be rerun to seamlessly integrate new seasons, matches, and deliveries into the existing graph without reprocessing historical data. This makes Boundary Graph future-ready — capable of evolving continuously as the tournament unfolds. Check out the data import script here.
Asking Better Questions with Cypher
Once the graph was in place, the graph query language Cypher became the language of exploration. Instead of writing complex SQL joins, queries read closer to natural questions:
- Show me batters who consistently score boundaries against a specific team.
MATCH (batter:Player)-[:BATTED]->(d:Delivery)<-[:HAS_DELIVERY]-(o:Over)
MATCH (o)<-[:HAS_OVER]-(:Innings)<-[:HAS_INNINGS]-(m:Match)
MATCH (bowlingTeam:Team)-[:BOWLED_IN]->(m)
WHERE bowlingTeam.current_name = "Mumbai Indians"
  AND d.is_boundary = true
RETURN batter.name AS batter,
       COUNT(d) AS boundary_count
ORDER BY boundary_count DESC
LIMIT 10;
- Which venues favor aggressive batting across multiple seasons?
MATCH (v:Venue)<-[:PLAYED_AT]-(m:Match)
MATCH (m)-[:HAS_INNINGS]->(:Innings)-[:HAS_OVER]->(:Over)-[:HAS_DELIVERY]->(d:Delivery)
MATCH (m)-[:PART_OF_SEASON]->(s:Season)
WHERE d.is_boundary = true
RETURN v.venue AS venue,
       s.season AS season,
       COUNT(d) AS total_boundaries
ORDER BY total_boundaries DESC;
- How has a player’s boundary pattern evolved as they changed teams?
MATCH (p:Player)-[:PLAYS_FOR]->(t:Team)
MATCH (p)-[:BATTED]->(d:Delivery)
MATCH (d)<-[:HAS_DELIVERY]-(:Over)<-[:HAS_OVER]-(:Innings)<-[:HAS_INNINGS]-(m:Match)
WHERE d.is_boundary = true
RETURN p.name AS player,
       t.current_name AS team,
       COUNT(d) AS boundaries
ORDER BY player, boundaries DESC;
Cypher’s pattern-matching syntax makes intent explicit. You describe what you want to traverse, not how to stitch tables together. This clarity is a major reason why Neo4j works so well for exploratory sports analytics.
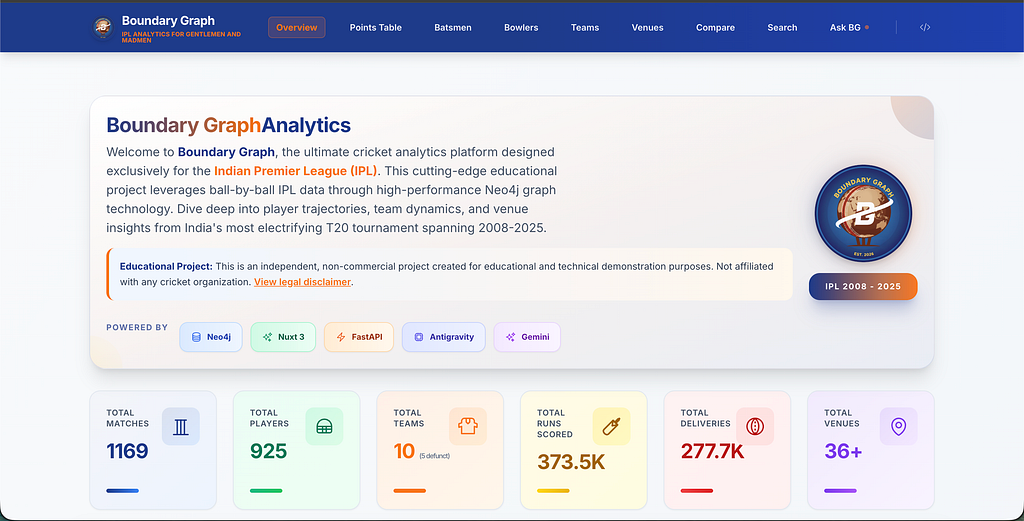
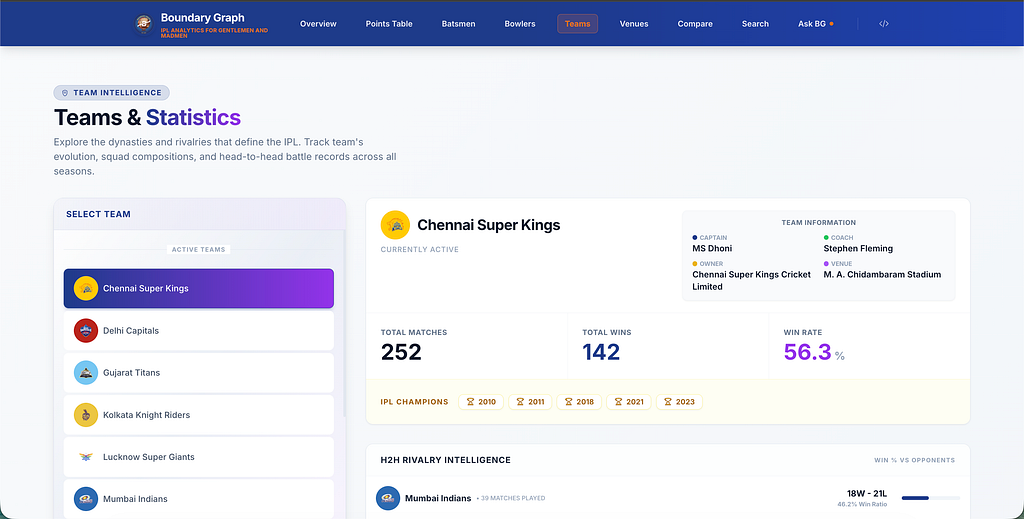
From Graph to Interface
Boundary Graph is not just a database experiment, it is a usable application. The frontend focuses on:
- Clean, distraction-free exploration
- IPL-themed visuals
- Emphasis on insight rather than raw statistics
The backend exposes graph-powered queries via APIs, ensuring that every interaction is backed by relationship-driven logic.
The result is an experience where insights feel discovered, not calculated.
From Dashboard to Dialogue: Introducing Ask BG
As Boundary Graph matured, one realization became increasingly clear: a graph-backed IPL system should not stop at visual exploration.
Dashboards are excellent for known questions. But IPL fandom and sports analysis in general thrives on curiosity, debate, and “what if” scenarios. That naturally led to the next evolution of the project.
Ask BG: Querying IPL in Natural Language
Ask BG is an upcoming feature designed to turn Boundary Graph from a read-only dashboard into an interactive, queryable assistant.
The idea is simple but powerful:
What if you could ask IPL questions in plain English and get a textual AND graph answer?
Examples of questions Ask BG is designed to handle:
- “Which batters have dominated left-arm pacers at Wankhede?”
- “Show boundary patterns of a player before and after changing teams”
- “Which venues historically favor chasing teams in playoffs?”
Under the hood, Ask BG will translate natural language into (one or more) Cypher queries, execute them against Neo4j, and return grounded, explainable answers backed directly by the graph.
This shifts the experience from exploration by clicking to exploration by conversation.
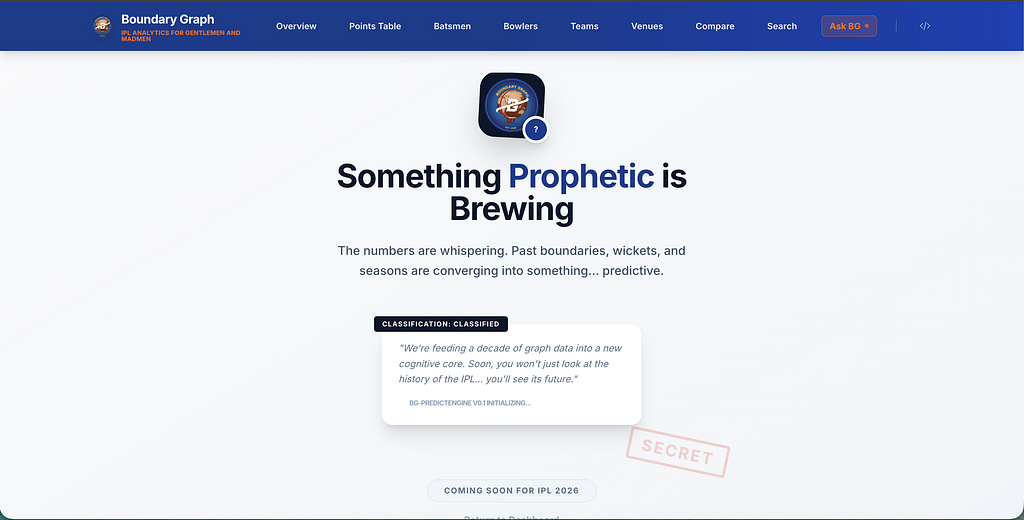
Beyond Queries: Can a Graph Predict IPL 2026?
With delivery-level historical data modeled as a graph, the next logical question is not just what happened, but what might happen.
Ask BG opens the door to experimentation around prediction and simulation, including:
- Team performance projections based on historical matchups
- Venue-adjusted scoring expectations
- Player impact analysis across seasons and roles
One particularly exciting (and intentionally ambitious) idea is:
Can Boundary Graph predict a likely IPL 2026 winner using historical graph patterns?
Rather than treating prediction as a black-box ML problem, the graph allows for:
- Transparent feature extraction (relationships, patterns, dependencies)
- Explainable reasoning paths (why a team is favored)
- Iterative hypothesis testing driven by domain intuition
Whether the prediction is ultimately right or wrong is less important than how the reasoning is derived which something graph-based systems excel at.
Stay tuned for more updates as I roll out Ask BG and related capabilities in the coming weeks, pushing Boundary Graph further from a static visualization tool into an interactive, graph-powered reasoning system.
Boundary Graph is open-source and available on GitHub. If you are curious about Neo4j, graph modeling, or sports analytics: this is a great place to start.
Boundary Graph: Exploring the IPL Through the Lens of Graphs was originally published in Neo4j Developer Blog on Medium, where people are continuing the conversation by highlighting and responding to this story.
Share Article


Explore
Related Articles

Hey LLM, you’re using OPTIONAL MATCH wrong. Here’s the Cypher that actually works.